Segmentation Quick Reference
| Dimension | Sub-Segments | Dominant Segment | Fastest Growing Segment |
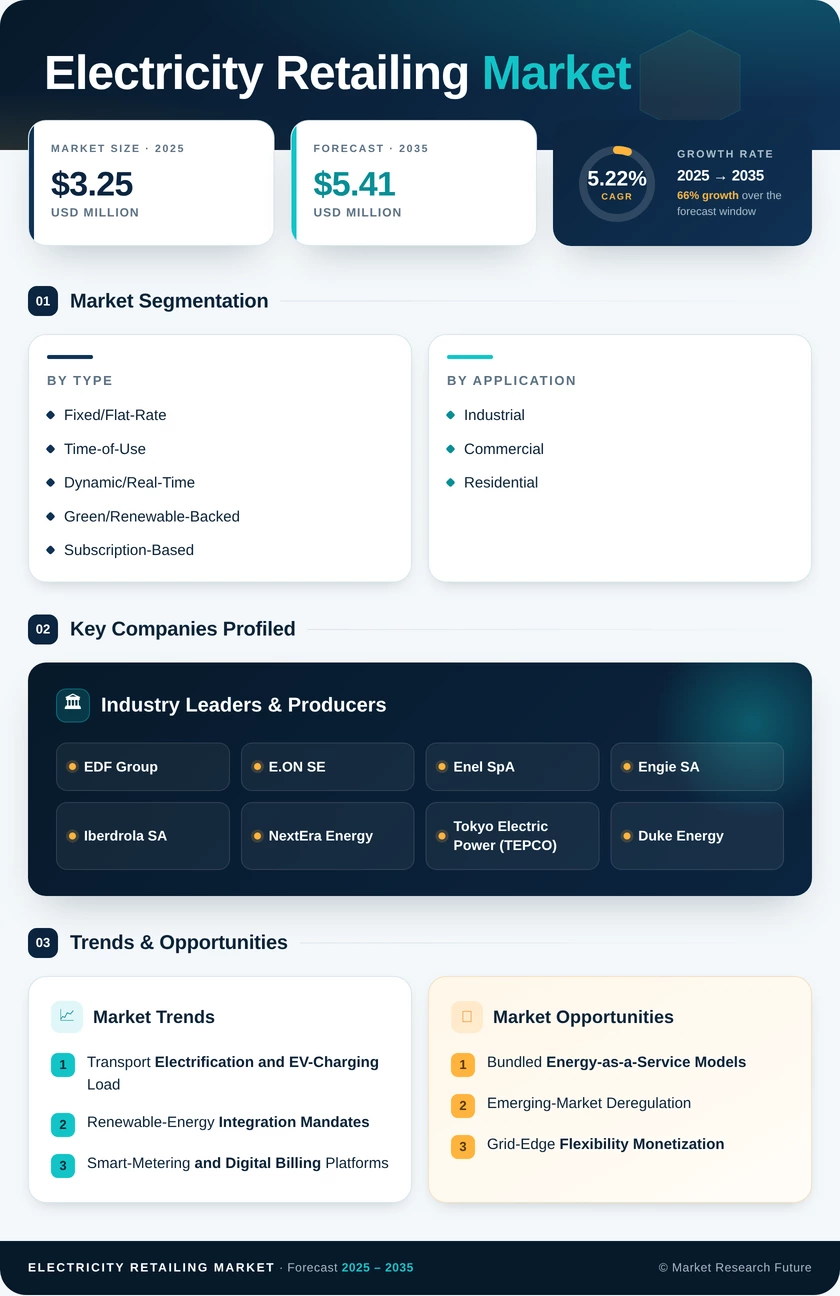
| By Tariff Type | Fixed/Flat-Rate, Time-of-Use, Dynamic/Real-Time, Green/Renewable-Backed, Subscription-Based | Fixed/Flat-Rate (47.5% share, 2025) | Green/Renewable-Backed (7.92% CAGR) |
| By End-User | Residential, Commercial, Industrial | Industrial (46.0% share, 2025) | Commercial (6.35% CAGR) |
| By Geography | North America, Europe, Asia-Pacific, South America, Middle East & Africa | Asia-Pacific (49.0% share, 2025) | Asia-Pacific (6.14% CAGR) |
Market Segmentation Overview
By Tariff Type
| Sub-Segment | Key Trend |
| Fixed/Flat-Rate | Remains default in regulated markets; gradual erosion as smart-meter penetration enables variable products. |
| Time-of-Use | Growing adoption driven by utility-side load management and EV off-peak charging incentives |
| Dynamic/Real-Time | Favored by industrial and data-center customers seeking cost optimization through wholesale-price exposure |
| Green/Renewable-Backed | Fastest-growing tariff segment, propelled by corporate ESG commitments and consumer environmental awareness |
| Subscription-Based | Emerging model offering flat monthly fees for unlimited consumption, pioneered in Nordic markets. |
Tariff-type segmentation reflects the ongoing transition from static, cost-plus pricing toward flexible, customer-centric energy products. Retailers are increasingly layering tariff innovation onto smart-metering infrastructure to differentiate their offerings and reduce customer churn in competitive markets.
By End-User
| Sub-Segment | Key Trend |
| Residential | Volume growth tied to housing electrification, heat-pump adoption, and EV home-charging |
| Commercial | Fastest-growing segment driven by building-level energy management and fleet electrification |
| Industrial | Largest segment by revenue; long-term bilateral contracts dominate, with increasing PPA adoption |
End-user segmentation underscores the distinct procurement behaviors across customer classes. Industrial buyers negotiate bespoke multi-year contracts, commercial customers seek bundled energy-management solutions, and residential consumers increasingly respond to digital engagement and tariff-comparison platforms that simplify switching.