Electronic Flight Bag Market Summary
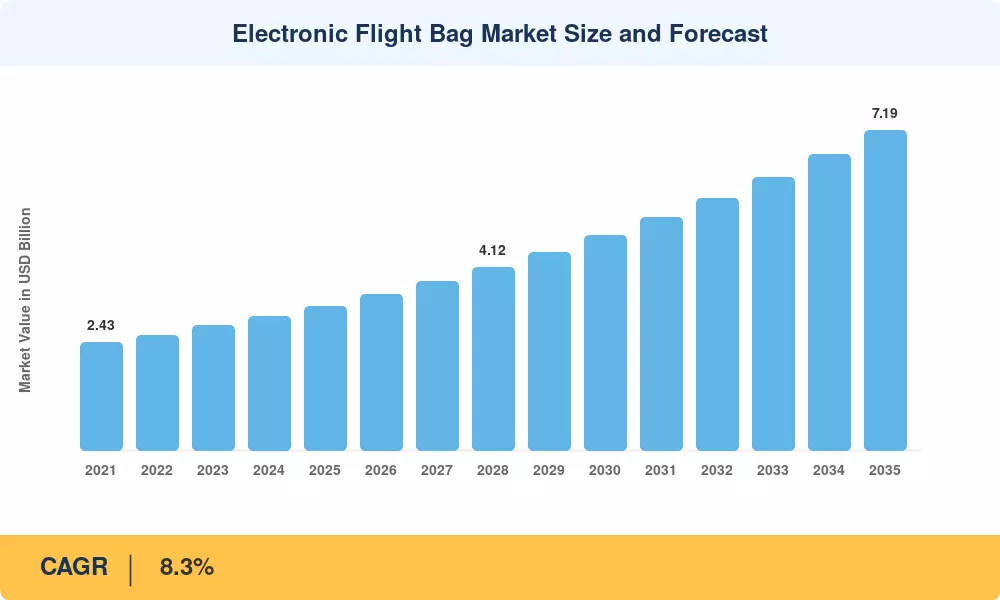
The Electronic Flight Bag Market was valued at USD 3.24 billion in 2025 and is projected to grow from USD 3.51 billion in 2026 to USD 7.19 billion by 2035, registering a CAGR of 8.3% over the forecast period. Two catalysts are driving this trajectory: the FAA's 2024 Advisory Circular update mandating real-time aeronautical data synchronization for Part 121 operators, and EASA's parallel push to harmonize EFB certification standards across EU member states [1]. Together, these regulatory shifts are accelerating fleet-wide adoption and compelling airlines that still rely on legacy paper-based operations to invest in integrated EFB platforms.
The technology shift that is changing the Electronic Flight Bag Market is focused on replacing printed flight manuals, paper Jeppesen charts and manual weight-and-balance computations with cloud-hosted software suites on Class 2 and Class 3 hardware. A single wide-body aircraft creates an estimated 12,000 pages of operating documentation per year, IATA estimates. Digitizing this paper saves per aircraft paper expenses by an estimated USD 3,000-5,000 per year, and also reduces fuel use from carrying additional weight. Airlines are subscribing to SaaS subscriptions on a recurrent basis, as opposed to one-off hardware purchases, which is changing vendor business structures across the industry.
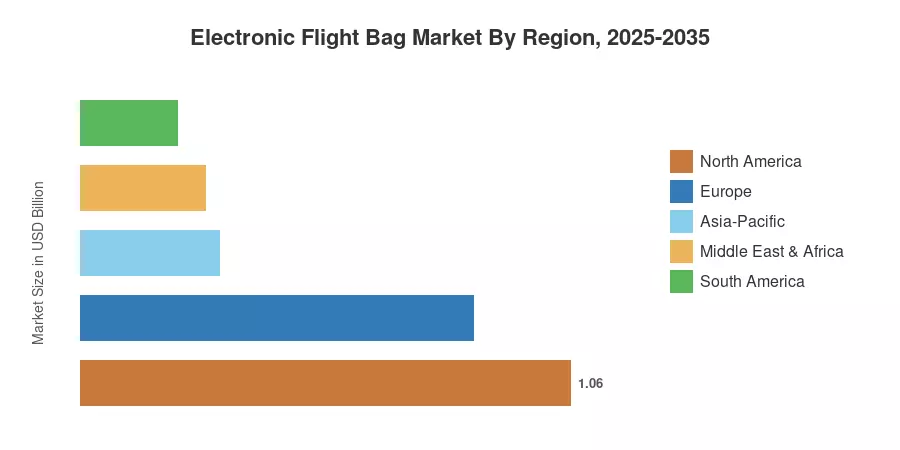
North America accounted for around 35.1% of the Electronic Flight Bag Market in 2024, driven by early legislative mandates by the FAA and deep penetration into the fleet by major U.S. carriers. Asia-Pacific, the fastest expanding market, is predicted to increase at a 10.1% CAGR to 2035, driven by fleet expansion in China, India and Southeast Asia and leading to first-time EFB adoption. Europe was the second-highest market with about 28.4%, led by Lufthansa Group, Air France, KLM and other flag airlines investing in next-generation cockpit digitalization [4]. The Electronic Flight Bag Market is set for a decade of steady growth, fueled by the convergence of connectivity upgrades, AI-based analytics, and more stringent regulations.
Key Report Takeaways
• By Component
- Hardware accounted for 58.2% of the Electronic Flight Bag Market in 2024, reflecting continued demand for ruggedized Class 2 tablets and mounted displays.
- Software is projected to advance at a 9.7% CAGR through 2035, outpacing all other component segments as operators migrate toward subscription-based platforms.
• By Platform
- Commercial aviation held 70.5% of revenue in 2024, driven by mandatory EFB adoption among Part 121 and EASA-certified carriers.
- General aviation is expected to expand at an 8.7% CAGR as pilot navigation software becomes affordable for owner-operators and charter fleets.
• By Region
- North America led the Electronic Flight Bag Market with a 35.1% revenue share in 2024, backed by the FAA regulatory infrastructure.
- Asia-Pacific is forecast to register the strongest regional CAGR of 10.1% to 2035.
Market Size and Forecast (2021–2035)
Market Research Future employs a triangulated methodology combining top-down revenue analysis from company filings, bottom-up fleet-penetration modeling across 140+ commercial airlines, and demand-side surveys of MRO providers and OEM channel partners. Historical figures are validated against IATA fleet statistics, while forecast projections apply a compound growth model calibrated to regulatory adoption curves and technology replacement cycles.





















.webp?v=1783952245)
