Energy as a Service Market (2026 - 2035)

ID: MRFR/ICT/5146-HCR
200 Pages
Nirmit Biswas
Last Updated: July 01, 2026
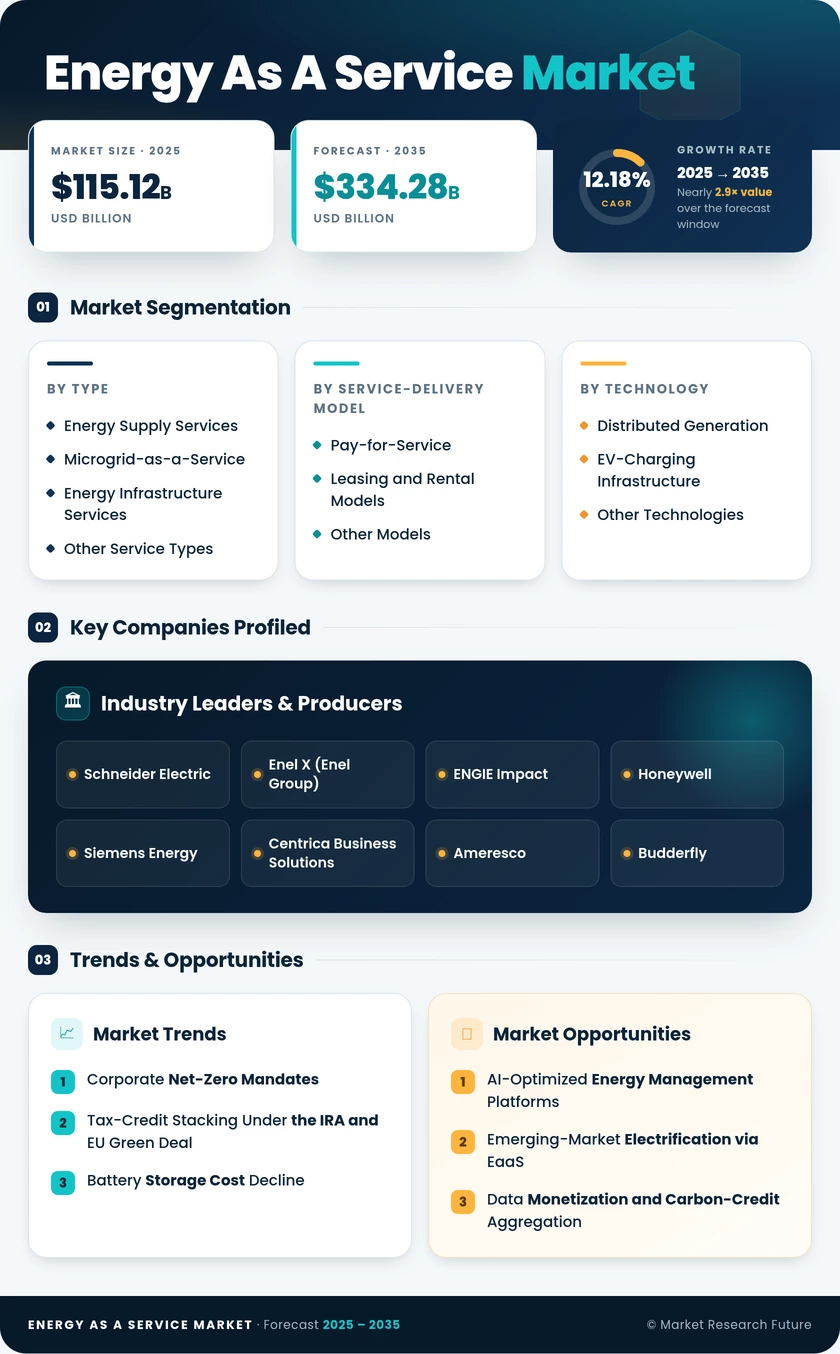
Energy As A Service Market Size, Share and Research Report By Service Type (Energy Supply Services, Microgrid-as-a-Service, Energy Infrastructure Services, Other Service Types), By Service-Delivery Model (Pay-for-Service, Leasing and Rental Models, Other Models), By Technology (Distributed Generation, EV-Charging Infrastructure, Other Technologies), By End User (Commercial, Industrial) and By Region (North America, Europe, South America, Asia Pacific, Middle East and Africa) - Industry Forecast to 2035.
Energy as a Service Market

Market Size

Forecast Period2026-2035
CAGR (2026-2035)12.18%
2025 Market SizeUSD 115.12 Billion
2035 Market SizeUSD 334.28 Billion

Key Players

Schneider Electric
Enel X
ENGIE Impact
Honeywell
Siemens Energy
Centrica Business Solutions
Opportunities
  • AI-Optimized Energy Management Platforms
  • Emerging-Market Electrification via EaaS
  • Data Monetization and Carbon-Credit Aggregation
  1. 1 Market Overview |
    1. 1.1 Study Assumptions & Market Definition |
    2. 1.2 Scope of the Study |
    3. 1.3 Research Methodology
  2. 2 Market Summary & Key Takeaways
  3. 3 Market Dynamics |
    1. 3.1 Market Drivers Analysis | |
      1. 3.1.1 Corporate Net-Zero Mandates | |
      2. 3.1.2 Tax-Credit Stacking (IRA, EU Green Deal) | |
      3. 3.1.3 Battery Storage Cost Decline | |
      4. 3.1.4 Grid-Reliability and Resilience Concerns | |
      5. 3.1.5 AI-Driven Energy Analytics Adoption | |
      6. 3.1.6 Fleet Electrification and EV-Charging Demand | |
      7. 3.1.7 Emerging-Market Urbanization |
    2. 3.2 Market Restraints Analysis | |
      1. 3.2.1 Complex Multi-Party Contract Structures | |
      2. 3.2.2 Utility-Franchise and Regulatory Barriers | |
      3. 3.2.3 Counterparty Credit Risk for Long-Term PPAs | |
      4. 3.2.4 Interconnection Queue Delays | |
      5. 3.2.5 Technology Performance Uncertainty in Nascent Solutions |
    3. 3.3 Market Opportunity Analysis | |
      1. 3.3.1 AI-Optimized Energy Management Platforms | |
      2. 3.3.2 Emerging-Market Electrification via EaaS | |
      3. 3.3.3 Data Monetization and Carbon-Credit Aggregation | |
      4. 3.3.4 Fleet Electrification and Charging-as-a-Service | |
      5. 3.3.5 Resilience-as-a-Service for Critical Infrastructure |
    4. 3.4 Industry Value Chain Analysis |
    5. 3.5 Porter's Five Forces Analysis
  4. 4 Global Energy as a Service Market Size & Forecast (2021–2035) |
    1. 4.1 Historical Market Size (2021–2025) |
    2. 4.2 Current & Forecast Market Size (2026–2035) |
    3. 4.3 Market Size by Revenue (USD Billion) |
    4. 4.4 Year-over-Year Growth Analysis
  5. 5 Segmentation Analysis |
    1. 5.1 By Service Type | |
      1. 5.1.1 Energy Supply Services | |
      2. 5.1.2 Microgrid-as-a-Service | |
      3. 5.1.3 Energy Infrastructure Services | |
      4. 5.1.4 Other Service Types |
    2. 5.2 By Service-Delivery Model | |
      1. 5.2.1 Pay-for-Service | |
      2. 5.2.2 Leasing and Rental Models | |
      3. 5.2.3 Other Models |
    3. 5.3 By Technology | |
      1. 5.3.1 Distributed Generation | |
      2. 5.3.2 EV-Charging Infrastructure | |
      3. 5.3.3 Other Technologies |
    4. 5.4 By End User | |
      1. 5.4.1 Commercial | |
      2. 5.4.2 Industrial
  6. 6 Regional Analysis |
    1. 6.1 North America | |
      1. 6.1.1 United States | |
      2. 6.1.2 Canada | |
      3. 6.1.3 Mexico |
    2. 6.2 Europe | |
      1. 6.2.1 Germany | |
      2. 6.2.2 United Kingdom | |
      3. 6.2.3 France | |
      4. 6.2.4 Italy | |
      5. 6.2.5 Spain | |
      6. 6.2.6 Nordic Countries | |
      7. 6.2.7 Russia | |
      8. 6.2.8 Rest of Europe |
    3. 6.3 Asia-Pacific | |
      1. 6.3.1 China | |
      2. 6.3.2 India | |
      3. 6.3.3 Japan | |
      4. 6.3.4 South Korea | |
      5. 6.3.5 ASEAN | |
      6. 6.3.6 Rest of Asia-Pacific |
    4. 6.4 South America | |
      1. 6.4.1 Brazil | |
      2. 6.4.2 Argentina | |
      3. 6.4.3 Rest of South America |
    5. 6.5 Middle East & Africa | |
      1. 6.5.1 Saudi Arabia | |
      2. 6.5.2 UAE | |
      3. 6.5.3 South Africa | |
      4. 6.5.4 Egypt | |
      5. 6.5.5 Rest of MEA
  7. 7 Competitive Landscape |
    1. 7.1 Market Share Analysis (2025) |
    2. 7.2 Competitive Benchmarking Matrix |
    3. 7.3 Company Profiles | |
      1. 7.3.1 Schneider Electric | |
      2. 7.3.2 Enel X (Enel Group) | |
      3. 7.3.3 ENGIE Impact | |
      4. 7.3.4 Honeywell | |
      5. 7.3.5 Siemens Energy | |
      6. 7.3.6 Centrica Business Solutions | |
      7. 7.3.7 Ameresco | |
      8. 7.3.8 Budderfly | |
      9. 7.3.9 GridPoint | |
      10. 7.3.10 Sparkfund
  8. 8 Future Outlook & Strategic Recommendations (2026–2035) |
    1. 8.1 AI-Autonomous Energy Optimization |
    2. 8.2 Platform Economics and Ecosystem Aggregation |
    3. 8.3 Electrification Supercycle and Sector Coupling |
    4. 8.4 ESG Reporting and Verified Carbon Disclosure
  9. 9 Recent Developments & News
  10. 10 Frequently Asked Questions (FAQs)
  11. 11 Report Scope & Methodology |
    1. 11.1 Study Period & Base Year |
    2. 11.2 Data Sources & Citations |
    3. 11.3 Abbreviations ---
  12. 12 LIST OF TABLES |
  13. TABLE 1 Global Energy as a Service Market Size & Forecast, by Revenue (USD Billion), 2021–2035 |
  14. TABLE 2 Global Energy as a Service Market — Year-over-Year Growth Analysis, 2021–2035 |
  15. TABLE 3 Global Energy as a Service Market — Driver Impact Analysis |
  16. TABLE 4 Global Energy as a Service Market — Restraint Impact Analysis |
  17. TABLE 5 Global Energy as a Service Market Size, by Service Type, 2021–2035 (USD Billion) |
  18. TABLE 6 Global Energy as a Service Market Size, by Service-Delivery Model, 2021–2035 (USD Billion) |
  19. TABLE 7 Global Energy as a Service Market Size, by Technology, 2021–2035 (USD Billion) |
  20. TABLE 8 Global Energy as a Service Market Size, by End User, 2021–2035 (USD Billion) |
  21. TABLE 9 Global Energy as a Service Market Size, by Region, 2021–2035 (USD Billion) |
  22. TABLE 10 North America Energy as a Service Market Size, by Country, 2021–2035 (USD Billion) |
  23. TABLE 11 Europe Energy as a Service Market Size, by Country, 2021–2035 (USD Billion) |
  24. TABLE 12 Asia-Pacific Energy as a Service Market Size, by Country, 2021–2035 (USD Billion) |
  25. TABLE 13 South America Energy as a Service Market Size, by Country, 2021–2035 (USD Billion) |
  26. TABLE 14 Middle East & Africa Energy as a Service Market Size, by Country, 2021–2035 (USD Billion) |
  27. TABLE 15 Competitive Benchmarking Matrix — Global Energy as a Service Market, 2025 |
  28. TABLE 16 Company Profiles — Key Players, Global Energy as a Service Market |
  29. TABLE 17 Recent Developments & Strategic Announcements, 2023–2025 |
  30. TABLE 18 Report Scope & Methodology Summary |
  31. TABLE 19 Detailed Sources and Citations ---
  32. 13 LIST OF FIGURES |
  33. FIGURE 1 Energy as a Service Market Dynamics — Drivers, Restraints, and Opportunities |
  34. FIGURE 2 Industry Value Chain Analysis — Energy as a Service Market |
  35. FIGURE 3 Porter's Five Forces Analysis — Energy as a Service Market |
  36. FIGURE 4 Global Energy as a Service Market Size Trend (USD Billion), 2021–2035 |
  37. FIGURE 5 Energy as a Service Market Share, by Service Type, 2025 |
  38. FIGURE 6 Energy as a Service Market Share, by Service-Delivery Model, 2025 |
  39. FIGURE 7 Energy as a Service Market Share, by Technology, 2025 |
  40. FIGURE 8 Energy as a Service Market Share, by End User, 2025 |
  41. FIGURE 9 Energy as a Service Market Share, by Region, 2025 |
  42. FIGURE 10 North America Energy as a Service Market Share, by Country, 2025 |
  43. FIGURE 11 Europe Energy as a Service Market Share, by Country, 2025 |
  44. FIGURE 12 Asia-Pacific Energy as a Service Market Share, by Country, 2025 |
  45. FIGURE 13 South America Energy as a Service Market Share, by Country, 2025 |
  46. FIGURE 14 Middle East & Africa Energy as a Service Market Share, by Country, 2025 |
  47. FIGURE 15 Competitive Landscape — Market Share Analysis, 2025 ---

Segmentation Quick Reference

DimensionSub-SegmentsDominant SegmentFastest Growing Segment
Service TypeEnergy Supply Services, Microgrid-as-a-Service, Energy Infrastructure Services, OtherEnergy Supply ServicesMicrogrid-as-a-Service
Service-Delivery ModelPay-for-Service, Leasing and Rental Models, OtherPay-for-ServiceLeasing and Rental Models
Energy as a Service MarketDistributed Generation, EV-Charging Infrastructure, OtherDistributed GenerationEV-Charging Infrastructure
End UserCommercial, IndustrialCommercialIndustrial
GeographyNorth America, Europe, Asia-Pacific, South America, Middle East & AfricaNorth AmericaAsia-Pacific


  • --

Market Segmentation Overview

By Service Type

Sub-SegmentKey Trend
Energy Supply ServicesRising corporate PPA volumes; shift from unbundled RECs to contracted clean energy
Microgrid-as-a-ServiceResilience-first procurement among hospitals, data centers, and military facilities
Energy Infrastructure ServicesDeep-retrofit financing for HVAC, building envelope, and LED lighting upgrades
Other Service TypesEnergy auditing, consulting, and carbon-accounting advisory services


Energy Supply Services remain the revenue backbone of the Energy as a Service Market, driven by multinational corporations replacing spot-market electricity exposure with long-term contracted renewable supply. Microgrid-as-a-Service is accelerating as climate-related grid disruptions compel facility operators to invest in islanding-capable systems.

By Service-Delivery Model

Sub-SegmentKey Trend
Pay-for-ServiceOutcome-linked pricing tied to energy savings or uptime guarantees
Leasing and Rental ModelsAsset-light access to rooftop solar, batteries, and EV chargers
Other ModelsShared-savings, managed-energy, and performance-contracting hybrids


Pay-for-Service contracts dominate because they transfer performance risk from the customer to the provider. Leasing and Rental models are expanding most rapidly, opening the Energy as a Service Market to tenants with limited capital-expenditure authority.

By Energy as a Service Market

Sub-SegmentKey Trend
Distributed GenerationRooftop solar PV and combined heat-and-power installations
EV-Charging InfrastructureDepot-level fleet charging integrated with building energy management
Other TechnologiesBattery storage, demand response, smart controls, and IoT platforms


Distributed Generation forms the technology foundation of most EaaS contracts, while EV-Charging Infrastructure is the fastest-growing segment as commercial fleets electrify at scale.

By End User

Sub-SegmentKey Trend
CommercialOffice, retail, healthcare, and hospitality energy procurement
IndustrialProcess-heat electrification, carbon-border compliance, and heavy-load management


Commercial facilities account for the majority of EaaS revenue due to immediate decarbonization pressure and multi-site portfolio optimization needs. Industrial adoption is accelerating as manufacturers seek alternatives to fossil-fired process energy.

By Geography

Sub-SegmentKey Trend
North AmericaIRA incentives; state-level renewable mandates; corporate PPA leadership
EuropeEU Green Deal; EPBD renovation wave; offshore wind integration
Asia-PacificIndia PLI scheme; China carbon ETS; ASEAN grid interconnection
South AmericaBrazil distributed-solar boom; Chile green-hydrogen corridor
Middle East & AfricaGulf solar PPAs; Sub-Saharan mini-grid electrification


North America commands the largest share of the Energy as a Service Market, while Asia-Pacific is growing fastest. Europe maintains a strong second position anchored by regulatory mandates driving energy efficiency financing through EaaS models across the building stock.


Download PDF ×

We do not share your information with anyone. However, we may send you emails based on your report interest from time to time. You may contact us at any time to opt-out.