Segmentation Quick Reference
| Dimension | Sub-Segments | Dominant Segment | Fastest Growing Segment |
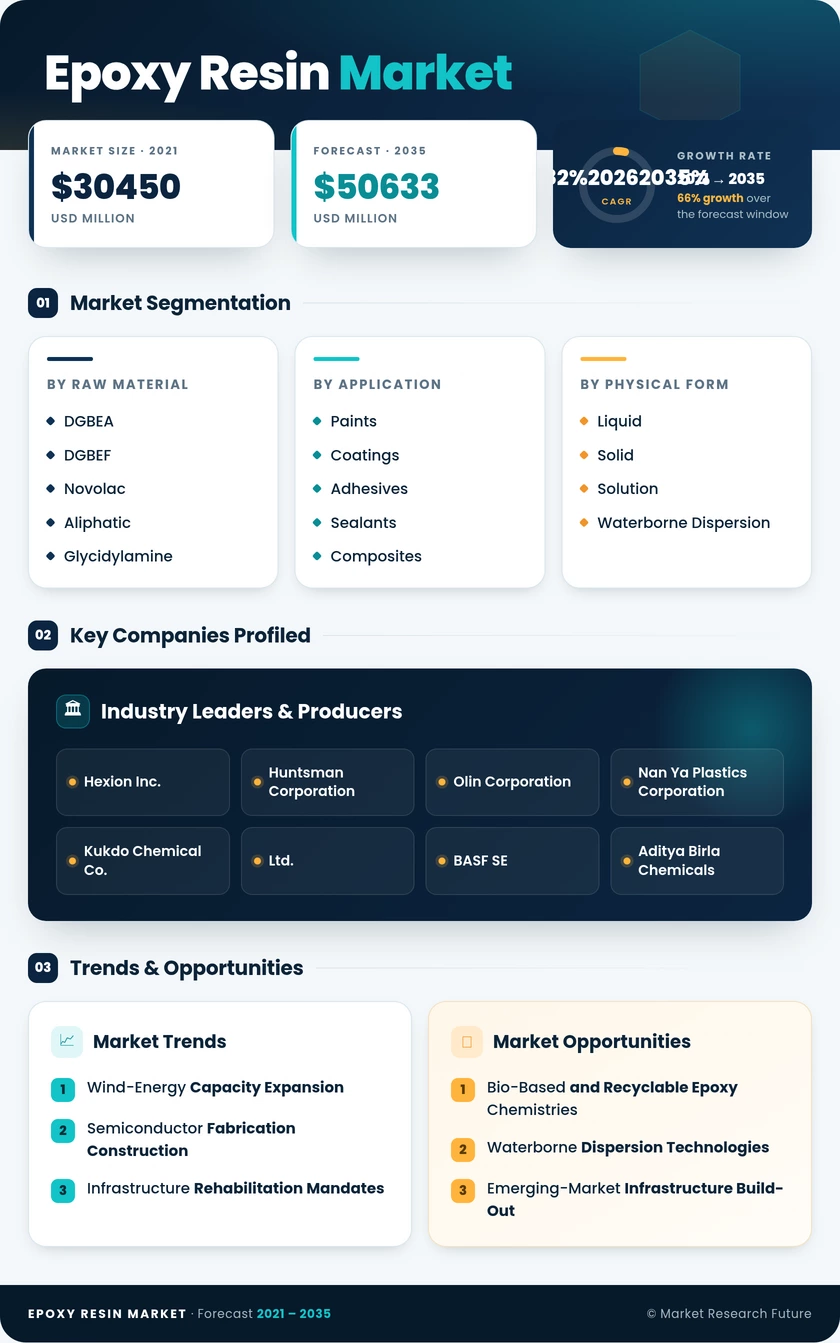
| By Raw Material | DGBEA, DGBEF, Novolac, Aliphatic, Glycidylamine, Others (Bio-based, Cycloaliphatic) | DGBEA (Bisphenol A and ECH) | Others (Bio-based, Cycloaliphatic) |
| By Application | Paints and Coatings, Adhesives and Sealants, Composites, Electrical and Electronics, Others | Paints and Coatings | Composites |
| By Physical Form | Liquid, Solid, Solution, Waterborne Dispersion | Liquid | Waterborne Dispersion |
| By Geography | Asia-Pacific, North America, Europe, South America, the Middle East & Africa | Asia-Pacific | Asia-Pacific |
Market Segmentation Overview
By Raw Material
| Sub-Segment | Key Trend |
| DGBEA (Bisphenol A and ECH) | Dominant workhorse resin facing BPA regulatory headwinds |
| DGBEF (Bisphenol F and ECH) | Preferred for chemical-resistant industrial and marine coatings |
| Novolac (Formaldehyde and Phenols) | Growing in high-temperature semiconductor and aerospace use |
| Aliphatic (Aliphatic Alcohols) | UV-stable formulations are gaining traction in outdoor coatings |
| Glycidylamine (Aromatic Amines and ECH) | High crosslink density valued in aerospace prepregs |
| Others (Bio-based, Cycloaliphatic) | Fastest-growing grade as sustainability mandates intensify |
DGBEA resins remain the foundation of the global epoxy supply chain, yet regulatory scrutiny around bisphenol A is accelerating reformulation toward bio-based and bisphenol-F alternatives. Novolac and glycidylamine grades serve high-performance niches where thermal and chemical resistance justify premium pricing.
By Application
| Sub-Segment | Key Trend |
| Paints and Coatings | Waterborne shift driven by VOC regulations |
| Adhesives and Sealants | Structural bonding growth in automotive and electronics |
| Composites | Wind energy and aerospace lightweighting are driving volume |
| Electrical and Electronics | Miniaturization and advanced packaging demand ultra-pure resins |
| Others | Tooling, casting, and artisanal applications |
Paints and coatings dominate consumption but face compositional disruption as waterborne dispersions replace solvent-borne systems. Composites are expanding rapidly, supported by global commitments to renewable-energy capacity and transportation efficiency targets.
By Physical Form
| Sub-Segment | Key Trend |
| Liquid | Standard format for infusion, spray, and brush application |
| Solid | Powder coatings and epoxy molding compounds for electronics |
| Solution | Electrical varnishes and wire-coating applications |
| Waterborne Dispersion | Fastest-growing form as VOC limits tighten globally |
Liquid resins serve the broadest application base, while waterborne dispersions are gaining share as environmental regulations penalize high-VOC formulations across developed and emerging economies alike.