Epoxy Resin Market

Key Players: Hexion Inc., Huntsman Corporation, Olin Corporation, Nan Ya Plastics Corporation, Kukdo Chemical Co., Ltd., BASF SE, Aditya Birla Chemicals, Chang Chun Group

Epoxy Resin Market

Epoxy Resin Market Size, Share & Industry Analysis Research Report Information By Type (DGBEA, Novolac, DGBEF, Aliphatic, Glycidylamine, Others), By Technology (Solvent Cut Epoxy, Liquid Epoxy, Waterborne Epoxy, Others), By Application (Composites, Paints & Coatings, Grouts & Mortars, Adhesives, Electronic Encapsulation), By End-Use (Aerospace, Automotive & Transportation, Building & Construction, Electrical & Electronics, Marine), and By Region (North America, Europe, Asia-Pacific, and Rest of the World) - Forecast Till 2035
ID: MRFR/CnM/1204-CR
111 Pages
Chitranshi Jaiswal
Last Updated: June 16, 2026

Epoxy Resin Market Summary

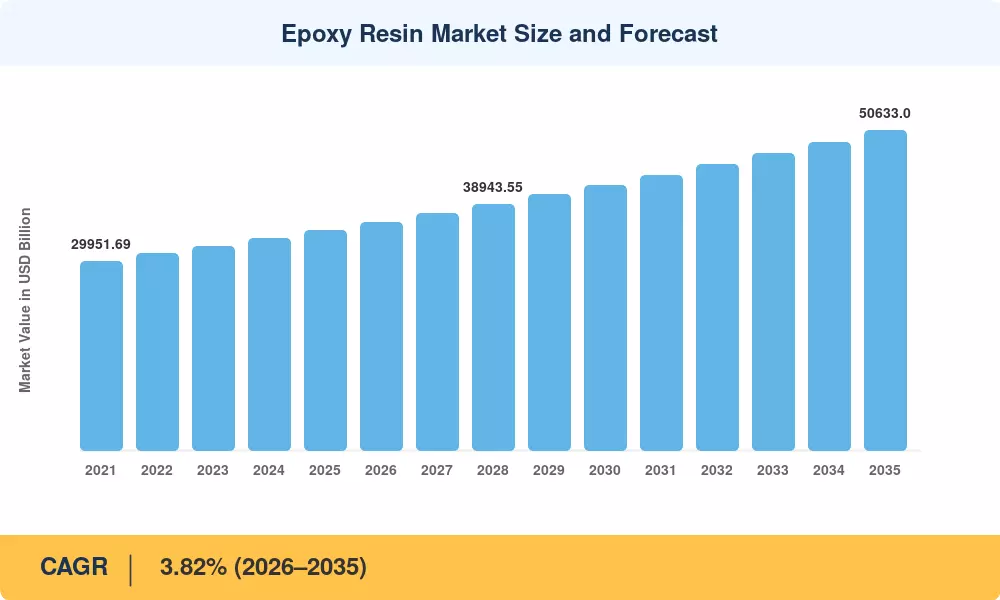
The global Epoxy Resin Market reached an estimated USD 34,800 million in 2025 and is projected to climb from USD 36,130 million in 2026 to USD 50,633 million by 2035, registering a CAGR of 3.82% during 2026–2035. This trajectory reflects sustained capital allocation toward renewable-energy infrastructure—particularly wind-turbine blade manufacturing—and a global push for electrification that demands high-reliability thermosetting resin materials in power electronics and battery enclosures[2]. Government stimulus packages in the United States, China, and the European Union continue to earmark billions of dollars for grid modernization and highway rehabilitation, directly boosting consumption of industrial coating resins and adhesive resin compounds.

Technology is impacting the Epoxy Resin Market with legacy solvent-borne formulations being replaced by waterborne, bio-circular and low-VOC chemistries. Since 2022, resin manufacturers have invested over $2.4 billion in total on next-generation laminating resin systems [3] because of stricter rules on exposure to bisphenol A and volatile organic compounds. These investments target recyclable thermoset chemistries and plant-based feedstocks that can meet both performance standards and sustainability mandates.


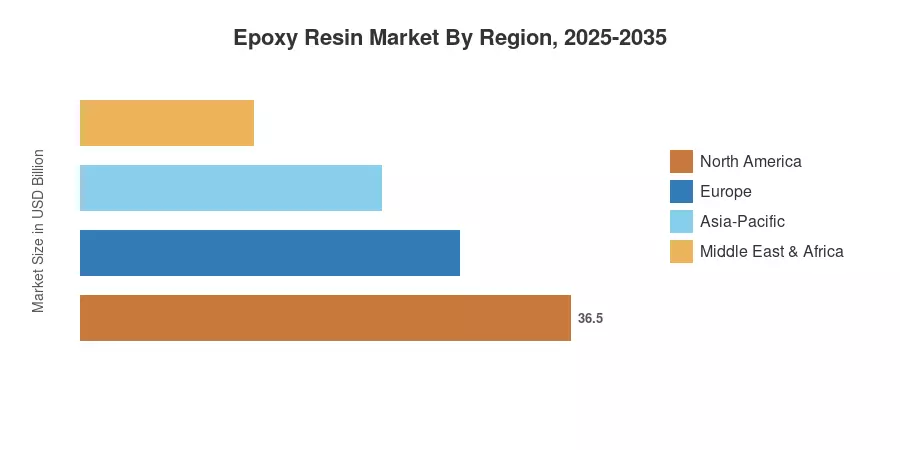
Asia-Pacific holds approximately 43.8% of the Epoxy Resin Market, aided by China’s construction boom and India’s infrastructure expansion. Europe is a little behind at around 23.2% share, driven by wind energy and environmental regulations that are speeding up the use of protective coating chemicals. North America has a stake of around 22.5%, owing to the reshoring of semiconductor manufacture. The market will travel on an upward trend till 2035 due to the rising demand for composite resin materials in aerospace and automotive lightweighting in the next few years [4][5].


Key Report Takeaways

• By Raw Material

  • DGBEA (Bisphenol A and ECH) resins captured approximately 39.5% of the Epoxy Resin Market in 2025, driven by their versatility in industrial coating resins and adhesive resin compounds.
  • Bio-based and cycloaliphatic grades are forecast to expand at a 7.18% CAGR through 2035, reflecting heightened demand for specialty resin chemicals that comply with evolving BPA regulations.
  • Novolac epoxy resins continue to anchor the Epoxy Resin Market for high-temperature electrical insulation resins, particularly in semiconductor packaging.

• By Application

  • Paints and coatings held a 54.2% share of the Epoxy Resin Market in 2025, underpinned by infrastructure rehabilitation programs globally.
  • Composites represent the fastest-growing application segment at a 5.95% CAGR, fueled by wind-energy and aerospace demand for composite resin materials.

• By Geography

  • Asia-Pacific accounted for 43.8% of the Epoxy Resin Market in 2025 and is projected to post a 6.55% CAGR through 2035.
  • North America's growth is propelled by semiconductor fab construction and highway refurbishment programs that consume large volumes of construction resin products.


Epoxy Resin Market Size and Forecast (2021–2035)

MRFR’s market sizing technique involves triangulating supply-side shipment data from resin producers, downstream procurement quantities of coating and adhesive manufacturers, and import-export customs databases spanning 42 countries. Historical numbers are based on audited yearly reports and official statistical yearbooks. Forecast estimates are based on regression models, calibrated to industrial production indices, trends in construction permits and energy-investment roadmaps[6].

Epoxy Resin Market Size and Forecast
Our Impact
Enabled $4.3B Revenue Impact for Fortune 500 and Leading Multinationals
Partnering with 2000+ Global Organizations Each Year
30K+ Citations by Top-Tier Firms in the Industry

Driver Impact Analysis

Driver ~% Impact on CAGR Geographic Relevance Impact Timeline
Wind-energy capacity expansion +0.85% Global Long-term (≥4 yr)
Semiconductor fab construction wave +0.55% North America, Asia-Pacific Medium-term (2–4 yr)
Infrastructure rehabilitation mandates +0.50% North America, Europe Short-term (≤2 yr)
Automotive lightweighting via composites +0.40% Europe, Asia-Pacific Medium-term (2–4 yr)
Waterborne and low-VOC regulatory push +0.35% Europe, North America Short-term (≤2 yr)
EV battery encapsulation growth +0.30% Asia-Pacific Medium-term (2–4 yr)
Smart-grid and T&D infrastructure +0.25% Global Long-term (≥4 yr)


Wind-Energy Capacity Expansion

The Global Wind Energy Council projects cumulative installed capacity to reach 1,400 GW by 2030, requiring an estimated 2.8 million metric tons of composite resin materials annually for blade production alone [2]. Epoxy resins remain the preferred matrix for large offshore blades exceeding 80 meters due to their superior fatigue resistance and adhesion to glass and carbon fibers. The Epoxy Resin Market benefits directly from this demand, as each megawatt of offshore wind capacity consumes roughly 12–14 tons of thermosetting resin materials, including laminating resin systems and adhesive resin compounds used in structural bonding.

Semiconductor Fabrication Construction

The CHIPS and Science Act in the United States has catalyzed more than USD 200 billion in announced fab investments through 2030 [12]. Epoxy molding compounds used for chip encapsulation, die attachment, and underfilling represent a high-value niche within the Epoxy Resin Market. Electrical insulation resins tailored for advanced packaging—particularly fan-out wafer-level formats—must deliver sub-10 ppm ionic impurity levels, a specification that keeps barriers to entry elevated.

Infrastructure Rehabilitation Mandates

The U.S. Infrastructure Investment and Jobs Act allocates USD 110 billion for roads and bridges through 2026, with protective coating chemicals and construction resin products specified in federal durability standards for bridge-deck overlays and rebar coatings [10]. Europe's Connecting Europe Facility similarly earmarks EUR 33 billion for transport corridors, sustaining demand for industrial coating resins that protect steel reinforcements in aggressive environments.

EV Battery Encapsulation

The global transition toward electric mobility continues to accelerate, with projections indicating that electric vehicle (EV) adoption will constitute a significant majority of new light-duty vehicle sales by 2030. Battery-pack assembly remains a critical growth driver, relying heavily on specialty resin chemicals—specifically thermal-management potting compounds and structural adhesives—to ensure cell integrity under extreme vibration and thermal cycling. This segment within the Epoxy Resin Market is experiencing double-digit growth rates, particularly in the manufacturing hubs of China and Europe, as battery energy density and safety requirements become more rigorous.


Restraints Impact Analysis

Restraint impact values are directional and represent headwinds to volume and value growth. They do not mechanically subtract from the CAGR but signal areas where procurement risk, regulatory friction, or input-cost volatility could temper Epoxy Resin Market expansion.

Restraint ~% Impact on CAGR Geographic Relevance Impact Timeline
BPA regulatory restrictions –0.40% Europe, North America Short-term (≤2 yr)
Raw-material price volatility (ECH, BPA) –0.35% Global Short-term (≤2 yr)
Trade duties and tariff escalation –0.30% North America, Asia-Pacific Medium-term (2–4 yr)
Competition from alternative resin systems –0.25% Global Long-term (≥4 yr)
Recyclability and end-of-life challenges –0.20% Europe Medium-term (2–4 yr)


BPA Regulatory Restrictions

The European Chemicals Agency's proposed restriction on bisphenol A under REACH Annex XVII could affect more than 60% of current DGBEA resin production destined for food-contact coatings and consumer goods [3]. Reformulation timelines stretch 18–24 months, during which converters face qualification costs of USD 5–15 million per product line. The Epoxy Resin Market must absorb these transitional costs, and producers lacking bio-based alternatives risk losing shelf space to polyester and polyurethane substitutes.

Raw-Material Price Volatility

Epichlorohydrin (ECH) prices swung by more than 35% between Q1 2023 and Q4 2024, driven by tight propylene supply and Chinese capacity shutdowns [7]. Because ECH accounts for roughly 40% of resin production cost, such swings compress margins for mid-tier producers and create pricing uncertainty for procurement teams sourcing thermosetting resin materials on fixed-price contracts.

Trade Duties and Tariff Escalation

Antidumping duties on Chinese epoxy resins imposed by several Asian and European jurisdictions have raised landed costs by 8–15%, reshaping trade flows and encouraging near-shoring of production for adhesive resin compounds and industrial coating resins [16].


Epoxy Resin Market Opportunities

Bio-Based and Recyclable Epoxy Chemistries

Plant-derived epoxy systems using cashew-nut-shell liquid, lignin, or isosorbide are approaching price parity with conventional BPA-based formulations in select applications. With REACH tightening around BPA, producers investing in bio-circular specialty resin chemicals can capture premium pricing in packaging, can coatings, and consumer electronics.

Waterborne Dispersion Technologies

Waterborne epoxy dispersions eliminate nearly all VOC emissions, aligning with U.S. EPA and EU Industrial Emissions Directive thresholds. The Epoxy Resin Market opportunity here is substantial: protective coating chemicals for architectural and marine applications could shift 15–20% of solvent-borne volume to waterborne by 2030.

Emerging-Market Infrastructure Build-Out

India's National Infrastructure Pipeline targets USD 1.4 trillion in investment through 2030, while Southeast Asian nations collectively plan USD 600 billion in transport and urban development [19]. These programs require massive quantities of construction resin products for flooring, structural strengthening, and anti-corrosion coatings—segments currently under-penetrated by epoxy relative to polyurethane.

Composite Hydrogen Storage Vessels

The hydrogen economy is generating a new application frontier for composite resin materials. Type IV pressure vessels—filament-wound with epoxy-impregnated carbon fiber—are essential for 700-bar fuel-cell vehicles and stationary storage. IRENA estimates hydrogen infrastructure investment could exceed USD 700 billion globally by 2035 [20].

Digital Formulation and Data Monetization

AI-driven formulation platforms are transforming resin development, enabling producers to optimize cure schedules, filler loadings, and resin-hardener ratios in silico. While currently facilitating roughly a 20% reduction in development cycles, the efficiency gains are expected to climb toward 30–40% as data quality improves. Companies successfully monetizing these insights through "formulation-as-a-service" models are creating recurring revenue streams that transcend traditional commodity resin sales.


Epoxy Resin Market Future Outlook

Electrification Supercycle

The global shift from combustion to electrified systems—spanning EVs, heat pumps, and grid-scale storage—will expand the addressable market for electrical insulation resins and potting compounds by an estimated 45% through 2035, according to IEA projections [2]. The Epoxy Resin Market stands to benefit as voltage classes rise and thermal-management requirements tighten.

Circular Economy and Sustainability Reporting

ESG disclosure mandates such as the EU Corporate Sustainability Reporting Directive will compel resin consumers to document lifecycle impacts, accelerating adoption of recyclable epoxy and bio-based thermosetting resin materials. Producers that achieve third-party-verified carbon-footprint reductions may command 8–12% price premiums [18].

Autonomous Manufacturing and AI-Driven Formulation

Digital twins and machine-learning-guided cure optimization are reshaping the production of high-performance polymers. Resin manufacturers deploying AI-driven formulation platforms report 20–30% reductions in time-to-qualification for new composite resin materials, translating into faster market entry for specialty grades [21].

Hydrogen and Next-Generation Energy Storage

IRENA projects global green-hydrogen electrolyzer capacity to reach 550 GW by 2035, creating substantial demand for corrosion-resistant laminating resin systems in electrolyzer stack assemblies and Type IV pressure vessels [20]. The Epoxy Resin Market will capture a meaningful share of this emerging application vertical.


Epoxy Resin Market Segmentation

By Raw Material

Segment Metric Primary Demand Driver
DGBEA (Bisphenol A and ECH) 39.5% share (2025) Versatility across coatings, adhesives and electronics
DGBEF (Bisphenol F and ECH) USD 3,480 million (2025) Chemical-resistance applications
Novolac (Formaldehyde and Phenols) 4.52% CAGR High-temperature electrical insulation resins
Aliphatic (Aliphatic Alcohols) USD 1,740 million (2025) UV-stable protective coating chemicals
Glycidylamine (Aromatic Amines and ECH) 4.85% CAGR Aerospace composite resin materials
Others (Bio-based, Cycloaliphatic) 7.18% CAGR Regulatory-driven BPA-free reformulation


DGBEA resins dominate the Epoxy Resin Market because of their balance between cost efficiency and mechanical performance. Produced from bisphenol A and epichlorohydrin, these thermosetting resin materials serve as the backbone for industrial coating resins, structural adhesive resin compounds, and printed-circuit-board laminates. Their widespread availability through established global supply chains reinforces market incumbency, though regulatory scrutiny around BPA is gradually channeling R&D investment toward bisphenol-F and bio-based alternatives.

Bio-based and cycloaliphatic grades occupy a small but rapidly growing niche within the Epoxy Resin Market, expanding at a 7.18% CAGR. Derived from renewable feedstocks such as plant oils, cardanol, and isosorbide, these specialty resin chemicals appeal to brand-conscious end users in packaging and consumer electronics seeking lower environmental footprints. Performance gaps relative to conventional DGBEA formulations are narrowing as catalysis innovations improve crosslink density and glass-transition temperatures.

By Application

Segment Metric Primary Demand Driver
Paints and Coatings 54.2% share (2025) Infrastructure maintenance and marine protection
Adhesives and Sealants USD 5,220 million (2025) Automotive and electronics assembly
Composites 5.95% CAGR Wind energy and aerospace lightweighting
Electrical and Electronics USD 4,870 million (2025) Semiconductor molding and PCB lamination
Others 3.48% CAGR Tooling, casting, art/craft applications


Paints and coatings remain the largest application category in the Epoxy Resin Market, consuming protective coating chemicals and industrial coating resins used for bridge-deck overlays, tank linings, and marine anti-corrosion systems. The shift toward waterborne epoxy dispersions is reshaping this segment, as tightening VOC thresholds in the EU and North America incentivize formulators to replace solvent-borne systems.

Composites represent the fastest-growing application, propelled by wind-turbine blade manufacturing and automotive body-panel lightweighting. Each offshore wind turbine requires 15–20 tons of laminating resin systems for blade infusion, making renewable-energy infrastructure a structural demand driver for high-performance polymers in the composites space.

By Physical Form

Segment Metric Primary Demand Driver
Liquid 61.8% share (2025) Coating, casting, and laminating applications
Solid USD 7,830 million (2025) Powder coatings and molding compounds
Solution 3.75% CAGR Electrical insulation resins and varnishes
Waterborne Dispersion 6.52% CAGR Low-VOC regulatory compliance


Liquid epoxy resins command the largest share because most coating, flooring, and laminating processes require flowable thermosetting resin materials that can be applied by spray, brush, or infusion. Waterborne dispersions, though still a modest fraction by volume, are the fastest-growing physical form in the Epoxy Resin Market, driven by environmental regulations that penalize high-VOC formulations of protective coating chemicals.


Regional Market Share Analysis

Region Metric Primary Investment Themes
Asia-Pacific 43.8% share (2025) Infrastructure, electronics, wind energy
Europe USD 8,074 million (2025) Automotive lightweighting, green regulations
North America 22.5% share (2025) Semiconductor fabs, highway rehabilitation
South America 3.95% CAGR (2026–2035) Oil & gas coatings, construction
Middle East & Africa USD 1,636 million (2025) Desalination, petrochemical infrastructure
Total USD 34,800 million (2025)

The Epoxy Resin Market exhibits a pronounced geographic tilt toward Asia-Pacific, where construction activity, electronics manufacturing, and wind-energy deployment collectively absorb nearly half of global resin output. North America and Europe follow, each anchored by distinct demand pillars—semiconductor packaging and automotive composites, respectively—while South America and the Middle East & Africa represent high-growth, low-base opportunities for industrial coating resins and construction resin products [4][5].


North America

Country Metric Key Driver
United States 78.4% of regional share Semiconductor packaging and bridge-deck coatings
Canada 4.15% CAGR Oil-sands pipeline protective coating chemicals
Mexico USD 685 million (2025) Automotive OEM assembly expansion


The U.S. dominates North America's Epoxy Resin Market share through a combination of CHIPS Act–funded fab construction, Department of Transportation bridge-repair mandates, and robust wind-energy procurement along the Gulf Coast. Canada's oil-and-gas sector drives steady demand for adhesive resin compounds and high-temperature novolac coatings in pipeline maintenance. At the same time, Mexico benefits from the nearshoring of automotive production that consumes electrical insulation resins and composite resin materials.

Europe

Country Metric Key Driver
Germany 24.8% of regional share Automotive composites and wind blades
United Kingdom 3.92% CAGR Offshore wind and marine coatings
France USD 1,120 million (2025) Nuclear and aerospace adhesive compounds
Italy 3.65% CAGR Architectural protective coating chemicals
Spain USD 580 million (2025) Onshore wind installations
Nordic Countries 4.28% CAGR Green-building construction resin products
Russia USD 410 million (2025) Oil & gas pipeline coatings
Rest of Europe 11.5% of regional share Mixed industrial applications


Germany anchors European demand through its automotive OEMs' aggressive adoption of carbon-fiber-reinforced epoxy body panels and its leadership in onshore and offshore wind capacity. The EU's Renovation Wave strategy targets renovation of 35 million buildings by 2030, which will accelerate consumption of thermosetting resin materials for structural strengthening and flooring systems across the continent.

Asia-Pacific

Country Metric Key Driver
China 52.6% of regional share Electronics, construction, wind energy
India 6.78% CAGR Infrastructure pipeline and power-grid expansion
Japan USD 2,140 million (2025) Semiconductor molding compounds
South Korea 4.45% CAGR Display and battery adhesive resin compounds
ASEAN USD 1,350 million (2025) Industrial coatings and marine applications
Rest of Asia-Pacific 3.88% CAGR Emerging manufacturing hubs


China's position as the world's largest producer and consumer of epoxy resins stems from its dominant roles in electronics assembly, infrastructure construction, and renewable-energy manufacturing. India represents the fastest-growing country opportunity within the Epoxy Resin Market, powered by the National Infrastructure Pipeline and rapid urbanization that drives demand for specialty resin chemicals in commercial flooring, water-tank linings, and high-voltage electrical insulation resins.

South America

Country Metric Key Driver
Brazil 62.3% of regional share Oil & gas coatings, civil construction
Argentina 3.72% CAGR Wind-farm composite resin materials
Rest of South America USD 305 million (2025) Mining and industrial maintenance


Brazil's pre-salt offshore oil production requires extensive use of industrial coating resins for subsea pipelines and platform structures. At the same time, its civil-construction sector consumes growing volumes of self-leveling epoxy flooring and rebar coatings for urban transit projects.

Middle East & Africa

Country Metric Key Driver
Saudi Arabia 31.5% of regional share Vision 2030 mega-projects
UAE 4.55% CAGR Smart-city construction resin products
South Africa USD 180 million (2025) Mining and power infrastructure
Egypt 4.10% CAGR New Administrative Capital construction
Rest of MEA 26.8% of regional share Desalination and petrochemical maintenance


Saudi Arabia's Vision 2030 program is channeling hundreds of billions of dollars into non-oil infrastructure, including NEOM, the Red Sea Project, and Riyadh Metro, all of which specify protective coating chemicals and laminating resin systems for corrosion control in extreme-heat environments.


Epoxy Resin Market By Region, 2025-2035

Competitive Benchmarking

The epoxy resin market is highly concentrated, with the Herfindahl-Hirschman Index estimated to be below 1,200 and the top five players accounting for about 42–48% of the total global sales. The competitive landscape has changed with M&A consolidation, such as Westlake Chemical’s purchase of Hexion’s epoxy business, but there is a long tail of regional specialists in adhesive resin compounds and specialty resin chemicals that keeps fragmentation [22].

Company Est. Revenue Share Range Key Offerings for Epoxy Resin Market Strategic Positioning
Hexion Inc. ~8–11% EPON and EPIKURE systems for coatings, composites Broad portfolio leader in thermosetting resin materials
Huntsman Corporation ~7–10% Araldite brand, advanced composite and aerospace resins High-performance laminating resin systems specialist
Olin Corporation ~6–9% D.E.R. and D.E.N. liquid and solid resins Cost-competitive integrated producer
Nan Ya Plastics Corporation ~5–8% NPEL liquid resins for PCB and coatings Asia-Pacific electronics supply chain anchor
Kukdo Chemical Co., Ltd. ~4–7% YD and KR series for industrial coating resins Korean market leader with China expansion
BASF SE ~3–6% Specialty curing agents and modifiers Downstream formulation integration
Aditya Birla Chemicals ~3–5% Epotec range for construction resin products Emerging-market cost advantage
Chang Chun Group ~3–5% BE and BEF series for electronics encapsulation Taiwan-based vertical integration
Spolchemie a.s. ~2–4% CHS-EPOXY systems for European coatings Regional niche in Central Europe
Sicomin Epoxy Systems ~1–3% GreenPoxy bio-based formulations Sustainability-first positioning


Recent News & Developments


  • European Chemicals Agency (June 2024): Published a draft restriction proposal for BPA in thermal paper and coatings, signaling broader regulatory action that will reshape the Epoxy Resin Market's raw-material mix [3].


  • Sicomin Epoxy Systems (November 2023): Received USDA BioPreferred certification for its GreenPoxy 56 resin, achieving 56% bio-based carbon content for composite resin materials [24].


Epoxy Resin Market Report Scope

Parameter Detail
Market Scope Global Epoxy Resin Market covering raw-material types, applications, physical forms, and five geographic regions
Study Period 2021–2035
CAGR (Forecast) 3.82% (2026–2035)
Market Size — Base Year (2025) USD 34,800 million
Market Size — Forecast Endpoint (2035) USD 50,633 million
Fastest Growing Segment (Application) Composites (5.95% CAGR)
Fastest Growing Region Asia-Pacific (6.55% CAGR)
Companies Profiled 10 (Hexion, Huntsman, Olin, Nan Ya Plastics, Kukdo Chemical, BASF, Aditya Birla Chemicals, Chang Chun Group, Spolchemie, Sicomin)
Valuation Currency USD million


FAQs

What is the typical shelf life of industrial-grade epoxy resins, and how does storage affect procurement planning?

Most unfilled liquid epoxy resins remain stable for 18–24 months when stored between 15–25 °C in sealed containers [8]. Procurement teams should factor seasonal temperature fluctuations into safety-stock calculations.

How do waterborne epoxy systems compare to solvent-borne formulations in corrosion-protection performance?

Waterborne systems achieve 85–90% of the salt-spray resistance of solvent-borne counterparts while cutting VOC emissions by over 80% [3]. Performance gaps continue narrowing as dispersion technology matures.

What qualification hurdles do new entrants face when supplying epoxy molding compounds to semiconductor fabs?

Fab qualification cycles typically run 12–18 months, requiring ionic-purity levels below 10 ppm and moisture-absorption rates under 0.15% [12]. Capital-intensive testing creates high barriers for newcomers.

How are recycling mandates in Europe affecting end-of-life management for epoxy-based composites?

The EU Waste Framework Directive's 2025 revisions require producers to demonstrate recyclability pathways for thermoset composites [18]. Pyrolysis and solvolysis routes are emerging but remain pre-commercial at scale.

Which curing-agent chemistry is gaining the most traction for Epoxy Resin Market applications in EV batteries?

Anhydride-based curing agents are preferred for battery-potting compounds due to their low exotherm and excellent electrical insulation properties [14]. Amine-cured alternatives serve structural bonding roles.

How sensitive is the Epoxy Resin Market to crude oil price swings, given its petrochemical feedstock base?

ECH and BPA—both petroleum-derived—represent roughly 55–65% of resin production costs [7]. A sustained USD 20/barrel crude-price shift can move resin margins by 4–6 percentage points.

What role do digital twins play in optimizing cure cycles for composite resin materials in aerospace manufacturing?

Digital twins simulate thermal profiles and degree-of-cure gradients, reducing autoclave cycle times by 15–25% [21]. Aerospace OEMs increasingly mandate digital-twin validation before part certification.


Author
Author
Author Profile
Chitranshi Jaiswal LinkedIn
Team Lead - Research
Chitranshi is a Team Leader in the Chemicals & Materials (CnM) and Energy & Power (EnP) domains, with 6+ years of experience in market research. She leads and mentors teams to deliver cross-domain projects that equip clients with actionable insights and growth strategies. She is skilled in market estimation, forecasting, competitive benchmarking, and both primary & secondary research, enabling her to turn complex data into decision-ready insights. An engineer and MBA professional, she combines technical expertise with strategic acumen to solve dynamic market challenges. Chitranshi has successfully managed projects that support market entry, investment planning, and competitive positioning, while building strong client relationships. Certified in Advanced Excel & Power BI she leverages data-driven approaches to ensure accuracy, clarity, and impactful outcomes.

Research Approach


Secondary Research

The secondary research process involved comprehensive analysis of regulatory databases, peer-reviewed engineering journals, technical publications, and authoritative industry organizations. Key sources included:

Regulatory & Standards Bodies:

US Federal Communications Commission (FCC) – Equipment Authorization Database for radar device certifications

European Telecommunications Standards Institute (ETSI) – EN 302 858 standards for automotive radar

US Department of Transportation (DOT) – National Highway Traffic Safety Administration (NHTSA) vehicle safety regulations

European Union Aviation Safety Agency (EASA) – radar equipment certification for aerospace applications

US Federal Aviation Administration (FAA) – radar systems for air traffic control and weather monitoring

International Telecommunication Union (ITU) – Radio Regulations for radar frequency allocations

Government & Defense Sources:

US Department of Defense (DoD) – Defense Advanced Research Projects Agency (DARPA) radar technology programs

European Defence Agency (EDA) – military radar capability development reports

US National Oceanic and Atmospheric Administration (NOAA) – Next-Generation Radar (NEXRAD) data

NATO Standardization Office (NSO) – radar system interoperability standards

Japan Ministry of Internal Affairs and Communications (MIC) – radio equipment regulations

China Ministry of Industry and Information Technology (MIIT) – radar equipment type approval database

Industry & Technical Organizations:

Institute of Electrical and Electronics Engineers (IEEE) – Aerospace & Electronic Systems Society

International Society for Optics and Photonics (SPIE) – radar sensor technologies publications

Society of Automotive Engineers (SAE) – J2945 standards for vehicular radar systems

Automotive Research Association (ARA) – intelligent transportation systems research

European Radar Conference (EuRAD) – technical proceedings and industry trends

International Radar Symposium (IRS) – global radar technology developments

Market Intelligence Sources:

Semiconductor Industry Association (SIA) – sensor component shipment data

Global Semiconductor Alliance (GSA) – radar chipset market analysis

Automotive Electronics Council (AEC) – component qualification standards

These sources served to gather frequency allocation data, regulatory approval statistics, safety certification requirements, technology roadmaps, and market landscape analysis for continuous wave (CW) radar, frequency-modulated continuous wave (FMCW) radar, pulsed radar, and millimeter-wave radar technologies in the automotive, aerospace & defense, industrial automation, security & surveillance, and weather monitoring industry.


Primary Research

In the primary research process, stakeholders from both the supply and demand sides were interviewed to acquire both qualitative and quantitative insights. The supply-side sources comprised CEOs, VPs of Engineering, radar system architects, regulatory compliance leaders, and commercial directors from radar sensor manufacturers, semiconductor foundries, and RF component suppliers. Automotive OEM electronics procurement heads, aerospace & defense system integrators, industrial automation engineers, smart city project managers, and security system integrators from transportation authorities, defense contractors, manufacturing facilities, and critical infrastructure operators comprised our demand-side sources. Through primary research, market segmentation was verified, product development timelines were confirmed, and insights regarding technology adoption patterns, pricing strategies, and regulatory compliance dynamics were obtained.

Primary Respondent Breakdown:

By Designation: C-level Primaries (32%), Director Level (30%), Others (38%)

By Region: North America (32%), Europe (30%), Asia-Pacific (28%), Rest of World (10%)


Market Size Estimation

Global market valuation was derived through revenue mapping and unit shipment analysis. The methodology included:

Identification of 50+ key manufacturers across North America, Europe, Asia-Pacific, and Latin America

Product mapping across radar detectors, radar scrambling devices, antennas, transmitters, receivers, and processing units

Analysis of reported and modeled annual revenues specific to radar sensor portfolios

Coverage of manufacturers representing 72-78% of global market share in 2024

Extrapolation using bottom-up (unit shipment × ASP by application) and top-down (manufacturer revenue validation) approaches to derive segment-specific valuations for automotive ADAS, traffic monitoring, aerospace & defense, industrial IoT, security & surveillance, and weather monitoring segments

Download Free Sample

Kindly complete the form below to receive a free sample of this Report

Download PDF ×

We do not share your information with anyone. However, we may send you emails based on your report interest from time to time. You may contact us at any time to opt-out.