Segmentation Quick Reference
| Dimension | Sub-Segments | Dominant Segment | Fastest Growing Segment |
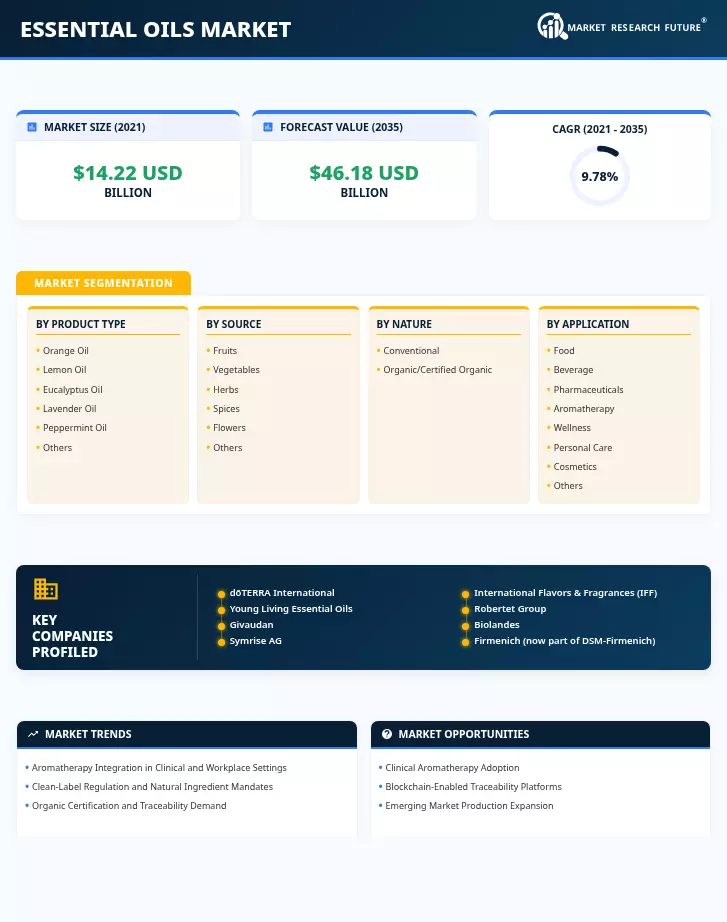
| Product Type | Orange Oil, Lemon Oil, Eucalyptus Oil, Lavender Oil, Peppermint Oil, Others | Orange Oil | Eucalyptus Oil |
| Source | Fruits and Vegetables, Herbs and Spices, Flowers, Others | Fruits and Vegetables | Herbs and Spices |
| Nature | Conventional, Organic/Certified Organic | Conventional | Organic/Certified Organic |
| Application | Food and Beverage, Essential Oils Markets, Aromatherapy and Wellness, Personal Care and Cosmetics, Others | Food and Beverage | Aromatherapy and Wellness |
| Geography | North America, Europe, Asia-Pacific, South America, Middle East & Africa | Europe | Asia-Pacific |
Market Segmentation Overview
By Product Type
| Sub-Segment | Key Trend |
| Orange Oil | Sustained demand from beverage flavoring and eco-friendly household cleaning formulations |
| Lemon Oil | Growing use in cosmetics preservation and food-grade antimicrobial coatings |
| Eucalyptus Oil | Post-pandemic respiratory wellness awareness is driving pharmaceutical and aromatherapy uptake. |
| Lavender Oil | Clinical aromatherapy validation expanding hospital and spa procurement channels |
| Peppermint Oil | Oral care innovation and therapeutic headache relief applications |
| Others | Diversification into tea tree, rosemary, and frankincense for specialized wellness products |
Orange oil continues to lead the Essential Oils Market by product type, driven by scale economics in citrus processing and broad applicability across food, beverage, and home care categories. Eucalyptus oil is emerging as the fastest-growing product segment, benefiting from heightened consumer focus on respiratory health and expanding pharmaceutical formulation pipelines.
By Source
| Sub-Segment | Key Trend |
| Fruits and Vegetables | Industrial-scale citrus peel processing in Brazil and the United States |
| Herbs and Spices | Rapid expansion of mint, basil, and oregano cultivation for therapeutic applications |
| Flowers | Premium positioning of rose, jasmine, and lavender oils in luxury fragrance and cosmetics |
| Others | Niche growth in sandalwood, cedarwood, and vetiver from sustainable forestry programs |
Fruits and vegetables remain the dominant source category, anchored by orange and lemon oil production infrastructure. Herbs and spices represent the highest-growth source, with cold-pressed essential oil extraction and steam distillation methods optimized for volatile compound preservation.
By Nature
| Sub-Segment | Key Trend |
| Conventional | Cost-competitive processing for food-grade and industrial applications |
| Organic/Certified Organic | Retailer mandates and consumer premiums are driving organic essential oil certification adoption. |
Conventional essential oils dominate current volumes, but organic variants are capturing disproportionate growth as retailers and brands commit to certified supply chains. Organic essential oil certification standards from USDA, EU Organic, and COSMOS are becoming prerequisites for premium shelf placement.
By Application
| Sub-Segment | Key Trend |
| Food and Beverage | Natural flavoring mandates replacing synthetic additives globally |
| Essential Oils Markets | Antimicrobial and anti-inflammatory compound research is accelerating clinical adoption. |
| Aromatherapy and Wellness | Hospital, workplace, and home diffuser programs are expanding rapidly. |
| Personal Care and Cosmetics | Clean beauty movement redirecting formulation budgets toward botanical ingredients |
| Others | Emerging use in animal care, agriculture, pest management, and air purification |
Food and beverage remains the largest application category, while aromatherapy and wellness are the fastest-growing, fueled by clinical validation of therapeutic-grade essential oils and broadening adoption of aromatherapy diffuser blend protocols in healthcare and corporate settings.