Europe Silica Sand Market Segmentation
Europe Silica Sand Market By Mesh Size (USD Billion, 2025-2035)
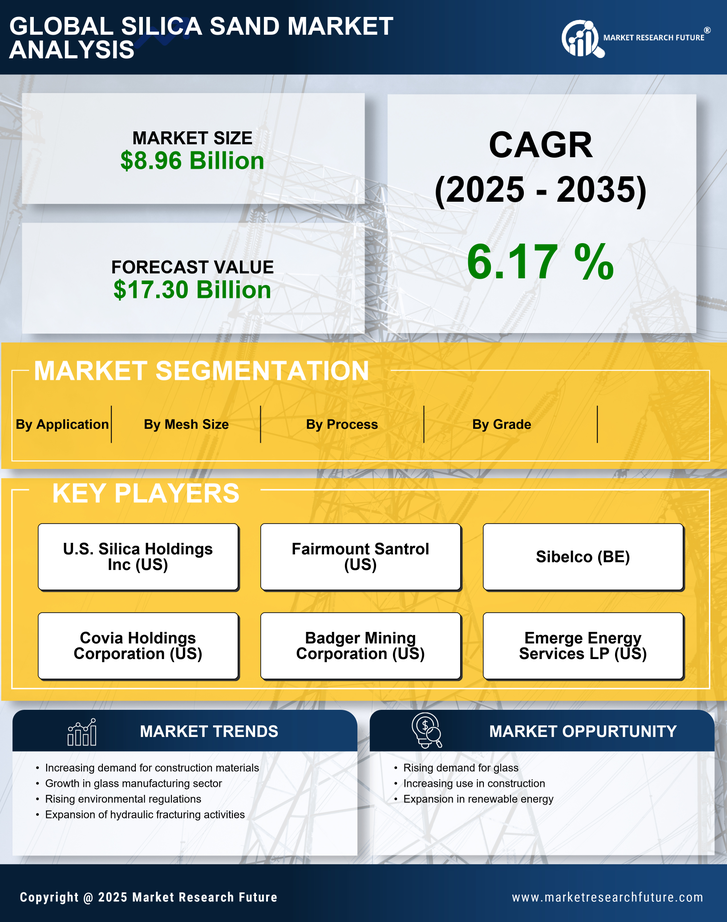
- < 70 mesh
- 70-120 mesh
- 120-200 mesh
- >200 mesh
Europe Silica Sand Market By Grade (USD Billion, 2025-2035)
- glass
- foundry
- chemical
Europe Silica Sand Market By Process (USD Billion, 2025-2035)
- wet silica sand
- dry silica sand
Europe Silica Sand Market By Application (USD Billion, 2025-2035)
- glass
- hydraulic fracturing
- foundry
- construction
- chemicals
- water filtration
- paints & coatings
- ceramics
- others