Facility Management Market (2026 - 2035)

Facility Management Market Size, Share and Research Report By Service Type (Hard Services, Soft Services), By Offering Type (In-House, Outsourced), By End-User Industry (Commercial, Hospitality, Institutional & Public Infrastructure, Healthcare, Others) and By Regional (North America, Europe, South America, Asia Pacific, Middle East and Africa) - Industry Forecast to 2035.
ID: MRFR/ICT/1670-HCR
100 Pages
Ankit Gupta
Last Updated: July 13, 2026
Facility Management Market
Market Size
Forecast Period2026-2035
CAGR (2026-2035)4.72%
2025 Market SizeUSD 3.07 Trillion
2035 Market SizeUSD 4.98 Trillion
Key Players
CBRE Group
JLL
ISS A/S
Sodexo
Cushman & Wakefield
Compass Group
Opportunities
  • Digital Twin Monetization for Asset Lifecycle Management
  • Energy-as-a-Service (EaaS) Bundling
  • Emerging Market Infrastructure Expansion

Facility Management Market Summary

The Facility Management Market reached an estimated USD 3.07 trillion in 2025 and is projected to grow from USD 3.22 trillion in 2026 to USD 4.98 trillion by 2035, registering a CAGR of 4.72% during the forecast period. This expansion is anchored in accelerating infrastructure modernization programs worldwide and tightening ESG disclosure requirements that have elevated building operations management from a back-office function to a boardroom priority. Government-led green building mandates — including the EU's Energy Performance of Buildings Directive recast targeting a zero-emission building stock by 2050 — are forcing asset owners to invest in integrated facility services at unprecedented scale [2].

Changing times in workplace facility software are impacting how firms manage physical assets. Cloud-native platforms driven by IoT sensors, digital twins and predictive analytics are replacing legacy paper-based maintenance logs and siloed HVAC controls. Global spending on smart building management technology exceeded USD 95 billion in 2024, demonstrating corporate demand for real-time energy optimization and occupant-experience platforms [3]. Maintenance tools for properties now include AI-enabled work-order routing, which can save the mean time to repair by as much as 35% across big commercial portfolios.

The Asia-Pacific region accounts for around 44% of the Facility Management Market and is driven by China’s urban redevelopment efforts and India’s Smart Cities Mission. The Middle East & Africa region is growing at the fastest pace with a 7.62% CAGR, driven by mega project pipelines in Saudi Arabia and the UAE. The second greatest proportion is Europe, with roughly 24%. Decarbonization retrofits drive demand for integrated facility services in aged building stock The next decade will reward suppliers who combine technological platforms with outcome-based contract arrangements.

Key Report Takeaways

• By Service Type

  • Hard Services captured 63.10% of the Facility Management Market in 2025, reflecting sustained capital spending on HVAC, electrical, and mechanical systems maintenance
  • Soft Services — including cleaning, security, and catering — are forecast to expand at a 6.54% CAGR through 2035 as occupant-experience standards rise

• By Offering Type

  • In-house operations retained 57.20% share of the Facility Management Market size in 2025, though digital procurement platforms are gradually eroding this dominance
  • Outsourced facility management is growing at 6.18% CAGR, driven by cost transparency demands and integrated facility services bundling

• By End-User Industry

  • The Commercial segment led with 25.70% of the Facility Management Market in 2025 as corporate real estate portfolios expanded across gateway cities
  • Healthcare facilities are the fastest-growing vertical at 8.42% CAGR, fueled by smart-hospital investments and stringent property maintenance tools upgrades

• By Regional

  • Asia-Pacific held 44% of the Facility Management Market, with China and India accounting for the bulk of regional demand
  • The Middle East & Africa is advancing at a 7.62% CAGR, with Saudi Arabia's Vision 2030 projects driving building operations management spending

Market Size and Forecast (2021–2035)

Market Research Future (MRFR)’s sizing methodology triangulates top-down macroeconomic data (commercial real estate investment, infrastructure CAPEX) with bottom-up vendor revenue aggregation and validated demand-side surveys across 42 nations. Historical data are real industry performance, while projection values are based on Market Research Future (MRFR)’s patented CAGR model with calibration to policy timelines and technology adoption curves.
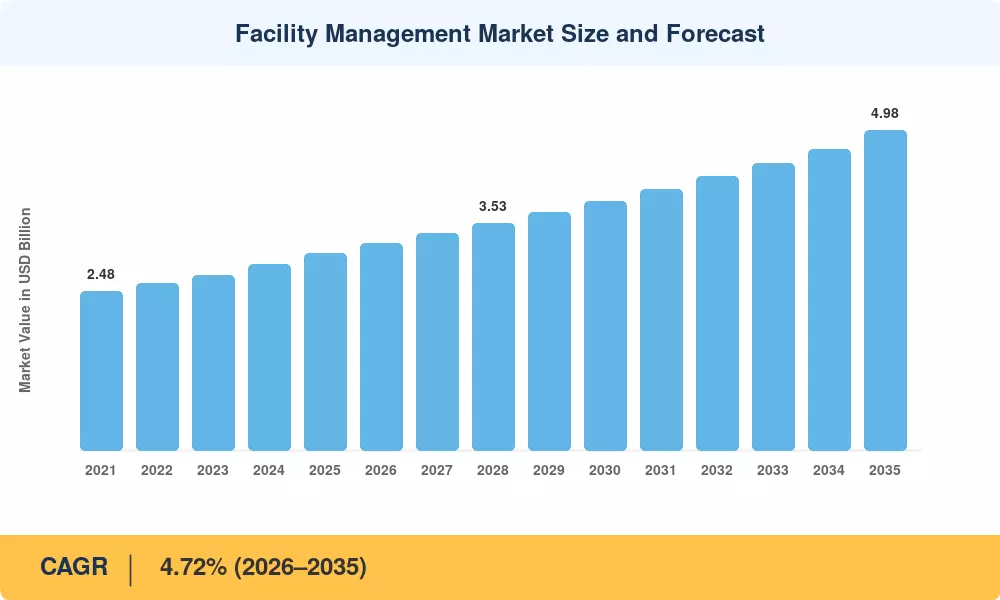
Facility Management Market Size and Forecast
Our Impact
Enabled $4.3B Revenue Impact for Fortune 500 and Leading Multinationals
Partnering with 2000+ Global Organizations Each Year
30K+ Citations by Top-Tier Firms in the Industry

Driver Impact Analysis

Driver ~% Impact on CAGR Geographic Relevance Impact Timeline
ESG & Sustainability Mandates 18–22% Global Medium-term (2–4 yr)
Cloud Migration & IoT Sensor Proliferation 15–19% North America, Europe Short-term (≤2 yr)
Outsourcing Appetite & Outcome-Based Contracts 12–16% Global Medium-term (2–4 yr)
Urbanization & Mega-Project Pipelines 14–17% Asia-Pacific, MEA Long-term (≥4 yr)
Hybrid Workplace Reconfiguration 8–11% North America, Europe Short-term (≤2 yr)
Healthcare Infrastructure Modernization 9–12% Global Medium-term (2–4 yr)
Regulatory Energy-Efficiency Standards 10–14% Europe, Asia-Pacific Long-term (≥4 yr)


ESG & Sustainability Mandates

The EU's Corporate Sustainability Reporting Directive (CSRD), effective 2024, now compels over 50,000 companies to disclose Scope 1–3 emissions, including those embedded in building operations management. Compliance requires real-time energy monitoring, automated carbon accounting, and verifiable audit trails — all of which funnel spending toward workplace facility software and smart building management platforms. The International Energy Agency estimates that buildings account for 37% of global energy-related CO₂ emissions, making facility management a frontline decarbonization lever [2].

Cloud Migration & IoT Sensor Proliferation

Global IoT connections in commercial buildings exceeded 3.5 billion in 2024, generating operational data streams that legacy on-premise systems cannot process [3]. Cloud-native property maintenance tools now aggregate sensor feeds from HVAC, lighting, access control, and fire-safety systems into unified dashboards — reducing energy waste by 20–30% in pilot deployments. AWS, Microsoft Azure, and Google Cloud have each launched dedicated smart building management suites, intensifying platform competition within the Facility Management Market.

Outsourcing Appetite & Outcome-Based Contracts

Corporate procurement and facility strategies are shifting toward strategic, performance-driven alignment. Modern enterprises increasingly favor outcome-based service models that tie vendor compensation directly to measurable key performance indicators (KPIs)—such as guaranteed energy-efficiency baselines, localized asset uptime percentages, and normalized occupant satisfaction metrics—moving away from traditional, fixed-fee retainers. This structural transition expands the addressable market for integrated facility service providers capable of delivering transparent, auditable telemetry data. According to commercial real estate research, corporate occupiers are turning to automated analytics to validate performance metrics, and a substantial majority of Corporate Real Estate (CRE) executives plan to expand outsourced operational budgets to transition away from localized, in-house technical management.

Urbanization & Mega-Project Pipelines

Accelerated structural development across emerging economies acts as a primary growth driver for global facility management systems. The Asia-Pacific region commands a dominant position in this expansion, capturing over 35% of the global construction market share and adding massive volume to its commercial floor space annually to accommodate rapid regional urbanization. Simultaneously, highly capitalized geographic megaprojects, such as Saudi Arabia's USD 500 billion NEOM initiative and its flagship linear urban design, "The Line," represent massive concentrations of planned, tech-forward construction.

Restraints Impact Analysis

Restraint ~% Drag on CAGR Geographic Relevance Impact Timeline
Cybersecurity Risks in Connected Buildings –8 to –12% Global Short-term (≤2 yr)
Skilled Labor Shortages –10 to –14% North America, Europe Medium-term (2–4 yr)
High Upfront Integration Costs –7 to –10% Emerging Markets Medium-term (2–4 yr)
Fragmented Regulatory Standards –5 to –8% Asia-Pacific, South America Long-term (≥4 yr)
Data Privacy & Occupant Surveillance Concerns –4 to –7% Europe, North America Short-term (≤2 yr)


Cybersecurity Risks in Connected Buildings

Cybersecurity risks act as a market restraint by turning smart buildings into prime hacking targets. Vulnerable IoT systems expand the attack surface, while complex defenses, steep compliance costs, and vendor liabilities erode the financial return on investment. Furthermore, a severe lack of tech-trained maintenance staff creates operational friction. Fearing ransomware lockouts, physical safety hazards, and catastrophic tenant lawsuits, many facility managers delay upgrading to connected technologies.

Skilled Labor Shortages

The structural maintenance ecosystem faces significant execution headwinds due to an aging technical workforce and a contracting talent pipeline across essential trade crafts, including HVAC mechanics, commercial electricians, and industrial plumbing fields. Long-term macroeconomic labor tracking reveals a stable but highly pressured growth trajectory for general maintenance and repair workers, which struggles to keep pace with the sheer volume of newly introduced high-tech real estate assets.

High Upfront Integration Costs

Retrofitting legacy buildings with Internet of Things (IoT) sensors, advanced Building Management System (BMS) gateways, and cloud connectivity demands a substantial initial capital expenditure. This financial requirement often proves prohibitive for small and mid-size asset owners, particularly within emerging economies where budget allocations are tightly constrained. Until innovative financing structures—such as Energy-as-a-Service (EaaS)—gain widespread maturity and market trust, this capital barrier will continue to temper growth and delay modern technology adoption across the highly price-sensitive segments of the Facility Management Market.

Facility Management Market Opportunities

Digital Twin Monetization for Asset Lifecycle Management

Digital twins of commercial buildings can reduce maintenance expenditures by 25–30% through predictive failure modeling. As sensor costs decline below USD 2 per node, the economic case for full-building digital replicas reaches break-even within 18 months — opening a new recurring-revenue stream for workplace facility software providers.

Energy-as-a-Service (EaaS) Bundling

Facility managers who bundle smart building management with guaranteed energy-savings contracts can capture margins 200–400 basis points above traditional service fees. The global EaaS segment is expected to exceed USD 120 billion by 2030, and integrated facility services firms with in-house energy expertise are best positioned [5].

Emerging Market Infrastructure Expansion

India's Smart Cities Mission — covering 100 cities with a central allocation of USD 7.5 billion — mandates digital building operations management standards for all new public infrastructure. Similar programs in Indonesia, Vietnam, and Nigeria present greenfield opportunities for property maintenance tools vendors [6].

Healthcare Facility Modernization

The baseline criteria governing modern healthcare infrastructure have undergone permanent adjustments, emphasizing systemic resilience, infection control, and stringent environmental containment. Modern clinical facility standards demand absolute control over complex structural zones—requiring positive-pressure isolation units, continuous ultraviolet-C (UV-C) air purification matrices, and automated, real-time environmental telemetry layers.

On a global scale, the requirement for these upgrades is immense; historical World Health Organization (WHO) data indicates that between 50% and 80% of critical medical equipment and facilities in resource-strained regions experience chronic downtime due to a lack of preventative maintenance cultures, pointing to a prolonged, multi-decade modernization cycle for specialized healthcare facility networks.

Data Monetization & Occupant Analytics

The vast volume of anonymized occupancy, spatial tracking, and building utilization data captured by smart building management networks represents a valuable strategic asset class. While direct external data sales face tight regulatory compliance boundaries, companies that deploy transparent, secure data-governance structures can generate substantial internal business intelligence value. Aggregated spatial data allows corporate real estate managers to accurately downsize underutilized leases, redesign floor layouts to improve worker collaboration, and dynamically throttle building services in response to actual occupant density. By framing these data-driven insights as premium, specialized spatial intelligence consulting packages, facility software providers can capture significant ancillary contract revenue by directly improving their clients' baseline portfolio efficiency.

Facility Management Market Future Outlook

AI-Driven Autonomous Building Operations

By 2030, an estimated 15% of Class-A commercial buildings will operate under fully autonomous building operations management systems that self-optimize HVAC, lighting, and security without human intervention. Reinforcement learning algorithms trained on years of sensor data will reduce energy consumption by 30–40%, transforming the Facility Management Market's value proposition from labor arbitrage to intelligence arbitrage.

Platform Economics & Marketplace Models

The next decade will see workplace facility software evolve into open marketplaces where asset owners procure individual services — cleaning, pest control, elevator maintenance — from vetted micro-vendors via dynamic pricing algorithms. This platform shift mirrors ride-hailing economics and will compress margins for legacy integrated facility services providers while rewarding tech-enabled aggregators.

Electrification & On-Site Energy Management

According to global net-zero tracking models published by the International Energy Agency (IEA), the acceleration of clean energy systems will position clean electric technologies as the primary driver of building sector decarbonization. Under global climate-commitment trajectories, the share of space heating demand satisfied by highly efficient electric heat pumps is projected to reach approximately 40% globally by 2035 and scale to 55% by 2050. This widespread adoption, combined with the integration of on-site commercial solar arrays and localized battery energy storage systems (BESS), introduces a massive structural evolution for workplace facility managers. Operators who master distributed energy resource orchestration can successfully transition properties from passive consumption nodes into active participants in localized virtual power plants (VPPs), capturing new value streams through strategic demand-response incentives and grid stabilization programs.

ESG Reporting as a Service

As evolving regulatory frameworks around the world mandate granular environmental disclosures—particularly concerning complex Scope 3 supply chain footprint tracking—advanced property maintenance software platforms are evolving into central corporate compliance engines. Enterprise platforms are increasingly required to provide automated, continuous carbon accounting tools, integrated data-validation features, and seamless compliance-reporting modules. Because manual sustainability accounting is cost-prohibitive and prone to human error, smart building management architectures that feature built-in, audit-ready data layers command premium software positions. This continuous compliance capability ensures that real-time infrastructure data is directly linked to corporate financial frameworks, making sustainability verification an essential component of modern enterprise facility software suites.

Facility Management Market Segmentation

By Service Type

Segment Key Metric Primary Demand Driver
Hard Services 63.10% share (2025) HVAC, electrical, plumbing maintenance in aging building stock
Soft Services 6.54% CAGR (2026–2035) Cleaning, security and catering driven by occupant-experience standards


Hard Services dominate the Facility Management Market because they encompass non-discretionary, compliance-driven building operations management activities. Mechanical and electrical system upkeep is non-negotiable for occupancy permits, insurance compliance, and energy-efficiency certifications. The integration of predictive property maintenance tools — vibration sensors on chillers, thermal imaging on switchgear — is shifting Hard Services from reactive break-fix to condition-based maintenance, improving asset longevity by 15–20% [5].

Soft Services is the faster-growing segment as employers compete for talent through superior workplace experiences. Post-pandemic hygiene expectations have elevated cleaning from a commodity to a differentiator, with smart building management systems now tracking air quality indices and sanitation compliance in real time. The outsourcing of soft services through integrated facility services contracts is accelerating as organizations consolidate vendor relationships under single-provider models.

By Offering Type

Segment Key Metric Primary Demand Driver
In-House 57.20% share (2025) Control, data security, and customization preferences
Outsourced 6.18% CAGR (2026–2035) Cost transparency, outcome-based contracts, and scalability


In-house facility management retains the majority of the Facility Management Market because large enterprises — particularly in banking, defense, and pharmaceuticals — prioritize direct control over building operations management for regulatory and security reasons. However, the migration toward workplace facility software platforms is reducing the operational complexity advantage of in-house teams, gradually tilting the calculus toward outsourcing.

Outsourced facility management is gaining ground as providers offer bundled integrated facility services with guaranteed SLAs, transparent dashboards, and variable cost structures. Mid-market companies with 50,000–500,000 square feet of space find outsourcing particularly attractive when paired with smart building management platforms that provide real-time visibility without the overhead of maintaining in-house technical staff.

By End-User Industry

Segment Key Metric Primary Demand Driver
Commercial 25.70% share (2025) Office, retail, and mixed-use portfolio expansion
Hospitality USD 485 Billion (2025) Guest experience differentiation; energy management
Institutional & Public Infrastructure 4.90% CAGR Government efficiency mandates; PPP contracts
Healthcare 8.42% CAGR Smart-hospital investments: infection control systems
Others USD 310 Billion (2025) Industrial, data centers and education


The Commercial segment leads the Facility Management Market as corporate tenants demand Grade-A building operations management standards — 24/7 HVAC reliability, sub-60-second elevator wait times, and WELL-certified indoor air quality. Property maintenance tools tailored for multi-tenant commercial assets are the fastest-evolving software category within workplace facility software suites.

Healthcare is the most dynamic growth vertical. Hospitals require 24/7 critical environment monitoring, backup power assurance, and biomedical equipment maintenance that exceeds standard commercial specifications. Investments in smart building management for healthcare — including real-time location systems for assets and automated sterilization validation — are projected to grow at 8.42% CAGR through 2035, outpacing every other end-user segment in the Facility Management Market [7].


Regional Market Share Analysis

Region Key Metric Primary Investment Themes
Asia-Pacific 44.0% share (2025) Urbanization, smart city programs and integrated facility services expansion
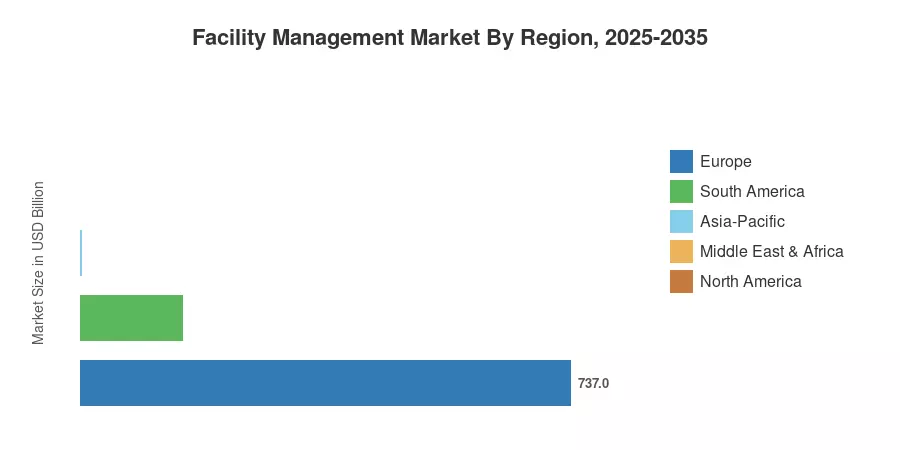
Europe USD 737 Billion (2025) Decarbonization retrofits, workplace facility software compliance
North America 4.55% CAGR Cloud-native property maintenance tools, hybrid workplace reconfiguration
South America USD 153 Billion (2025) Public infrastructure PPPs, outsourcing growth
Middle East & Africa 7.62% CAGR Mega-projects, smart building management for new cities
Total USD 3.07 Trillion (2025)

The Facility Management Market exhibits pronounced regional variation shaped by infrastructure maturity, regulatory frameworks, and outsourcing culture. Asia-Pacific dominates in sheer building stock volume, while Europe leads in sustainability-driven building operations management mandates.


North America

Country Key Metric Key Driver
US 72% of regional share Federal building efficiency standards; LEED/WELL certifications
Canada 4.80% CAGR Carbon tax escalation; net-zero public building mandates
Mexico USD 38 Billion (2025) Nearshoring industrial parks are driving demand for property maintenance tools.


North America's Facility Management Market benefits from a mature outsourcing ecosystem and high penetration of workplace facility software. The US General Services Administration's USD 3.4 billion annual building operations budget sets procurement benchmarks that ripple across the private sector [4]. Canada's escalating federal carbon tax — reaching CAD 170/tonne by 2030 — is accelerating retrofits with smart building management systems.

Europe

Country Key Metric Key Driver
Germany 22% of the regional share Energiewende building retrofit program
UK 5.10% CAGR MEES regulations tightening EPC thresholds
France USD 98 Billion (2025) Décret tertiaire energy reduction mandates
Italy 4.40% CAGR Superbonus 110% building efficiency incentives
Spain USD 52 Billion (2025) Tourism infrastructure modernization
Nordic Countries 5.35% CAGR Carbon-neutral building targets by 2030
Russia USD 31 Billion (2025) District heating system upgrades
Rest of Europe 4.20% CAGR EU Renovation Wave funding programs


The EU Renovation Wave initiative targets the renovation of 35 million buildings by 2030, creating sustained demand for integrated facility services across the continent [2]. Germany's building sector accounts for over 30% of national energy consumption, and regulatory pressure is converting this into a pipeline for smart building management upgrades within the Facility Management Market.

Asia-Pacific

Country Key Metric Key Driver
China 38% of regional share Urban renewal campaigns; green building codes
India 8.15% CAGR Smart Cities Mission; commercial real estate boom
Japan USD 142 Billion (2025) Aging infrastructure; seismic resilience upgrades
South Korea 5.60% CAGR Smart city pilots; K-Green New Deal
ASEAN USD 118 Billion (2025) Manufacturing corridor expansion
Rest of Asia-Pacific 6.20% CAGR Digital infrastructure leapfrogging


Asia-Pacific's dominance in the Facility Management Market stems from sheer scale — China alone added over 6 billion square meters of commercial floor space in the past decade [9]. India's property maintenance tools adoption is accelerating as global capability centers expand across Hyderabad, Pune, and Bengaluru, requiring building operations management aligned with multinational standards.

South America

Country Key Metric Key Driver
Brazil 62% of regional share Public-private partnerships in healthcare and education facilities
Argentina 4.30% CAGR Industrial park development
Rest of South America USD 22 Billion (2025) Mining and energy sector facility outsourcing


Brazil's Facility Management Market is the regional anchor, with São Paulo and Rio de Janeiro hosting the densest concentration of outsourced building operations management contracts. Government infrastructure concessions are increasingly bundling integrated facility services requirements into long-term PPP agreements [15].

Middle East & Africa

Country Key Metric Key Driver
Saudi Arabia 34% of the regional share Vision 2030 mega-projects (NEOM, The Line, Jeddah Tower)
UAE 7.90% CAGR Expo legacy assets: smart city districts
South Africa USD 18 Billion (2025) Commercial property formalization
Egypt 6.80% CAGR New Administrative Capital commissioning
Rest of MEA USD 24 Billion (2025) Hospitality and retail infrastructure


The Middle East & Africa region is the fastest-growing geography in the Facility Management Market, powered by USD 1.3 trillion in active construction pipelines across the GCC [6]. Saudi Arabia's giga-projects require turnkey smart building management and workplace facility software from day one, attracting global integrated facility services providers to establish regional headquarters in Riyadh.


Facility Management Market By Region, 2025-2035

Competitive Benchmarking

The Facility Management Market is somewhat concentrated, with the top five providers anticipated to have a market share of between 18% and 24% and an HHI below 500, indicating a fragmented competitive landscape. The integrated facility services across a number of geographies have the benefits of scale, while local specialists have strong positions in regulated verticals. The shift toward tech-platform differentiation is changing the competitive landscape: Providers are spending extensively on proprietary workplace facility software and smart-building management capabilities.

Company Est. Revenue Share Range Key Offerings for the Facility Management Market Strategic Positioning
CBRE Group ~4–6% Global workplace solutions, project management and property maintenance tools Full-service CRE and FM integration
JLL (Jones Lang LaSalle) ~3–5% Integrated facility services, sustainability consulting, workplace facility software Technology-forward, ESG-aligned advisory
ISS A/S ~3–5% Workplace experience, cleaning, catering and building operations management People-led, place-powered service model
Sodexo ~2–4% Food services, technical maintenance and integrated facility services Quality-of-life services bundling
Cushman & Wakefield ~2–4% Property management, smart building management and tenant services Global CRE advisory with FM delivery
Compass Group ~2–3% Support services, catering and cleaning Scale-driven soft services leadership
Aramark ~1–3% Facilities, uniforms and food services Institutional and healthcare FM specialist
Mitie Group ~1–2% Technology-enabled FM, energy management, security UK-anchored digital FM pioneer
Atalian Global Services ~1–2% Multi-service FM, workspace management European mid-market integration
Dussmann Group ~1–2% Technical FM, facility services, building operations management German engineering heritage; healthcare focus

Recent News & Developments

  • JLL (January 2025): Launched "JLL Azara," an AI-powered workplace facility software platform that uses generative AI to automate tenant communications and work-order prioritization across 4,500 managed properties globally [4].

Facility Management Market Report Scope

Parameter Details
Market Scope Global Facility Management Market covering hard services, soft services, in-house and outsourced models, and five end-user verticals
Study Period 2021–2035
CAGR 4.72% (2026–2035)
Market Size (2025) USD 3.07 Trillion
Market Size (2035) USD 4.98 Trillion
Fastest Growing Segments Healthcare (end-user); Soft Services (service type); Middle East & Africa (region)
Companies Profiled CBRE, JLL, ISS A/S, Sodexo, Cushman & Wakefield, Compass Group, Aramark, Mitie Group, Atalian Global Services, Dussmann Group
Valuation Currency USD (Trillion)


FAQs

How do facility management contracts typically structure performance guarantees?
Most outsourced contracts use tiered SLAs with penalty-bonus mechanisms tied to uptime, energy savings, and occupant satisfaction scores. Performance bonds of 5–10% of the annual contract value are standard in the Facility Management Market [10].
What cybersecurity frameworks are recommended for connected building systems?
The NIST Cybersecurity Framework and IEC 62443 are the most widely adopted standards for operational technology in smart building management environments. Adoption rates remain below 40% globally, creating vulnerability gaps [12].
How does the shift to hybrid work affect facility management demand?
Hybrid work reduces per-seat space requirements but increases demand for flexible workplace facility software, occupancy sensors, and dynamic space-booking systems. Net spending impact on the Facility Management Market is positive [4].
What distinguishes integrated facility services from traditional single-service contracts?
Integrated contracts bundle hard and soft services under one provider with unified KPIs and a single point of accountability. They typically deliver 12–18% cost savings over disaggregated procurement [10].
How are facility managers addressing Scope 3 emissions reporting?
Advanced property maintenance tools now embed carbon calculators that track embodied emissions from maintenance materials and supply chain logistics. Third-party verification modules are emerging as a premium feature in the Facility Management Market [2].
What role does predictive maintenance play in reducing the total cost of ownership?
Predictive analytics using vibration, thermal, and acoustic sensor data can cut unplanned downtime by 35–50% and extend equipment life by 20–30%. ROI typically materializes within 12–18 months of deployment [8].
Which financing models help small asset owners afford smart building upgrades?
Energy-as-a-Service and managed-service agreements allow building operations management upgrades with zero upfront capital. Providers recoup investment through guaranteed energy savings shared over 5–10 year terms [5].    
Author
Author
Author Profile
Ankit Gupta LinkedIn
Team Lead - Research
Ankit Gupta is a seasoned market intelligence and strategic research professional with over six plus years of experience in the ICT and Semiconductor industries. With academic roots in Telecom, Marketing, and Electronics, he blends technical insight with business strategy. Ankit has led 200+ projects, including work for Fortune 500 clients like Microsoft and Rio Tinto, covering market sizing, tech forecasting, and go-to-market strategies. Known for bridging engineering and enterprise decision-making, his insights support growth, innovation, and investment planning across diverse technology markets.

Research Approach


Secondary Research

The secondary research process involved comprehensive analysis of regulatory databases, industry publications, government construction statistics, and authoritative facilities management organizations. Key sources included the International Facility Management Association (IFMA.org), Royal Institution of Chartered Surveyors (RICS), Building Owners and Managers Association International (BOMA), US General Services Administration (GSA), UK Government Property Agency, EU Eurostat Construction Statistics, US Bureau of Labor Statistics (BLS), Occupational Safety and Health Administration (OSHA), US Energy Information Administration (EIA), World Green Building Council, International Labour Organization (ILO), and national infrastructure development reports from key markets.

Building stock data, outsourcing trends, sustainability benchmarks, regulatory compliance standards, and market landscape analysis for hard and soft facility services, healthcare facilities management, government infrastructure, and commercial real estate were all gathered from these sources.


Primary Research

In order to gather both qualitative and quantitative insights, supply-side and demand-side stakeholders were interviewed during the primary research process. CEOs, COOs, VPs of Operations, heads of business development, and technical directors from property management companies, specialized service contractors, and integrated facility management providers were examples of supply-side sources. Chief facility officers, real estate directors, corporate occupier procurement heads, hospital administrators, government estate managers, and defense infrastructure officers were examples of demand-side sources. In addition to gathering information on outsourcing adoption trends, contract pricing structures, and technology integration tactics, primary research verified market segmentation and service expansion schedules.

Primary Respondent Breakdown:

By Designation: C-level Primaries (28%), Director Level (35%), Others (37%)

By Region: North America (32%), Europe (30%), Asia-Pacific (28%), Rest of World (10%)

By Service Focus: Hard Services (45%), Soft Services (40%), Integrated Solutions (15%)


Market Size Estimation

Contract value analysis and revenue mapping were used to determine the global market valuation. The methodology comprised:

Finding more than fifty important service suppliers across the Middle East and Africa, Europe, Asia-Pacific, and North America

Service mapping for specialist solutions (energy management, sustainability advice), soft services (cleaning, security, catering, landscaping), and hard services (HVAC, electrical, plumbing, building fabric)

Examination of annual revenues for facility management portfolios, both reported and modeled

Coverage of suppliers accounting for 75–80% of the worldwide market in 2024

Extrapolation of segment-specific valuations for the healthcare, government, real estate, military & defense, and education verticals utilizing top-down (service provider revenue validation) and bottom-up (contract value × service penetration by vertical and region) methods

Download Free Sample

Kindly complete the form below to receive a free sample of this Report

Download PDF ×

We do not share your information with anyone. However, we may send you emails based on your report interest from time to time. You may contact us at any time to opt-out.
















