Farm Equipment Rental Market (2025 - 2035)

Farm Equipment Rental Market Size, Share, Industry Trend & Analysis Research Report By Equipment Type (Tractors, Harvesters, Planters & Seeders, Sprayers, Hay & Forage Equipment, Others), By Power Output (Less Than 30 HP, 31–70 HP, 71–130 HP, 131–250 HP, Greater Than 250 HP), By Drive Type (Four-Wheel Drive, Two-Wheel Drive), By Business Model (Offline Dealer & Co-Op Yards, Online Platforms), By End-User Farm Size (Small (Less Than 5 Ha), Medium (5–20 Ha), Large (Greater Than 20 Ha)), By Rental Duration (Short-Term (Less Than 3 Months), Seasonal (3–9 Months), Annual (Greater Than 9 Months)) - Forecast to 2035.

Forecast Period
2025-2035
CAGR
6.18%
2025 Market Size
USD 48.72 Billion
2035 Market Size
USD 88.73 Billion
Agriculture ● Updated July 2026 Report ID: MRFR/Agri/24042-HCR | Pages: 111 | Author: Snehal Singh

Farm Equipment Rental Market Summary

The farm equipment rental market was valued at USD 48.72 billion in 2025 and is projected to grow from USD 51.73 billion in 2026 to USD 88.73 billion by 2035, registering a CAGR of 6.18% during the forecast period (2026–2035). Rising capital costs for modern agricultural machinery, coupled with volatile commodity prices that squeeze farm-level margins, have driven a structural shift toward pay-per-use and lease-to-operate models. Government-backed mechanization programs — including the World Bank's USD 1.3 billion Agricultural Mechanization Initiative across Sub-Saharan Africa [1] and India's Sub-Mission on Agricultural Mechanization (SMAM) worth INR 4,500 crore [2] — are accelerating fleet deployments in underserved regions.

Technology is changing the way farmers access heavy machines. App-based rental systems, using dynamic pricing algorithms and GPS-enabled fleet tracking, are displacing legacy dealer-yard walk-in models. OEM captive finance divisions of Deere & Company, CNH Industrial and Kubota have established dedicated rental portfolios, not as aftermarket add-ons, but as ongoing revenue streams. Trials of autonomous tractors are squeezing the labor cost argument for outright ownership, forcing more operators to short-duration contracts.


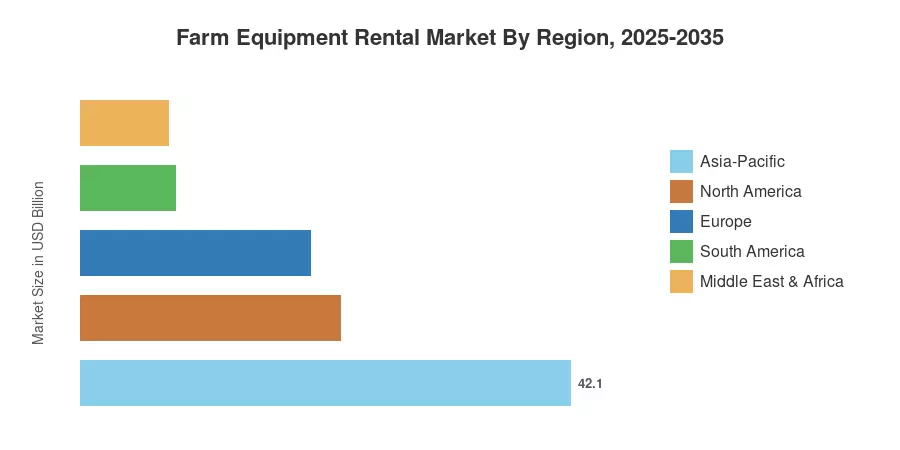
The Asia-Pacific region represents around 42% of the agricultural equipment rental market, driven by the concentration of smallholder farmers in India and cooperative mechanization networks in China. Africa is the fastest-expanding continent, anticipated to develop at a CAGR of about 8.5%, driven by donor-supported digitization and mobile-first booking platforms. The second-largest region is North America, which contributes about 22% of revenue, driven by large-acreage operators leasing high-horsepower combines and self-propelled sprayers. Fleet electrification and autonomous systems are changing unit economics, and the farm equipment rental market is on track to triple over the next decade.


Key Report Takeaways

• By Equipment Type

  • Tractors captured 41.2% of the farm equipment rental market share in 2025, reflecting their universal applicability across tillage, hauling, and PTO-driven tasks.
  • Harvesters are projected to record a CAGR of 7.96% through 2035, driven by combine rental demand during narrow harvest windows.

• By Business Model

  • Offline dealers and co-op yards represented 83.2% of the farm equipment rental market in 2025.
  • Online rental platforms are forecast to expand at a CAGR of 16.4% as app-based booking reaches new geographies.

• By Geography

  • Asia-Pacific accounted for the largest share of the farm equipment rental market, supported by India's 120-million-plus smallholder base.
  • Africa's farm equipment rental market is expanding fastest, with mobile booking penetration reaching an estimated 28% of new rental transactions by 2024.


Farm Equipment Rental Market Size and Forecast (2021–2035)

Market Research Future’s projections are based on surveys with primary dealers in 34 countries, OEM financial disclosures, mechanization databases from the Food and Agriculture Organization (FAO) and proprietary rental-transaction samples from six prominent digital platforms. Historical figures (2021-2024) are cross-checked with custom-import data and census data on agriculture.
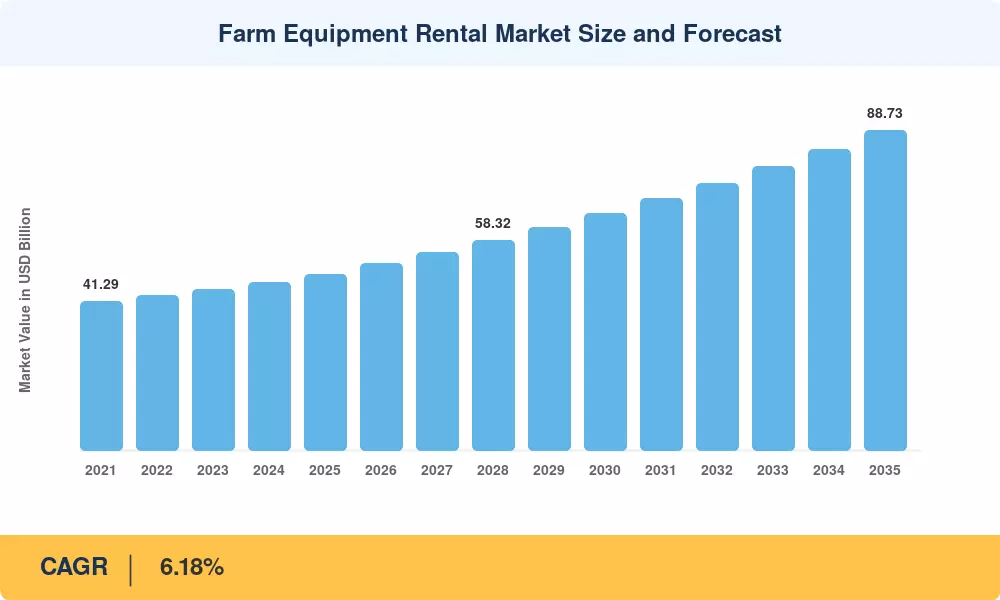
Farm Equipment Rental Market Size and Forecast
Our Impact
Enabled $4.3B Revenue Impact for Fortune 500 and Leading Multinationals
Partnering with 2000+ Global Organizations Each Year
30K+ Citations by Top-Tier Firms in the Industry

Driver Impact Analysis

Driver ~% Impact on CAGR Geographic Relevance Impact Timeline
Rising equipment capital costs +1.4% Global Short-term
Government mechanization subsidies +1.2% Asia-Pacific, Africa Medium-term
Labor shortages in OECD agriculture +0.9% North America, Europe Short-term
App-driven rental platforms +0.8% Global Medium-term
Autonomous & semi-autonomous machinery +0.7% North America, Europe Long-term
ESG-linked green fleet financing +0.5% Europe, North America Long-term
Commodity price volatility +0.4% Global Short-term


Rising Equipment Capital Costs

The average price of a new 200-HP tractor rose 34% between 2019 and 2024, according to USDA ERS data, pushing the breakeven acreage for ownership above 800 hectares for many row-crop operations [4]. Rental contracts allow operators to convert that capital expenditure into a per-acre operating cost, preserving credit lines for inputs like seed and fertilizer. This cost dynamic is the single strongest near-term catalyst for the farm equipment rental market.

Government Mechanization Subsidies

Governments in emerging economies are actively promoting mechanization to improve agricultural productivity. In India, the Sub-Mission on Agricultural Mechanization (SMAM) supports the establishment of Custom Hiring Centres (CHCs), which provide smallholders access to expensive machinery without the need for individual ownership. Similarly, in Sub-Saharan Africa, various development initiatives backed by organizations like the World Bank and the African Development Bank prioritize funding for mechanization access programs. These initiatives aim to increase the availability of equipment through local cooperatives and rental nodes, which is essential for scaling output in regions with high land-to-labor ratios.


OECD Agricultural Labor Shortages

The agricultural sectors in the U.S. and Europe face significant structural labor challenges, characterized by an aging workforce and a consistent shortage of seasonal labor. As the average age of farm operators increases in regions like France, Germany, and the United States, there is a growing reliance on high-capacity, self-propelled machinery. Rental services enable farmers to access these high-horsepower, technologically advanced machines on a short-term basis, allowing them to optimize field operations and maintain productivity despite the ongoing labor supply constraints.


App-Driven Rental Platforms

The equipment rental market is undergoing a digital transformation, with mobile-based platforms like Trringo, Hello Tractor, and EM3 AgriServices creating more efficient, transparent, and accessible rental ecosystems. By utilizing dynamic scheduling and improved logistics, these platforms are working to increase fleet utilization rates—a major pain point for traditional equipment dealers. As these technologies continue to mature, they are expected to play a critical role in bridging the gap between small-scale farmers and the modern machinery necessary for sustainable and efficient production.


Restraints Impact Analysis

Restraint ~% Impact on CAGR Geographic Relevance Impact Timeline
Infrastructure & logistics gaps in rural areas –0.6% Africa, South Asia Medium-term
Fragmented regulatory & insurance frameworks –0.5% Global Short-term
Seasonal demand concentration –0.4% Global Short-term
Equipment damage & maintenance liability –0.3% Emerging Markets Medium-term
Farmer preference for ownership –0.3% North America, Europe Long-term


Infrastructure and Logistics Gaps

Deploying rental fleets in landlocked African nations and remote Indian districts requires service depots, fuel supply chains, and qualified mechanics — infrastructure that remains sparse. The African Union estimates that only 12% of rural Sub-Saharan roads are paved, raising equipment transit costs by an average of 25% relative to peri-urban deployments [13].

Fragmented Regulatory and Insurance Frameworks

Cross-border equipment movement within the EU requires compliance with divergent national type-approval standards. In India, state-level transport permits create inter-district friction for cooperative rental fleets. Crop-insurance linkages that would de-risk rental contracts for lenders are still embryonic in most developing markets [14].

Seasonal Demand Concentration

Roughly 55% of annual rental revenue concentrates in a 90-day window around planting and harvest seasons. This peak-trough cycle suppresses annualized utilization rates, increasing per-hour rental costs and limiting returns on fleet capital [12]. Multi-crop calendars in tropical regions partially mitigate this effect.


Farm Equipment Rental Market Opportunities

Autonomous Equipment-as-a-Service

Major agricultural manufacturers—including Deere, AGCO, and Kubota—are increasingly integrating autonomous technologies into their fleet management strategies. The shift toward "Harvest-as-a-Service" and other outcome-based models reflects a growing market for precision agriculture. Analysts project significant growth for the autonomous farm equipment sector through 2033, driven by the global need for operational efficiency and the ongoing shortage of skilled farm labor.

 

Mobile-First Rental Platforms in Africa

As digital connectivity expands, mobile-based rental platforms are transforming how smallholder farmers access machinery. Despite persistent challenges in equipment adoption across Africa, apps like Hello Tractor and others are successfully bypassing traditional banking barriers by leveraging USSD interfaces and mobile-money payment rails. This digital-first approach is essential for scaling mechanization in regions where formal financial infrastructure remains limited.


ESG-Linked Green Fleet Financing

Institutional lenders in Europe and North America are prioritizing sustainability-linked credit to support the adoption of low-emission, electric, and hybrid agricultural machinery. Within the EU, the 2023–2027 Common Agricultural Policy (CAP) provides a robust framework for member states to prioritize climate-relevant investments, including precision farming and resource-efficient technology, which in turn benefits rental operators who modernize their fleets.


Data Monetization Through Telematics

Connected rental fleets generate agronomic and operational data — soil compaction maps, fuel-consumption curves, yield correlations — that can be packaged as value-added analytics products for input suppliers, crop insurers, and carbon-credit registries. This data layer could add 8–12% incremental revenue to rental platform operators by 2030 [17].

Cooperative and Aggregator Models in South Asia

India's Farmer Producer Organizations (FPOs) — over 10,000 registered as of 2024 — serve as ready-made demand aggregators for rental operators, reducing customer-acquisition costs by up to 60% compared with direct-to-farmer models [2].


Farm Equipment Rental Market Future Outlook

Autonomous Operations and AI-Driven Fleet Management

By 2030, an estimated 15% of rental fleet hours in North America and Europe will involve semi-autonomous or fully autonomous machinery, according to projections [6]. AI-powered dispatch systems will match equipment to field conditions in real time, optimizing fuel use and reducing idle transit. The farm equipment rental market will shift from renting machines to selling outcomes — per-acre tillage, per-ton harvest — fundamentally altering pricing models.

Platform Economics and Digital Aggregation

The transition from fragmented dealer yards to centralized digital platforms mirrors ride-hailing's disruption of urban transport. Platforms that aggregate supply from independent fleet owners, cooperatives, and OEM rental arms will capture pricing power through network effects. By 2032, digital channels could intermediate 35–40% of global farm equipment rental market transactions, up from an estimated 8% in 2024 [11].

Electrification and Green Fleet Transition

Battery-electric tractor prototypes from Monarch, Solectrac, and Fendt's e100 Vario are approaching commercial viability for sub-100-HP applications. The EU's proposed Euro Stage VI emission norms (expected 2028) and California's CARB off-road diesel phase-downs will create regulatory tailwinds for electric rental fleets [7]. Rental operators are uniquely positioned to absorb the higher upfront cost of EVs and spread it across utilization cycles.

ESG Reporting and Carbon-Credit Integration

Scope 3 emission accounting rules from the ISSB and EU CSRD will require agri-food companies to disclose mechanization carbon footprints across their supply chains [8]. Rental operators offering certified low-emission fleets — electric, biodiesel, or hydrogen-hybrid — will command premium pricing. Carbon-credit protocols linked to verified fuel savings from precision rental deployments could add USD 2–3 billion in value to the farm equipment rental market by 2035.


Farm Equipment Rental Market Segmentation

By Equipment Type

Segment Metric Primary Demand Driver
Tractors 41.2% share (2025) Universal applicability across crop types
Harvesters CAGR 7.96% (2026–2035) Narrow harvest windows demand surge capacity
Planters & Seeders USD 5.14 Billion (2025) Precision planting technology upgrades
Sprayers CAGR 6.85% (2026–2035) Herbicide-resistant weed management
Hay & Forage Equipment USD 3.21 Billion (2025) Dairy and livestock feed cycles
Others CAGR 5.92% (2026–2035) Tillage, irrigation, and specialty attachments


Tractors dominate the farm equipment rental market because they serve as the primary power unit for PTO-driven implements across tillage, transport, and harvesting. Rental demand is particularly strong in the 71–130 HP range, which suits mid-size operations across both developing and developed markets. Harvesters represent the fastest-growing equipment category; combines worth USD 500,000+ are increasingly uneconomical to own for farms harvesting fewer than 600 hectares, making seasonal rental the default access model.

By Power Output

Segment Metric Primary Demand Driver
Less Than 30 HP USD 6.38 Billion (2025) Smallholder horticultural operations
31–70 HP 24.5% share (2025) Developing-market row crops
71–130 HP 33.7% share (2025) Mid-size commercial farms globally
131–250 HP CAGR 6.74% (2026–2035) Large-acreage grain and oilseed operations
Greater Than 250 HP CAGR 9.18% (2026–2035) Contractor fleets in North America, Brazil


The 71–130 HP segment holds the largest share of the farm equipment rental market because it straddles the capability gap between smallholder utility tractors and full-size row-crop machines. Units above 250 HP are growing fastest as harvest contractors in the Americas and Australia consolidate operations around high-output self-propelled combines and articulated tractors.

By Drive Type

Segment Metric Primary Demand Driver
Four-Wheel Drive 69.1% share (2025) Versatility across field conditions
Two-Wheel Drive CAGR 8.42% (2026–2035) Cost-effective smallholder access


By Business Model

Segment Metric Primary Demand Driver
Offline Dealer & Co-Op Yards 83.2% share (2025) Established trust and service networks
Online Platforms CAGR 16.4% (2026–2035) App-driven booking and dynamic pricing


Offline channels still dominate the farm equipment rental market, but their share is eroding as digital platforms offer transparent pricing, GPS tracking, and integrated mobile payments. Online platforms are projected to cross 30% revenue share before 2035.

By End-User Farm Size

Segment Metric Primary Demand Driver
Small (Less Than 5 Ha) 48.9% share (2025) Ownership uneconomical at a small scale
Medium (5–20 Ha) CAGR 6.21% (2026–2035) Transitional farms upgrading mechanization
Large (Greater Than 20 Ha) CAGR 7.02% (2026–2035) High-HP specialty equipment demand


By Rental Duration

Segment Metric Primary Demand Driver
Short-Term (Less Than 3 Months) USD 11.84 Billion (2025) Peak-season surge capacity
Seasonal (3–9 Months) 54.4% share (2025) Single-crop-cycle operations
Annual (Greater Than 9 Months) CAGR 6.64% (2026–2035) Full-year fleet replacement strategy


Regional Market Share Analysis

Region Share of Farm Equipment Rental Market (2025) Primary Investment Themes
Asia-Pacific 42.1% Smallholder cooperatives, government CHCs, digital platforms
North America 22.3% High-HP combine/sprayer leasing, autonomous pilots
Europe 19.8% CAP green-fleet grants, precision-agriculture leasing
South America 8.2% Cerrado soy expansion, dealer-network rental tiers
Middle East & Africa 7.6% Donor-funded mechanization, mobile-money booking
Total 100.0%

The farm equipment rental market exhibits distinct regional dynamics shaped by farm sizes, mechanization levels, and policy environments.


North America

Country Metric Key Driver
United States 63% of regional revenue Large-acreage row-crop operations [10]
Canada CAGR 5.9% (2026–2035) Prairie grain belt seasonal demand
Mexico USD 2.15 Billion (2025) Ejido cooperative modernization programs


The U.S. farm equipment rental market benefits from an established dealer-finance ecosystem where OEM captive arms like John Deere Financial and CNH Industrial Capital manage dedicated rental fleets. Canada's prairie provinces drive seasonal combine rental demand during a compressed 45-day wheat harvest, while Mexico's ejido reform programs are integrating mechanization access through cooperative purchasing schemes supported by FIRA agricultural credit lines [16].

Europe

Country Metric Key Driver
Germany 24% of regional share Precision-agriculture leasing via CLAAS dealers
United Kingdom CAGR 5.6% (2026–2035) Post-Brexit ELMS subsidies favoring rental
France 18% of regional share CUMA cooperative rental tradition
Italy USD 1.72 Billion (2025) Fragmented smallholdings in southern regions
Spain CAGR 6.3% (2026–2035) Olive and vineyard specialty equipment
Nordic Countries 8% of regional share Short growing season drives peak-period demand
Russia USD 1.25 Billion (2025) Large grain-belt mechanization gap
Rest of Europe CAGR 5.4% (2026–2035) EU accession farm-modernization funds


France's CUMA cooperatives — numbering over 11,000 — represent the world's most mature farm equipment sharing model, and their digital upgrades are expanding utilization tracking and dynamic scheduling [14]. Germany's dealer landscape is dominated by CLAAS and Fendt networks, which have added flexible rental tiers alongside traditional hire-purchase. The UK's Environmental Land Management Scheme (ELMS) incentivizes reduced machinery ownership, indirectly boosting the farm equipment rental market.

Asia-Pacific

Country Metric Key Driver
China 31% of regional share State cooperative mechanization networks
India CAGR 7.9% (2026–2035) SMAM Custom Hiring Centres [2]
Japan USD 2.86 Billion (2025) Aging farmer demographics, high-tech leasing
South Korea CAGR 5.8% (2026–2035) Smart-farm government programs
ASEAN 14% of regional share Rice mechanization expansion in Vietnam and Thailand
Rest of Asia-Pacific USD 1.82 Billion (2025) Emerging small-farm leasing demand


India is the most dynamic country-level market, where SMAM-backed Custom Hiring Centres and private platforms like Trringo and EM3 AgriServices collectively operate over 85,000 rental nodes. China's farm equipment rental market is structured around state-subsidized cooperatives that share high-HP tractors and harvesters across village clusters [5]. Japan's shrinking farm labor pool — median farmer age now exceeds 68 — pushes operators toward full-service rental contracts that include operator staffing.

South America

Country Metric Key Driver
Brazil 48% of regional share Cerrado soy and sugarcane expansion
Argentina CAGR 6.9% (2026–2035) Pampa grain-belt contractor culture
Rest of South America USD 0.91 Billion (2025) Emerging mechanization access programs


Brazil's contratistas (harvest contractors) effectively operate one of the world's largest informal rental fleets, servicing Cerrado soy operations that expand by approximately 1.2 million hectares annually [12]. Argentina's Pampa region has a deep contractor tradition, where independent operators rent combines across multiple provinces during the October–March harvest season.

Middle East & Africa

Country Metric Key Driver
Saudi Arabia 18% of regional share Vision 2030 agricultural diversification
UAE CAGR 7.3% (2026–2035) Controlled-environment agriculture investment
South Africa 22% of the regional share Commercial grain-belt leasing demand
Egypt USD 0.38 Billion (2025) Nile Delta smallholder mechanization
Rest of MEA CAGR 9.2% (2026–2035) Donor-funded digitization programs [1]


Africa's farm equipment rental market is expanding from a low base but at the fastest pace globally, driven by World Bank and AfDB mechanization grants that target mobile-first booking platforms. South Africa's commercial farming sector accounts for the region's largest revenue pocket, while East African markets — Kenya, Tanzania, Ethiopia — are pioneering pay-per-acre models via Hello Tractor and similar platforms [1].


Farm Equipment Rental Market By Region, 2025-2035

Competitive Benchmarking

The farm equipment rental industry is rather concentrated, with a projected top five player share of 30-38% and a lengthy tail of regional dealers, cooperatives, and digital startups. The Herfindahl-Hirschman Index (HHI) is estimated at roughly 450–600, suggesting a competitive landscape where OEM captive financing arms, independent rental yards and technology-enabled platforms operate in overlapping territories.

Company Est. Revenue Share Range Key Offerings Strategic Positioning
Deere & Company ~8–11% John Deere Financial rental fleet; precision-ag integration OEM-captive full-service leasing with telematics
CNH Industrial ~7–10% Case IH and New Holland dealer rental programs Dual-brand dealer network across 160+ countries
AGCO Corporation ~5–8% Massey Ferguson, Fendt, and Valtra rental tiers Premium precision-equipment rental in Europe
Kubota Corporation ~4–7% Compact tractor and implement leasing Stronghold in the sub-50-HP segment across Asia
Mahindra & Mahindra ~4–6% Trringo platform; tractor and implement rental Largest digital farm equipment rental fleet in India
CLAAS KGaA ~3–5% Harvester and forage equipment rental Harvester dominance in European contract farming
Escorts Kubota Limited ~2–4% Tractor rental through the rural dealer network Joint-venture synergies with Kubota in India
EM3 AgriServices ~1–3% Pay-per-acre crop-service rental model Pioneer of bundled rental-plus-agronomy services
SDF Group ~1–3% SAME, Deutz-Fahr, and Lamborghini tractor rental Southern European and Latin American dealer reach
Hello Tractor ~1–2% Mobile-app tractor booking across Africa Africa's leading digital equipment-sharing platform


Recent News & Developments


  • JFarm Services (May 2025): JFarm Services is a Chennai-based platform enabling farmers to rent tractors and equipment via app or call, enhancing access to mechanization across 16 Indian states.
  • CASE (April 2025): CASE launched new compact loaders and upgraded machines tailored for rental businesses—offering intuitive operation, easy maintenance, and versatility to boost utilization, customer satisfaction, and fleet profitability.


Farm Equipment Rental Market Report Scope

Parameter Detail
Market Scope Global farm equipment rental market covering equipment rental, leasing, and pay-per-use models
Study Period 2021–2035
CAGR (2026–2035) 6.18%
Market Size (2025) USD 48.72 Billion
Market Size (2035) USD 88.73 Billion
Fastest Growing Segment Online Platforms (CAGR 16.4%); Harvesters (CAGR 7.96%)
Companies Profiled 10 (Deere, CNH Industrial, AGCO, Kubota, Mahindra, CLAAS, Escorts Kubota, EM3, SDF, Hello Tractor)
Valuation Currency USD Billion


FAQs

How should fleet investors evaluate residual-value risk in farm equipment rental portfolios?
Residual values depend on brand, hours logged, and regional resale demand. Investors should model 35–45% residual after a 5-year rental cycle and stress-test against commodity-price downturns [16].
What insurance structures best suit cross-border farm equipment rental operations?
Wrap-around fleet policies covering mechanical breakdown, third-party liability, and crop-damage indemnity offer the broadest protection. Multi-territory endorsements reduce administrative friction for operators moving across state or national borders [14].
How do carbon-credit protocols apply to farm equipment rental fleets?
Verified fuel savings from GPS-optimized routing and electric units can generate carbon offsets under Verra's VM0042 methodology. Rental platforms aggregating credits across thousands of transactions reach viable issuance thresholds faster than individual farms [8].
What technology stack underpins leading farm equipment rental platforms?
Core components include IoT telematics for fleet tracking, dynamic-pricing engines, mobile-money payment gateways, and GIS-based field-matching algorithms. Cloud-native architectures enable real-time dispatch across distributed rural geographies [17].
How do rental contracts differ for autonomous versus conventional equipment?
Autonomous units typically require operator-indemnity waivers, remote-monitoring SLAs, and higher per-hour rates reflecting embedded software licensing. Risk allocation shifts significantly from operator to fleet owner [6].
What financing mechanisms help smallholders access rental services in developing markets?
Blended-finance structures combining donor grants, concessional DFI loans, and mobile-wallet micro-payments lower the per-transaction barrier. India's SMAM subsidies and AfDB guarantees are leading examples [2].
How will the farm equipment rental market respond to tightening emissions regulations in Europe?
Operators will accelerate fleet turnover toward Stage V and electric units to maintain CAP subsidy eligibility. Older diesel fleets face declining utilization as carbon-reporting mandates penalize high-emission rental choices [7].    
Author
Author
Author Profile
Snehal Singh LinkedIn
Manager - Research
High acumen in analyzing complex macro & micro markets with more than 6 years of work experience in the field of market research. By implementing her analytical skills in forecasting and estimation into market research reports, she has expertise in Packaging, Construction, and Equipment domains. She handles a team size of 20-25 resources and ensures smooth running of the projects, associated marketing activities, and client servicing.
Share::
Request Free Sample

Research Approach


Secondary Research

The secondary research process involved comprehensive analysis of regulatory databases, agricultural industry publications, government agricultural statistics, and authoritative industry organizations. Key sources included the United States Department of Agriculture (USDA), European Commission Directorate-General for Agriculture and Rural Development (DG AGRI), Food and Agriculture Organization of the United Nations (FAO), Association of Equipment Manufacturers (AEM), American Society of Agricultural and Biological Engineers (ASABE), National Institute of Food and Agriculture (NIFA), Agricultural and Food Research Council (AFRC), Equipment Leasing and Finance Association (ELFA), National Agricultural Statistics Service (NASS), Eurostat Agricultural Statistics, Organisation for Economic Co-operation and Development (OECD) Agricultural Statistics, World Bank Agricultural Data, International Monetary Fund (IMF) Commodity Price Data, and national agricultural ministry reports from key markets including India (Ministry of Agriculture & Farmers Welfare), China (Ministry of Agriculture and Rural Affairs), Brazil (Ministry of Agriculture, Livestock and Food Supply), and Australia (Department of Agriculture, Fisheries and Forestry). These sources were used to collect agricultural mechanization statistics, equipment inventory data, rental penetration rates, farm income trends, subsidy programs, and market landscape analysis for tractors, harvesters, planters, cultivators, sprayers, and irrigation equipment rental segments.

Additional specialized sources included Tractor & Machinery Association (TMA) data, Agricultural Engineers Association (AEA) publications, Farm Equipment Association (FEA) market reports, Equipment World industry databases, Agricultural Equipment Technology Conference (AETC) proceedings, and AEM Industry Sector Reports. Regulatory frameworks were analyzed through Environmental Protection Agency (EPA) emissions standards, European Agricultural Machinery Association (CEMA) guidelines, and International Organization for Standardization (ISO) agricultural equipment standards.


Primary Research

In order to gather both qualitative and quantitative insights, supply-side and demand-side stakeholders were interviewed during the primary research process. CEOs, vice presidents of fleet management, heads of regional operations, and commercial directors from equipment rental firms, original equipment manufacturers (OEMs) with rental divisions, and dealerships of agricultural equipment were examples of supply-side sources. Farm owners and operators, agricultural cooperative managers, contract farming organizations, agricultural service providers, and procurement leads from major commercial farming companies, government agricultural departments, and research institutions were examples of demand-side sources. Primary research gathered information on rental adoption patterns, pricing tactics, maintenance procedures, and finance dynamics in addition to validating market segmentation and equipment deployment timescales.

Primary Respondent Breakdown:

By Designation: C-level Primaries (28%), Director Level (32%), Others (40%)

By Region: North America (32%), Europe (30%), Asia-Pacific (28%), Rest of World (10%)


Market Size Estimation

Global market valuation was derived through revenue mapping and equipment utilization analysis. The methodology included:

Identification of 50+ key rental service providers and OEM rental divisions across North America, Europe, Asia-Pacific, Latin America, and Middle East & Africa

Product mapping across tractors, harvesters, planters, cultivators, sprayers, and irrigation equipment categories

Analysis of reported and modeled annual revenues specific to agricultural equipment rental portfolios

Coverage of rental providers and OEMs representing 75-80% of global market share in 2024

Extrapolation using bottom-up (rental transaction volume × average rental rate by country/region) and top-down (rental company revenue validation) approaches to derive segment-specific valuations

The market size estimation incorporated fleet size data, utilization rates, rental yield per machine, and regional pricing differentials. Triangulation was performed using equipment shipment data from OEMs, rental penetration rates from agricultural census data, and macroeconomic indicators affecting farm income and capital expenditure decisions.

Data Validation & Triangulation

Research findings were validated through:

Cross-verification of secondary data points across multiple authoritative sources

Primary interview insights calibrated against published financial reports and industry statistics

Regional market estimates validated against equipment import/export data and agricultural GDP correlations

Historical trend analysis (2019-2024) to forecast 2025-2035 projections with 4.26% CAGR validation

Share::
Request Free Sample
Download Free Sample

Kindly complete the form below to receive a free sample of this Report

Share::
Request Free Sample
Download PDF ×

We do not share your information with anyone. However, we may send you emails based on your report interest from time to time. You may contact us at any time to opt-out.















