Fill Finish Manufacturing Market (2025 - 2035)

Fill Finish Manufacturing Market Research Report By Application (Vaccine Filling, Parenteral Drug Filling, Biopharmaceuticals Filling, Diagnostic Product Filling), By Product Type (Pre-filled Syringes, Vials, Cartridges, Ampoules), By Equipment Type (Filling Machines, Capping Machines, Labeling Machines, Inspection Machines), By End User (Pharmaceutical Companies, Contract Manufacturing Organizations, Biotechnology Companies) and By Regional (North America, Europe, South America, Asia Pacific, Middle East and Africa) - Growth & Industry Forecast 2025 To 2035
ID: MRFR/HC/9439-CR
120 Pages
Rahul Gotadki, Kinjoll Dey
Last Updated: July 09, 2026
Fill Finish Manufacturing Market
Market Size
Forecast Period2025-2035
CAGR (2025-2035)8.1%
2025 Market SizeUSD 13.38 billion
2035 Market SizeUSD 29.15 billion
Key Players
Gerresheimer AG
SCHOTT AG
West Pharmaceutical Services
Stevanato Group
Syntegon Technology
IMA Group
Opportunities
  • Modular and Mobile Fill-Finish Platforms
  • Polymer Container Adoption
  • Data Monetization Through Digital Batch Records

Fill finish Manufacturing Market Summary

The Fill Finish Manufacturing Market size was valued at USD 13.38 Billion in 2025, and the market is projected to grow from USD 14.46 Billion in 2026 to USD 29.15 Billion by 2035, registering a CAGR of 8.1% during the forecast period 2026–2035. This growth trajectory is fueled by the accelerating shift in pharmaceutical development toward biologics, monoclonal antibodies, and cell and gene therapies — all of which require injectable delivery in sterile environments [1]. The U.S. Biosecure Act and EU GMP Annex 1 revisions have pushed manufacturers to invest heavily in upgraded filling infrastructure, with an estimated USD 8 billion in global capital expenditure committed between 2024 and 2027 alone [2].

The advent of highly automated, isolator-based filling platforms that can process fragile biologic molecules under rigorous contamination-control regimes is quickly replacing legacy oral-solid dose equipment. Robotic handling systems combined with AI-driven predictive maintenance now enable single filling lines to transition between vials, syringes and cartridges in hours rather than days. The trend to ready-to-use (RTU) container components has additionally decreased changeover times and the risk of particulate contamination, and medication inventors have started to reconsider their procurement strategy [3].


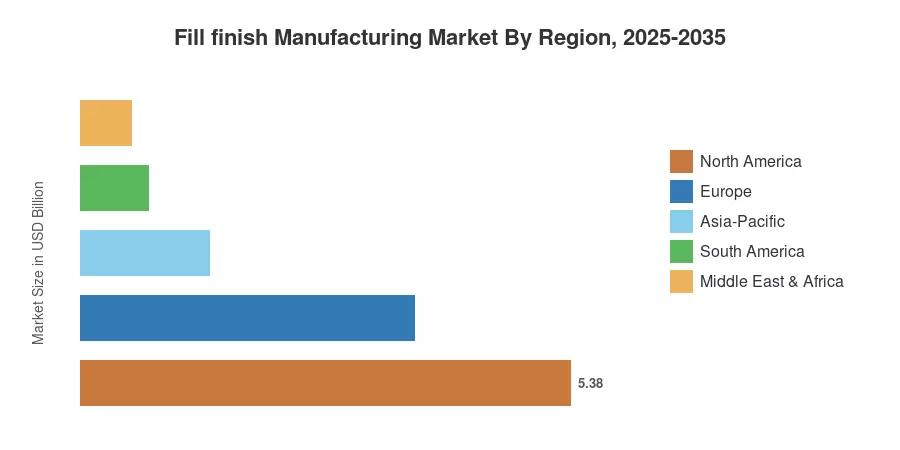
North America accounts for around 40.2% of the fill-finish manufacturing market, with a high concentration of biopharma headquarters and CDMO capacity along the U.S. Eastern Seaboard [4]. 27.4% for Europe, in second place, backed by precision engineering hubs in Germany and Switzerland. The Asia-Pacific is the fastest developing region with a CAGR of 10.6% till 2035, fuelled by the capacity additions in China, India and South Korea [5]. Over the coming decade, contract manufacturers are projected to acquire an increasing part of the worldwide fill-finish capacity as innovators are turning to asset-light models for early-stage pipeline assets.


Key Report Takeaways

• By Product Type

  • Consumables — including prefilled syringes, vials, and cartridges — accounted for 58.2% of the Fill Finish Manufacturing Market in 2025, reflecting ongoing demand for high-volume injectable delivery formats.
  • Instruments and systems are advancing at a 10.2% CAGR through 2035, as manufacturers adopt integrated and automated filling platforms.

• By End User

  • Pharmaceutical and biotechnology companies held 57.3% revenue share of the Fill Finish Manufacturing Market in 2025, driven by in-house capacity for blockbuster biologics.
  • Contract manufacturing organizations are expanding at a 9.9% CAGR through 2035, absorbing pipeline overflow from mid-size biotech innovators.

• By Container Material

  • Glass containers captured 55.4% of the fill-finish manufacturing market share in 2025, though polymer alternatives are growing at a 10.2% CAGR as cyclic-olefin formats gain regulatory acceptance.

• By Geography

  • North America held 40.2% of the fill-finish manufacturing market revenue in 2025.
  • Asia-Pacific is the fastest-growing region with a 10.6% CAGR between 2026 and 2035, led by capacity expansion in China and India.


Market Size and Forecast (2021–2035)

MRFR’s value estimation framework employs a bottom-up revenue analysis of consumables, equipment, and service segments triangulated with the corresponding top-down macroeconomic indicators from WHO pharmaceutical expenditure databases, FDA approval trends, and capacity disclosures from CDMOs [6].
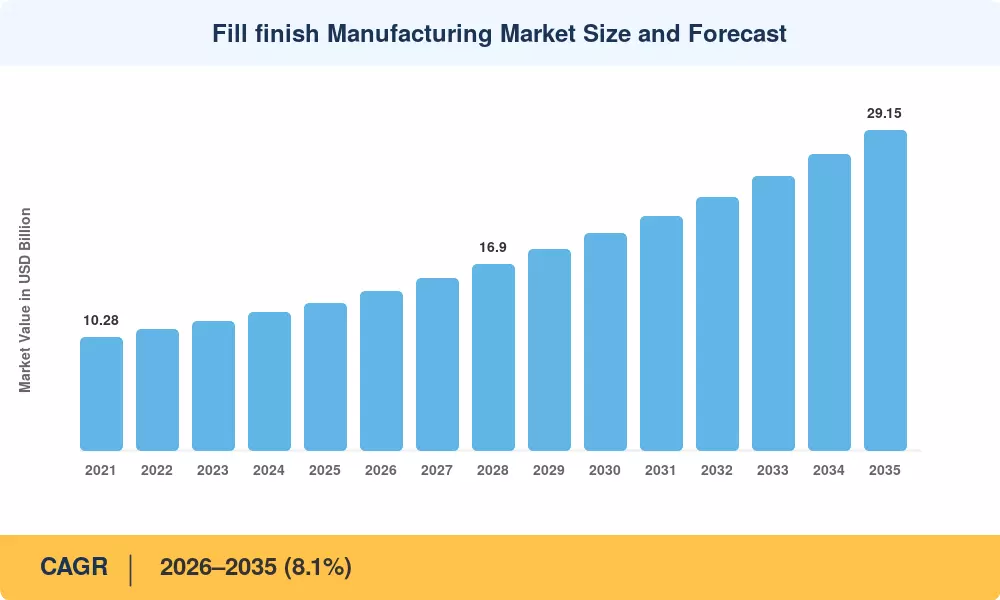
Fill finish Manufacturing Market Size and Forecast
Our Impact
Enabled $4.3B Revenue Impact for Fortune 500 and Leading Multinationals
Partnering with 2000+ Global Organizations Each Year
30K+ Citations by Top-Tier Firms in the Industry

Driver Impact Analysis

Driver ~% Impact on CAGR Geographic Relevance Impact Timeline
Biologics and biosimilar pipeline expansion ~22% Global Long-term (≥4 yr)
EU GMP Annex 1 and regulatory upgrades ~18% Europe, Global Short-term (≤2 yr)
Cell and gene therapy commercialization ~16% North America, Europe Medium-term (2–4 yr)
AI and predictive maintenance adoption ~13% North America, Asia-Pacific Medium-term (2–4 yr)
RTU and polymer container migration ~12% Global Medium-term (2–4 yr)
Strategic CDMO outsourcing acceleration ~11% Global Long-term (≥4 yr)
Pandemic preparedness infrastructure ~8% Global Short-term (≤2 yr)


Biologics and Biosimilar Pipeline Expansion

The global biologics pipeline surpassed 8,500 active molecules in 2024, with the FDA approving 55 novel biologics that year alone — a record that has strained existing fill-finish capacity [1]. Each biologic approval typically requires dedicated sterile filling capacity for clinical and commercial supply, creating sustained demand across the Fill Finish Manufacturing Market. The Inflation Reduction Act's biosimilar incentives have further expanded production requirements, with an estimated 45 biosimilar launches anticipated in the U.S. between 2025 and 2030 [14].

EU GMP Annex 1 Compliance

The revised EU GMP Annex 1, effective August 2023, introduced stringent contamination control strategy (CCS) requirements that compel fill-finish operators across Europe to upgrade or replace aging isolator and RABS infrastructure [9]. Industry estimates suggest compliance costs of EUR 2–5 million per filling line, translating into a multi-billion euro upgrade cycle for the Fill Finish Manufacturing Market—facilities with non-compliant equipment face production shutdowns, creating urgency that is accelerating capital deployment.

Cell and Gene Therapy Commercialization

The FDA's regenerative medicine pipeline included over 1,300 active INDs by late 2024, each requiring specialized small-batch fill-finish capability under cryogenic or controlled-temperature conditions [10]. Autologous cell therapies, with batch sizes as small as a single patient dose, demand flexible isolator systems that differ fundamentally from high-volume vial lines. This niche is driving demand within the Fill Finish Manufacturing Market for modular, single-use filling platforms priced between USD 3–8 million per suite [15].

AI-Driven Predictive Maintenance

Machine-learning algorithms trained on filling-line sensor data can predict mechanical failures 48–72 hours in advance, reducing unplanned downtime by up to 35% according to pilot programs at three top-ten CDMOs [11]. These systems also optimize batch yields by detecting micro-deviations in fill weight or stopper placement, cutting rejection rates by 12–18%. The productivity gains are accelerating adoption across the Fill Finish Manufacturing Market, particularly in high-wage regions where downtime carries substantial opportunity cost.


Restraints Impact Analysis

Restraint ~% Negative Impact on CAGR Geographic Relevance Impact Timeline
High capital intensity of green-field suites ~25% Global Long-term (≥4 yr)
Skilled workforce shortage ~22% North America, Europe Medium-term (2–4 yr)
Glass container supply chain fragility ~20% Global Short-term (≤2 yr)
Regulatory approval timelines for new facilities ~18% Global Medium-term (2–4 yr)
Drug-product compatibility challenges ~15% Global Long-term (≥4 yr)


Capital Intensity and Long Payback Periods

A single green-field sterile filling suite can cost USD 50–80 million and take 30–36 months to commission, creating prohibitive entry barriers for smaller players in the Fill Finish Manufacturing Market [15]. Even established CDMOs must justify these investments against uncertain pipeline visibility, particularly for early-phase drug candidates that may never reach commercial scale.

Skilled Workforce Constraints

The pharmaceutical manufacturing sector faces a shortage of approximately 80,000 qualified sterile-operations technicians across North America and Europe, according to ISPE workforce surveys [16]. Training a fill-finish line operator to meet cGMP standards requires 12–18 months, and attrition rates above 15% compound the challenge for the fill-finish manufacturing market. Automation is only a partial answer, as regulatory agencies still require human oversight for batch release and environmental monitoring.

Glass Supply Chain Vulnerabilities

Type I borosilicate glass, the dominant primary packaging material for injectable drugs, relies on a concentrated supplier base with three manufacturers controlling over 65% of global production [17]. Disruptions at any single furnace can propagate delays across the Fill Finish Manufacturing Market within weeks, as demonstrated during the 2023 supply constraints that forced multiple CDMOs to shift production schedules.


Fill finish Manufacturing Market Opportunities

Modular and Mobile Fill-Finish Platforms

Prefabricated cleanroom pods, delivered as turnkey units on standard truck trailers, can reduce facility build time from 30 months to under 12 months [15]. These modular systems are gaining traction in the fill-finish manufacturing market as pandemic preparedness investments shift from theoretical to operational. The WHO's 2024 regional manufacturing initiative has earmarked USD 1.2 billion to support distributed fill-finish capacity in Africa and Southeast Asia.

Polymer Container Adoption

Cyclic olefin polymer (COP) and cyclic olefin copolymer (COC) containers eliminate breakage risk, reduce weight-related shipping costs by 30–40%, and align with pharmaceutical sustainability mandates targeting 25% plastic recyclability by 2030 [3]. The Fill Finish Manufacturing Market stands to gain as regulatory agencies in the U.S., EU, and Japan expand their acceptance of polymer primary containers for biologics.

Data Monetization Through Digital Batch Records

Electronic batch records (EBRs) and real-time line analytics generate datasets that CDMOs can monetize through technology licensing, benchmarking services, and regulatory submission consulting. Filling-line performance data is becoming a competitive asset in the Fill Finish Manufacturing Market, with leading CDMOs packaging operational intelligence as a value-added service to sponsor clients.

Emerging-Market Capacity Gaps

Africa, Latin America, and parts of Southeast Asia collectively import over 90% of their injectable drug supply. Local fill-finish capacity development — supported by WHO prequalification pathways and bilateral manufacturing agreements — presents a multi-billion-dollar growth lane for the Fill Finish Manufacturing Market.

Continuous Fill-Finish Processing

Batch-to-continuous conversion in sterile filling is moving from lab concept to pilot scale, promising 40–50% throughput gains and significant reductions in cleanroom footprint requirements. Early adopters within the Fill Finish Manufacturing Market are partnering with equipment OEMs to co-develop continuous-flow platforms for high-volume vial and syringe formats.


Fill finish Manufacturing Market Future Outlook

Autonomous and Lights-Out Filling Operations

By 2030, industry observers expect at least 15% of new fill-finish installations in the fill-finish manufacturing market to operate with minimal human intervention, leveraging robotic arms, machine-vision inspection, and closed-loop environmental controls [11]. Lights-out production will reduce contamination risk and labor costs simultaneously, though regulatory frameworks for human-free batch release remain under development.

Platform Economics and CDMO Consolidation

The CDMO sector is moving toward platform-based service models, where standardized filling-line configurations allow rapid switching between client programs. This shift will reshape competitive dynamics within the Fill Finish Manufacturing Market as scale operators acquire niche specialists to build end-to-end drug-product platforms [12].

Sustainability and Circular Packaging

ESG mandates from investors and regulators are pushing the Fill Finish Manufacturing Market toward recyclable polymer containers, reduced water and energy consumption in cleanroom operations, and carbon-neutral facility certification. The Science Based Targets initiative (SBTi) has seen 22 major pharma companies commit to scope-3 emissions reductions that directly affect packaging and fill-finish procurement decisions [22].

Continuous Manufacturing Integration

The integration of continuous upstream bioprocessing with continuous fill-finish represents the industry's long-horizon ambition. Pilot programs under FDA's Emerging Technology Program are validating continuous sterile filling for monoclonal antibodies, with the Fill Finish Manufacturing Market expected to see commercial-scale continuous lines by 2032–2034 [23].


Fill finish Manufacturing Market Segmentation

By Product Type

Segment Key Metric Primary Demand Driver
Consumables 58.2% share (2025) High-volume biologic injectable delivery
Instruments/Systems 10.2% CAGR (2026–2035) Automation and integrated line upgrades


Consumables dominate the Fill Finish Manufacturing Market because every commercial drug-product batch consumes millions of primary containers, stoppers, seals, and nested tubs. Prefilled syringes represent the highest-growth consumable subsegment, driven by patient self-administration trends in autoimmune and metabolic diseases. Instruments and systems, while smaller by absolute revenue, are growing faster as manufacturers replace semi-automated lines with fully integrated platforms featuring robotic loading, in-line inspection, and automated reject handling.

By End User

Segment Key Metric Primary Demand Driver
Pharmaceutical & Biotechnology Companies 57.3% share (2025) In-house biologic production
Contract Manufacturing Organizations 9.9% CAGR (2026–2035) Outsourcing of early-phase and commercial filling
Others USD 0.94 billion (2025) Academic, government, and specialty facilities


Pharmaceutical and biotechnology companies account for the largest slice of the Fill Finish Manufacturing Market, as top-20 biopharma firms maintain captive filling operations for their highest-revenue products. Contract manufacturing organizations, however, are capturing an increasing share of new capacity as mid-size biotech firms avoid the capital burden of building their own sterile suites.

By Container Material

Segment Key Metric Primary Demand Driver
Glass 55.4% share (2025) Established regulatory acceptance, chemical inertness
Polymer 10.2% CAGR (2026–2035) Breakage elimination, weight reduction and sustainability


Glass remains the workhorse container material in the Fill Finish Manufacturing Market due to decades of regulatory precedent and proven extractable/leachable profiles. Polymer containers are gaining ground rapidly, particularly for biologics, where protein-surface interactions with glass coatings have raised stability concerns. The transition to polymer formats is also driven by sustainability goals, as COP/COC materials are lighter, shatter-proof, and increasingly accepted by regulatory authorities worldwide.


Regional Market Share Analysis

Region Key Metric Primary Investment Themes
North America 40.2% share (2025) Biologics capacity, CDMO expansion
Europe USD 3.67 billion (2025) Annex 1 compliance, biosimilar filling
Asia-Pacific 10.6% CAGR (2026–2035) Green-field capacity, vaccine self-sufficiency
South America 5.6% share (2025) Local manufacturing mandates
Middle East & Africa USD 0.56 billion (2025) Technology transfer, WHO prequalification
Total USD 13.38 billion (2025)

The Fill Finish Manufacturing Market exhibits a clear geographic hierarchy, with North America and Europe commanding a combined share exceeding 67% in 2025. Asia-Pacific is the fastest-growing region, driven by government-backed pharmaceutical manufacturing incentives and expanding CDMO footprints.


North America

Country Key Metric Key Driver
US 78.4% of regional share Biosecure Act, FDA biologics pipeline
Canada 12.8% of regional share National Biomanufacturing Strategy
Mexico 8.8% of regional share Nearshoring and cost arbitrage


The U.S. dominates the Fill Finish Manufacturing Market in North America, with over 120 FDA-registered sterile filling facilities concentrated along the I-95 corridor and the Research Triangle [4]. The Biosecure Act has triggered a wave of reshoring activity, with at least six major CDMOs announcing new U.S. fill-finish investments totaling over USD 2.5 billion since 2024.

Europe

Country Key Metric Key Driver
Germany 8.7% CAGR (2026–2035) Precision engineering, equipment OEMs
UK USD 0.51 billion (2025) Cell therapy hub expansion
France 22.1% of regional share Sanofi and CDMO investment
Italy USD 0.38 billion (2025) Stevanato Group ecosystem
Spain 6.8% of regional share Biosimilar contract filling
Nordic Countries 5.2% of regional share Specialty biologic production
Russia USD 0.18 billion (2025) Import substitution mandates
Rest of Europe 9.3% of regional share Distributed filling capacity


Europe's fill-finish manufacturing market is shaped by the Annex 1 compliance cycle, which has created a two-tier landscape: Western European facilities investing heavily in next-generation isolators. In contrast, Eastern European sites compete on cost for standard vial-filling campaigns [9].

Asia-Pacific

Country Key Metric Key Driver
China 32.5% of regional share Domestic biologics pipeline, CDMO scale-up
India 11.4% CAGR (2026–2035) Vaccine manufacturing, WHO prequalification
Japan USD 0.58 billion (2025) High-value biologic filling, automation
South Korea 10.8% CAGR (2026–2035) Samsung Biologics, biosimilar exports
ASEAN 8.5% of regional share Distributed capacity, pandemic readiness
Rest of Asia-Pacific USD 0.14 billion (2025) Early-stage development


Asia-Pacific represents the highest-momentum region in the Fill Finish Manufacturing Market, with China's CDMO sector alone adding an estimated 25 new sterile filling lines between 2024 and 2026 [5]. India's vaccine manufacturing base — the world's largest by volume — is upgrading from legacy multi-dose vial lines to prefilled syringe platforms under the government's PLI (Production Linked Incentive) scheme worth INR 15,000 crore [19].

South America

Country Key Metric Key Driver
Brazil 62.4% of regional share Fiocruz and Butantan technology transfers
Argentina USD 0.11 billion (2025) Biosimilar filling for regional supply
Rest of South America 15.8% of regional share Early-stage capacity building


Brazil anchors the Fill Finish Manufacturing Market in South America through its established public-health manufacturing infrastructure, notably the Fiocruz Bio-Manguinhos facility in Rio de Janeiro, which expanded its sterile filling capacity by 40% in 2024 to support domestic biologic production [20].

Middle East & Africa

Country Key Metric Key Driver
Saudi Arabia 28.6% of the regional share Vision 2030 pharma manufacturing
UAE USD 0.09 billion (2025) Free-zone CDMO incentives
South Africa 22.1% of regional share mRNA vaccine technology transfer
Egypt 7.5% CAGR (2026–2035) Domestic production mandates
Rest of MEA USD 0.11 billion (2025) WHO-supported capacity development


The Fill Finish Manufacturing Market in the Middle East & Africa is nascent but accelerating, bolstered by the African Union's Partnerships for African Vaccine Manufacturing (PAVM) initiative and Saudi Arabia's National Biotechnology Strategy [21].


Fill finish Manufacturing Market By Region, 2025-2035

Competitive Benchmarking

The Fill Finish Manufacturing Market is moderately concentrated, with the top five companies projected to account for around 38-44% of the global revenue. The competitive landscape consists of three levels: integrated container-equipment OEMs, dedicated CDMO operators and component vendors. Since 2023, the M&A activity has increased as larger businesses are looking to combine end-to-end fill-finish service capabilities [24].

Company Est. Revenue Share Range Key Offerings Strategic Positioning
Becton, Dickinson and Company ~7–10% Prefilled syringes, safety systems and drug delivery devices Integrated device-container leader
Gerresheimer AG ~6–9% Glass and polymer containers, RTU formats Primary packaging innovator
SCHOTT AG ~5–8% Type I glass vials, syringes, cartridges, polymer containers Material science and container OEM
West Pharmaceutical Services ~5–8% Elastomer closures, containment systems and delivery devices Closure and containment specialist
Stevanato Group ~5–7% Glass containers, drug delivery systems and assembly lines Vertically integrated container-equipment provider
Syntegon Technology ~4–6% Filling and inspection equipment, isolator systems Equipment and process automation
IMA Group ~3–5% Filling lines, freeze-drying equipment, and packaging Integrated line solutions
Catalent (Novo Holdings) ~3–5% CDMO fill-finish services, biologics manufacturing Scale contract manufacturing
Nipro Corporation ~2–4% Glass and polymer containers, medical devices Container supply diversification
SGD Pharma ~2–4% Type I and III glass containers, molded vials Glass container specialist


Recent News & Developments

  • Stevanato Group (March 2025): Stevanato Group broke ground on its Fishers, Indiana, facility in 2021 with a $145 million investment; the site was expected to be operational starting in 2023.


  • European Commission (August 2023): Published the revised EU GMP Annex 1 implementation guidance, clarifying contamination control strategy requirements that directly affect Fill Finish Manufacturing Market facility design [9].


Fill finish Manufacturing Market Report Scope

Parameter Detail
Market Scope Fill Finish Manufacturing Market — global coverage across consumables, instruments/systems, end users, container materials, and five regions.
Study Period 2021–2035
CAGR Window 8.1%
Base Year 2025 USD 13.38 billion
2035 Forecast USD 29.15 billion
Fastest Growing Segment Instruments/Systems (10.2% CAGR); Asia-Pacific (10.6% CAGR)
Companies Profiled 10 (Becton Dickinson, Gerresheimer, SCHOTT, West Pharmaceutical, Stevanato, Syntegon, IMA, Catalent, Nipro, SGD Pharma)
Valuation Currency USD billion


FAQs

What fill speed should buyers expect from modern high-speed vial filling lines?
Current high-speed rotary vial filling systems achieve 400–600 vials per minute under full cGMP conditions. Line selection depends on batch size, product viscosity, and required changeover frequency [15].
How does the Biosecure Act affect CDMO selection for fill-finish services?
The Act restricts U.S. federal funding for drugs manufactured at certain foreign facilities, pushing sponsors toward CDMOs with U.S. or allied-nation capacity [4]. This has intensified demand for domestic fill-finish slots.
What distinguishes RABS from isolator technology for sterile filling?
RABS offers lower capital cost and faster setup, but provides less contamination protection than full isolators. Isolators deliver superior sterility assurance and are increasingly required under EU GMP Annex 1 [9].
How long does it typically take to qualify a new fill-finish line?
Qualification from installation to regulatory approval typically requires 12–18 months, encompassing IQ, OQ, PQ, and process validation campaigns [2]. Modular pre-validated systems can reduce this to 8–10 months.
What role does lyophilization play in fill-finish operations?
Lyophilization stabilizes heat-sensitive biologics by freeze-drying them within the primary container after filling. Approximately 35% of injectable biologics require lyophilization as part of their fill-finish process [6].
How are single-use systems changing fill-finish economics?
Single-use fluid paths eliminate cleaning validation, reducing changeover time by 60–70% and lowering cross-contamination risk [12]. They are most cost-effective for clinical-scale and small-batch commercial campaigns.
What insurance and liability considerations apply to contract fill-finish operations?
CDMOs typically carry product liability coverage of USD 25–100 million per occurrence, with sponsors requiring certificates of insurance and indemnification clauses in commercial supply agreements [12].    
What is the current size of the fill finish manufacturing market?
The fill finish manufacturing market reached USD 7.607 billion in 2025 and is projected to reach USD 12.3 billion by 2035.
What is the CAGR of the fill finish manufacturing market?
The fill finish manufacturing market is projected to grow at a CAGR of 4.92% during the forecast period 2025–2035.
Which region leads the fill finish manufacturing market?
North America leads the fill finish manufacturing market with over 45% share, while Asia-Pacific holds approximately 20% of the global share and is the fastest-growing region.
Author
Author
Author Profile
Rahul Gotadki LinkedIn
Research Manager
He holds an experience of about 9+ years in Market Research and Business Consulting, working under the spectrum of Life Sciences and Healthcare domains. Rahul conceptualizes and implements a scalable business strategy and provides strategic leadership to the clients. His expertise lies in market estimation, competitive intelligence, pipeline analysis, customer assessment, etc.
Co-Author
Co-Author Profile
Kinjoll Dey LinkedIn
Senior Research Analyst
He is an extremely curious individual currently working in Healthcare and Medical Devices Domain. Kinjoll is comfortably versed in data centric research backed by healthcare educational background. He leverages extensive data mining and analytics tools such as Primary and Secondary Research, Statistical Analysis, Machine Learning, Data Modelling. His key role also involves Technical Sales Support, Client Interaction and Project management within the Healthcare team. Lastly, he showcases extensive affinity towards learning new skills and remain fascinated in implementing them.
Download Free Sample

Kindly complete the form below to receive a free sample of this Report

Download PDF ×

We do not share your information with anyone. However, we may send you emails based on your report interest from time to time. You may contact us at any time to opt-out.
















