Flame Retardants Market

ID: MRFR/CnM/1866-CR
111 Pages
Chitranshi Jaiswal
Last Updated: June 22, 2026
Flame Retardants Market Research Report By Application (Building Materials, Textiles, Electronics, Automotive, Aerospace), By Type (Chlorinated, Phosphorous, Nitrogen, Inorganic, Brominated Flame Retardants), By End Use (Construction, Consumer Goods, Transportation, Electrical and Electronics), By Chemical Composition (Organic, Inorganic, Intumescent, Non-Intumescent, Halogenated) and By Regional - Forecast to 2035
Download PDF ×

We do not share your information with anyone. However, we may send you emails based on your report interest from time to time. You may contact us at any time to opt-out.

  1. 1 Market Overview |
    1. 1.1 Study Assumptions & Market Definition |
    2. 1.2 Scope of the Study |
    3. 1.3 Research Methodology
  2. 2 Market Summary & Key Takeaways
  3. 3 Market Dynamics |
    1. 3.1 Market Drivers Analysis | |
      1. 3.1.1 Tighter Building Fire Codes (IBC, EN 13501, IS 16073) | |
      2. 3.1.2 EV Battery Safety Regulations (UN R100, GB 38031) | |
      3. 3.1.3 REACH & EPA Halogenated-Substance Restrictions | |
      4. 3.1.4 5G & Data-Center Infrastructure Expansion | |
      5. 3.1.5 Urbanization & Smart-City Construction in Asia | |
      6. 3.1.6 Aerospace Composite Lightweighting Programs | |
      7. 3.1.7 Insurance Underwriter Fire-Safety Mandates |
    2. 3.2 Market Restraints Analysis | |
      1. 3.2.1 Raw-Material Price Volatility (Phosphorus, Alumina) | |
      2. 3.2.2 Nano-Toxicity and Bioaccumulation Scrutiny | |
      3. 3.2.3 Recycling Incompatibility of Flame-Retarded Polymers | |
      4. 3.2.4 High Reformulation Costs for OEMs | |
      5. 3.2.5 Substitution Lag in Price-Sensitive Developing Markets |
    3. 3.3 Market Opportunity Analysis | |
      1. 3.3.1 Closed-Loop Phosphorus Recovery | |
      2. 3.3.2 EV Thermal-Management Systems | |
      3. 3.3.3 Bio-Based Flame Retardant Chemistries | |
      4. 3.3.4 Smart-City and Modular Construction in Emerging Markets | |
      5. 3.3.5 Data Monetization through Digital Fire-Safety Compliance Platforms |
    4. 3.4 Industry Value Chain Analysis |
    5. 3.5 Porter's Five Forces Analysis
  4. 4 Global Flame Retardants Market Size & Forecast (2021–2035) |
    1. 4.1 Historical Market Size (2021–2025) |
    2. 4.2 Current & Forecast Market Size (2026–2035) |
    3. 4.3 Market Size by Revenue (USD Billion) |
    4. 4.4 Year-over-Year Growth Analysis
  5. 5 Segmentation Analysis |
    1. 5.1 By Product Type | |
      1. 5.1.1 non-halogenated | |
      2. 5.1.2 Halogenated |
    2. 5.2 By Application | |
      1. 5.2.1 Polyolefins | |
      2. 5.2.2 PVC | |
      3. 5.2.3 Epoxy Resins | |
      4. 5.2.4 Other Applications (Polyurethane, Engineering Plastics) |
    3. 5.3 By End-User Industry | |
      1. 5.3.1 Building & Construction | |
      2. 5.3.2 Electrical & Electronics | |
      3. 5.3.3 Transportation | |
      4. 5.3.4 Textiles & Furniture
  6. 6 Regional Analysis |
    1. 6.1 North America | |
      1. 6.1.1 United States | |
      2. 6.1.2 Canada | |
      3. 6.1.3 Mexico |
    2. 6.2 Europe | |
      1. 6.2.1 Germany | |
      2. 6.2.2 United Kingdom | |
      3. 6.2.3 France | |
      4. 6.2.4 Italy | |
      5. 6.2.5 Spain | |
      6. 6.2.6 Nordic Countries | |
      7. 6.2.7 Russia | |
      8. 6.2.8 Rest of Europe |
    3. 6.3 Asia-Pacific | |
      1. 6.3.1 China | |
      2. 6.3.2 India | |
      3. 6.3.3 Japan | |
      4. 6.3.4 South Korea | |
      5. 6.3.5 ASEAN | |
      6. 6.3.6 Rest of Asia-Pacific |
    4. 6.4 South America | |
      1. 6.4.1 Brazil | |
      2. 6.4.2 Argentina | |
      3. 6.4.3 Rest of South America |
    5. 6.5 Middle East & Africa | |
      1. 6.5.1 Saudi Arabia | |
      2. 6.5.2 UAE | |
      3. 6.5.3 South Africa | |
      4. 6.5.4 Egypt | |
      5. 6.5.5 Rest of MEA
  7. 7 Competitive Landscape |
    1. 7.1 Market Share Analysis (2025) |
    2. 7.2 Competitive Benchmarking Matrix |
    3. 7.3 Company Profiles | |
      1. 7.3.1 Albemarle Corporation | |
      2. 7.3.2 ICL Group | |
      3. 7.3.3 Lanxess AG | |
      4. 7.3.4 BASF SE | |
      5. 7.3.5 Clariant AG | |
      6. 7.3.6 Huber Engineered Materials | |
      7. 7.3.7 Nabaltec AG | |
      8. 7.3.8 Italmatch Chemicals | |
      9. 7.3.9 Dow Inc. | |
      10. 7.3.10 Thor Group
  8. 8 Future Outlook & Strategic Recommendations (2026–2035) |
    1. 8.1 AI-Driven Formulation and Digital Twins |
    2. 8.2 Electrification Supercycle |
    3. 8.3 ESG Reporting and Product Stewardship |
    4. 8.4 Circular Chemistry and Feedstock Security
  9. 9 Recent Developments & News
  10. 10 Frequently Asked Questions (FAQs)
  11. 11 Report Scope & Methodology |
    1. 11.1 Study Period & Base Year |
    2. 11.2 Data Sources & Citations |
    3. 11.3 Abbreviations
  12. 12 LIST OF TABLES |
  13. TABLE 1 Global Flame Retardants Market Size & Forecast, by Revenue (USD Billion), 2021–2035 |
  14. TABLE 2 Global Flame Retardants Market — Year-over-Year Growth Analysis, 2021–2035 |
  15. TABLE 3 Global Flame Retardants Market — Driver Impact Analysis, 2026–2035 |
  16. TABLE 4 Global Flame Retardants Market — Restraint Impact Analysis, 2026–2035 |
  17. TABLE 5 Global Flame Retardants Market Size, by Product Type, 2021–2035 (USD Billion) |
  18. TABLE 6 Global Flame Retardants Market Size, by Application, 2021–2035 (USD Billion) |
  19. TABLE 7 Global Flame Retardants Market Size, by End-User Industry, 2021–2035 (USD Billion) |
  20. TABLE 8 Global Flame Retardants Market Size, by Region, 2021–2035 (USD Billion) |
  21. TABLE 9 North America Flame Retardants Market Size, by Country, 2021–2035 (USD Billion) |
  22. TABLE 10 Europe Flame Retardants Market Size, by Country, 2021–2035 (USD Billion) |
  23. TABLE 11 Asia-Pacific Flame Retardants Market Size, by Country, 2021–2035 (USD Billion) |
  24. TABLE 12 South America Flame Retardants Market Size, by Country, 2021–2035 (USD Billion) |
  25. TABLE 13 Middle East & Africa Flame Retardants Market Size, by Country, 2021–2035 (USD Billion) |
  26. TABLE 14 Competitive Benchmarking Matrix — Global Flame Retardants Market, 2025 |
  27. TABLE 15 Company Profiles — Key Players, Global Flame Retardants Market |
  28. TABLE 16 Recent Developments & Strategic Announcements, 2023–2025 |
  29. TABLE 17 Report Scope & Methodology Summary |
  30. TABLE 18 Detailed Sources and Citations |
  31. TABLE 19 North America Flame Retardants Market Size, by Product Type, 2021–2035 (USD Billion) |
  32. TABLE 20 North America Flame Retardants Market Size, by Application, 2021–2035 (USD Billion) |
  33. TABLE 21 North America Flame Retardants Market Size, by End-User Industry, 2021–2035 (USD Billion) |
  34. TABLE 22 Europe Flame Retardants Market Size, by Product Type, 2021–2035 (USD Billion) |
  35. TABLE 23 Europe Flame Retardants Market Size, by Application, 2021–2035 (USD Billion) |
  36. TABLE 24 Europe Flame Retardants Market Size, by End-User Industry, 2021–2035 (USD Billion) |
  37. TABLE 25 Asia-Pacific Flame Retardants Market Size, by Product Type, 2021–2035 (USD Billion) |
  38. TABLE 26 Asia-Pacific Flame Retardants Market Size, by Application, 2021–2035 (USD Billion) |
  39. TABLE 27 Asia-Pacific Flame Retardants Market Size, by End-User Industry, 2021–2035 (USD Billion) |
  40. TABLE 28 South America Flame Retardants Market Size, by Product Type, 2021–2035 (USD Billion) |
  41. TABLE 29 South America Flame Retardants Market Size, by Application, 2021–2035 (USD Billion) |
  42. TABLE 30 South America Flame Retardants Market Size, by End-User Industry, 2021–2035 (USD Billion) |
  43. TABLE 31 Middle East & Africa Flame Retardants Market Size, by Product Type, 2021–2035 (USD Billion) |
  44. TABLE 32 Middle East & Africa Flame Retardants Market Size, by Application, 2021–2035 (USD Billion) |
  45. TABLE 33 Middle East & Africa Flame Retardants Market Size, by End-User Industry, 2021–2035 (USD Billion) |
  46. TABLE 34 United States Flame Retardants Market Size, by Product Type, 2021–2035 (USD Billion) |
  47. TABLE 35 United States Flame Retardants Market Size, by Application, 2021–2035 (USD Billion) |
  48. TABLE 36 United States Flame Retardants Market Size, by End-User Industry, 2021–2035 (USD Billion) |
  49. TABLE 37 Canada Flame Retardants Market Size, by Product Type, 2021–2035 (USD Billion) |
  50. TABLE 38 Canada Flame Retardants Market Size, by Application, 2021–2035 (USD Billion) |
  51. TABLE 39 Canada Flame Retardants Market Size, by End-User Industry, 2021–2035 (USD Billion) |
  52. TABLE 40 Mexico Flame Retardants Market Size, by Product Type, 2021–2035 (USD Billion) |
  53. TABLE 41 Mexico Flame Retardants Market Size, by Application, 2021–2035 (USD Billion) |
  54. TABLE 42 Mexico Flame Retardants Market Size, by End-User Industry, 2021–2035 (USD Billion) |
  55. TABLE 43 Germany Flame Retardants Market Size, by Product Type, 2021–2035 (USD Billion) |
  56. TABLE 44 Germany Flame Retardants Market Size, by Application, 2021–2035 (USD Billion) |
  57. TABLE 45 Germany Flame Retardants Market Size, by End-User Industry, 2021–2035 (USD Billion) |
  58. TABLE 46 United Kingdom Flame Retardants Market Size, by Product Type, 2021–2035 (USD Billion) |
  59. TABLE 47 United Kingdom Flame Retardants Market Size, by Application, 2021–2035 (USD Billion) |
  60. TABLE 48 United Kingdom Flame Retardants Market Size, by End-User Industry, 2021–2035 (USD Billion) |
  61. TABLE 49 France Flame Retardants Market Size, by Product Type, 2021–2035 (USD Billion) |
  62. TABLE 50 France Flame Retardants Market Size, by Application, 2021–2035 (USD Billion) |
  63. TABLE 51 France Flame Retardants Market Size, by End-User Industry, 2021–2035 (USD Billion) |
  64. TABLE 52 Italy Flame Retardants Market Size, by Product Type, 2021–2035 (USD Billion) |
  65. TABLE 53 Italy Flame Retardants Market Size, by Application, 2021–2035 (USD Billion) |
  66. TABLE 54 Italy Flame Retardants Market Size, by End-User Industry, 2021–2035 (USD Billion) |
  67. TABLE 55 Spain Flame Retardants Market Size, by Product Type, 2021–2035 (USD Billion) |
  68. TABLE 56 Spain Flame Retardants Market Size, by Application, 2021–2035 (USD Billion) |
  69. TABLE 57 Spain Flame Retardants Market Size, by End-User Industry, 2021–2035 (USD Billion) |
  70. TABLE 58 Nordic Countries Flame Retardants Market Size, by Product Type, 2021–2035 (USD Billion) |
  71. TABLE 59 Nordic Countries Flame Retardants Market Size, by Application, 2021–2035 (USD Billion) |
  72. TABLE 60 Nordic Countries Flame Retardants Market Size, by End-User Industry, 2021–2035 (USD Billion) |
  73. TABLE 61 Russia Flame Retardants Market Size, by Product Type, 2021–2035 (USD Billion) |
  74. TABLE 62 Russia Flame Retardants Market Size, by Application, 2021–2035 (USD Billion) |
  75. TABLE 63 Russia Flame Retardants Market Size, by End-User Industry, 2021–2035 (USD Billion) |
  76. TABLE 64 China Flame Retardants Market Size, by Product Type, 2021–2035 (USD Billion) |
  77. TABLE 65 China Flame Retardants Market Size, by Application, 2021–2035 (USD Billion) |
  78. TABLE 66 China Flame Retardants Market Size, by End-User Industry, 2021–2035 (USD Billion) |
  79. TABLE 67 India Flame Retardants Market Size, by Product Type, 2021–2035 (USD Billion) |
  80. TABLE 68 India Flame Retardants Market Size, by Application, 2021–2035 (USD Billion) |
  81. TABLE 69 India Flame Retardants Market Size, by End-User Industry, 2021–2035 (USD Billion) |
  82. TABLE 70 Japan Flame Retardants Market Size, by Product Type, 2021–2035 (USD Billion) |
  83. TABLE 71 Japan Flame Retardants Market Size, by Application, 2021–2035 (USD Billion) |
  84. TABLE 72 Japan Flame Retardants Market Size, by End-User Industry, 2021–2035 (USD Billion) |
  85. TABLE 73 South Korea Flame Retardants Market Size, by Product Type, 2021–2035 (USD Billion) |
  86. TABLE 74 South Korea Flame Retardants Market Size, by Application, 2021–2035 (USD Billion) |
  87. TABLE 75 South Korea Flame Retardants Market Size, by End-User Industry, 2021–2035 (USD Billion) |
  88. TABLE 76 ASEAN Flame Retardants Market Size, by Product Type, 2021–2035 (USD Billion) |
  89. TABLE 77 ASEAN Flame Retardants Market Size, by Application, 2021–2035 (USD Billion) |
  90. TABLE 78 ASEAN Flame Retardants Market Size, by End-User Industry, 2021–2035 (USD Billion) |
  91. TABLE 79 Brazil Flame Retardants Market Size, by Product Type, 2021–2035 (USD Billion) |
  92. TABLE 80 Brazil Flame Retardants Market Size, by Application, 2021–2035 (USD Billion) |
  93. TABLE 81 Brazil Flame Retardants Market Size, by End-User Industry, 2021–2035 (USD Billion) |
  94. TABLE 82 Argentina Flame Retardants Market Size, by Product Type, 2021–2035 (USD Billion) |
  95. TABLE 83 Argentina Flame Retardants Market Size, by Application, 2021–2035 (USD Billion) |
  96. TABLE 84 Argentina Flame Retardants Market Size, by End-User Industry, 2021–2035 (USD Billion) |
  97. TABLE 85 Saudi Arabia Flame Retardants Market Size, by Product Type, 2021–2035 (USD Billion) |
  98. TABLE 86 Saudi Arabia Flame Retardants Market Size, by Application, 2021–2035 (USD Billion) |
  99. TABLE 87 Saudi Arabia Flame Retardants Market Size, by End-User Industry, 2021–2035 (USD Billion) |
  100. TABLE 88 UAE Flame Retardants Market Size, by Product Type, 2021–2035 (USD Billion) |
  101. TABLE 89 UAE Flame Retardants Market Size, by Application, 2021–2035 (USD Billion) |
  102. TABLE 90 UAE Flame Retardants Market Size, by End-User Industry, 2021–2035 (USD Billion) |
  103. TABLE 91 South Africa Flame Retardants Market Size, by Product Type, 2021–2035 (USD Billion) |
  104. TABLE 92 South Africa Flame Retardants Market Size, by Application, 2021–2035 (USD Billion) |
  105. TABLE 93 South Africa Flame Retardants Market Size, by End-User Industry, 2021–2035 (USD Billion) |
  106. TABLE 94 Egypt Flame Retardants Market Size, by Product Type, 2021–2035 (USD Billion) |
  107. TABLE 95 Egypt Flame Retardants Market Size, by Application, 2021–2035 (USD Billion) |
  108. TABLE 96 Egypt Flame Retardants Market Size, by End-User Industry, 2021–2035 (USD Billion)
  109. 13 LIST OF FIGURES |
  110. FIGURE 1 Global Flame Retardants Market Dynamics — Drivers, Restraints, Opportunities |
  111. FIGURE 2 Industry Value Chain Analysis — Flame Retardants Market |
  112. FIGURE 3 Porter's Five Forces Analysis — Flame Retardants Market |
  113. FIGURE 4 Global Flame Retardants Market Size Trend & Forecast (USD Billion), 2021–2035 |
  114. FIGURE 5 Global Flame Retardants Market Share, by Product Type, 2025 (%) |
  115. FIGURE 6 Global Flame Retardants Market Share, by Application, 2025 (%) |
  116. FIGURE 7 Global Flame Retardants Market Share, by End-User Industry, 2025 (%) |
  117. FIGURE 8 Global Flame Retardants Market Share, by region, 2025 (%) |
  118. FIGURE 9 North America Flame Retardants Market Size Trend & Forecast (USD Billion), 2021–2035 |
  119. FIGURE 10 Europe Flame Retardants Market Size Trend & Forecast (USD Billion), 2021–2035 |
  120. FIGURE 11 Asia-Pacific Flame Retardants Market Size Trend & Forecast (USD Billion), 2021–2035 |
  121. FIGURE 12 South America Flame Retardants Market Size Trend & Forecast (USD Billion), 2021–2035 |
  122. FIGURE 13 Middle East & Africa Flame Retardants Market Size Trend & Forecast (USD Billion), 2021–2035 |
  123. FIGURE 14 Competitive Landscape — Market Share Breakdown, Flame Retardants Market, 2025

Segmentation Quick Reference

DimensionSub-SegmentsDominant SegmentFastest Growing Segment
By Product TypeNon-Halogenated, HalogenatedNon-Halogenated (69.6% share, 2025)Non-Halogenated (CAGR 5.56%)
By ApplicationPolyolefins, PVC, Epoxy Resins, Other ApplicationsPolyolefins (USD 3.88B, 2025)Epoxy Resins (CAGR 5.48%)
By End-User IndustryBuilding & Construction, Electrical & Electronics, Transportation, Textiles & FurnitureBuilding & Construction (37.0% share, 2025)Electrical & Electronics (CAGR 5.66%)
By GeographyAsia-Pacific, Europe, North America, South America, Middle East & AfricaAsia-Pacific (47.1% share, 2025)Asia-Pacific (CAGR 6.09%)


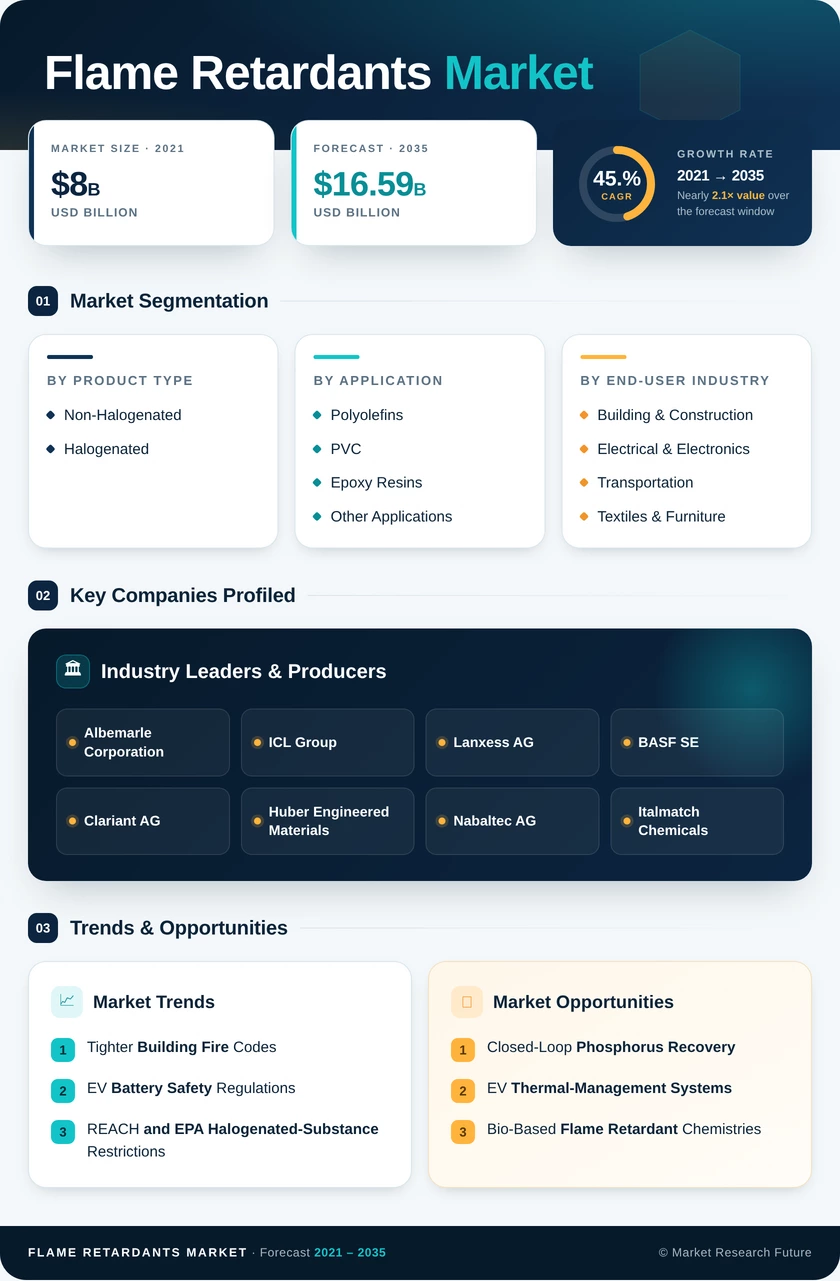
Market Segmentation Overview

By Product Type

Sub-SegmentKey Trend
Non-HalogenatedRegulatory mandates driving substitution from brominated and chlorinated systems; ATH and phosphorus-based chemistries dominate
HalogenatedRetained in cost-sensitive commodity polymer applications facing phase-out pressure in the EU and select US states.


Non-halogenated flame retardants encompass a broad chemistry portfolio — aluminum hydroxide, magnesium hydroxide, phosphorus esters, melamine derivatives, and nitrogen synergists. Regulatory restrictions on halogenated compounds continue to shift procurement patterns across all major end-user industries, making this the structurally faster-growing product-type segment through 2035.

By Application

Sub-SegmentKey Trend
PolyolefinsHigh mineral-filler loadings for cable insulation and automotive wire harnesses drive the largest volume base.
PVCStable demand in construction piping, flooring, and flexible films
Epoxy ResinsRapid expansion in 5G PCB laminates and aerospace composite prepregs
Other ApplicationsIncludes polyurethane foam insulation, engineering thermoplastics, and elastomers


Polyolefin applications consume the highest tonnage of flame retardants due to the sheer volume of polyethylene and polypropylene processed globally for wire-and-cable and packaging end uses. Epoxy resins, while smaller in volume terms, represent the highest-growth application driven by electronics miniaturization and advanced composite adoption.

By End-User Industry

Sub-SegmentKey Trend
Building & ConstructionCode-driven demand for flame-retardant insulation, cladding, and cable management systems
Electrical & Electronics5G infrastructure, data centers, and EV power electronics drive premium-grade additive demand
TransportationAutomotive lightweighting composites and EV battery enclosures expand the addressable market.
Textiles & FurnitureContract-furnishing fire codes and personal protective equipment standards to sustain demand.


Building and construction remains the largest end-user segment, supported by global infrastructure spending and post-disaster fire-code tightening. Electrical and electronics are positioned for the strongest growth trajectory as digitalization and electrification accelerate demand for high-performance, UL-certified additive systems across the forecast period.

By Geography

Sub-SegmentKey Trend
Asia-PacificManufacturing density, infrastructure of mega-projects, and EV production underpin the dominant position.
EuropeStrictest regulatory environment globally; CPR and REACH drive non-halogenated adoption
North AmericaData-center construction boom and IBC code cycles support steady growth.
South AmericaSocial housing programs and industrial expansion create emerging demand.
Middle East & AfricaVision 2030 mega-projects and urbanization open new market corridors


Asia-Pacific commands nearly half of global flame-retardant consumption, led by China's enormous polymer-processing base and India's accelerating industrialization. Europe and North America remain in high-value markets where regulatory complexity drives product premiums and innovation investment across the value chain.