Food and Beverage MRO Services Market

Food and Beverage MRO Services Market Size, Share and Trends Analysis Research Report Information By End Use (Food Processing, Beverage Production, Packaging, Logistics), By Application (Maintenance, Repair, Overhaul, Installation), By Service Type (Preventive, Corrective, Predictive, Emergency), By Customer Type (Manufacturers, Distributors, Retailers, Food Service Providers), By Equipment Type (Refrigeration, Heating, Conveyor, Mixing), And By Region – Market Forecast Till 2035.

Forecast Period
2025 - 2035
CAGR
4.31%
2024 Market Size
$ 22 Billion
2035 Market Size
$ 35 Billion
MRO ● Updated April 7, 2026 Report ID: MRFR/MRO/64991-HCR | Pages: 200 | Author: Shubham Munde

Food and Beverage MRO Services Market Summary

As per MRFR analysis, the Food and Beverage MRO services Market was estimated at 22.0 USD Billion in 2024. The Food and Beverage MRO services industry is projected to grow from 22.95 USD Billion in 2025 to 35.0 USD Billion by 2035, exhibiting a compound annual growth rate (CAGR) of 4.31% during the forecast period 2025 - 2035.

Key Market Trends & Highlights

The Food and Beverage MRO services market is experiencing a dynamic shift towards technological integration and sustainability.

  • Technological integration is reshaping maintenance practices, enhancing efficiency and reliability in operations.
  • A growing emphasis on sustainability is driving companies to adopt eco-friendly practices in their MRO services.
  • Customization of services is becoming increasingly important, allowing businesses to tailor solutions to their specific needs.
  • Rising demand for food safety compliance and technological advancements in equipment are key drivers propelling market growth.

Market Size & Forecast

2024 Market Size 22.0 (USD Billion)
2035 Market Size 35.0 (USD Billion)
CAGR (2025 - 2035) 4.31%

Major Players

Ecolab (US), Diversey Holdings, Ltd. (US), Parker Hannifin Corporation (US), ITW (US), Brady Corporation (US), Hygiena, LLC (US), 3M Company (US), Danfoss A/S (DK), Karcher (DE)

Our Impact

Enabled $4.3B Revenue Impact for Fortune 500 and Leading Multinationals

Partnering with 2000+ Global Organizations Each Year

30K+ Citations by Top-Tier Firms in the Industry

Food and Beverage MRO Services Market Drivers

Sustainability Initiatives

Sustainability initiatives are becoming a cornerstone of the Food and Beverage MRO services Market. As environmental concerns gain prominence, companies are increasingly seeking MRO services that align with sustainable practices. This includes the use of eco-friendly materials and energy-efficient technologies in maintenance and repair operations. The market for sustainable MRO services is projected to grow by 8% over the next five years, driven by the need for companies to reduce their carbon footprint. MRO service providers are responding by developing green solutions that not only meet regulatory requirements but also appeal to environmentally conscious consumers, thereby enhancing their competitive edge.

Focus on Operational Efficiency

The relentless pursuit of operational efficiency is a critical driver for the Food and Beverage MRO services Market. Companies are increasingly recognizing that effective maintenance and repair strategies can lead to significant cost savings and improved productivity. By optimizing their MRO processes, businesses can minimize equipment downtime and enhance production capabilities. This focus on efficiency is reflected in the market, where the operational efficiency segment is anticipated to grow by 7% annually. As a result, MRO service providers are innovating their service offerings to include predictive maintenance and real-time monitoring solutions, which further propels the demand for their services.

Customization of Maintenance Solutions

The demand for customized maintenance solutions is a significant driver in the Food and Beverage MRO services Market. As businesses face unique operational challenges, the need for tailored MRO services that address specific requirements becomes increasingly apparent. This trend is evident in the growing preference for service providers that offer flexible and adaptable maintenance plans. The customization segment of the MRO market is expected to expand by 5% annually, as companies seek to optimize their maintenance strategies. By providing bespoke solutions, MRO service providers can enhance customer satisfaction and loyalty, ultimately driving growth in this competitive landscape.

Technological Advancements in Equipment

Technological advancements in food processing and packaging equipment are significantly influencing the Food and Beverage MRO services Market. The integration of smart technologies, such as IoT and AI, into machinery enhances operational efficiency and reduces downtime. As companies increasingly adopt these technologies, the need for specialized MRO services that can maintain and repair advanced equipment becomes paramount. The market for smart food processing equipment is expected to reach USD 15 billion by 2026, indicating a robust demand for MRO services that can support these innovations. This trend not only drives growth in the MRO sector but also encourages service providers to develop expertise in handling sophisticated machinery.

Rising Demand for Food Safety Compliance

The increasing emphasis on food safety regulations is a pivotal driver for the Food and Beverage MRO services Market. As consumers become more health-conscious, the demand for compliance with safety standards intensifies. Regulatory bodies enforce stringent guidelines, compelling food and beverage companies to invest in maintenance, repair, and operations services that ensure adherence to these standards. This trend is reflected in the market, where the food safety compliance segment is projected to grow at a compound annual growth rate of 6.5% over the next five years. Consequently, MRO service providers are adapting their offerings to meet these regulatory requirements, thereby enhancing their market presence and driving growth.

Market Segment Insights

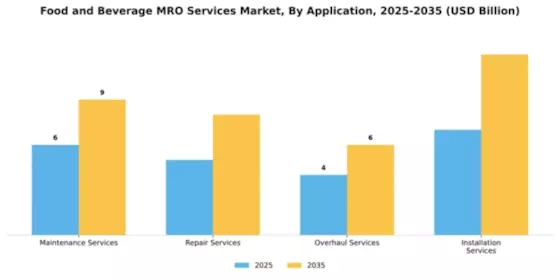
By Application: Maintenance Services (Largest) vs. Overhaul Services (Fastest-Growing)

In the Food and Beverage MRO services market, maintenance services hold the largest share among various application segments. This segment's dominance can be attributed to the critical need for regular upkeep of equipment, which ensures smooth operations and compliance with safety regulations. Repair services also play a significant role, providing essential support to maintain equipment efficiency. Meanwhile, installation services have a smaller share but remain vital for new equipment integration across manufacturing facilities.
Food and Beverage MRO Services Market Segment Image 0

Maintenance Services (Dominant) vs. Installation Services (Emerging)

Maintenance services are recognized as the dominant force within the Food and Beverage MRO services market, primarily due to their role in preventing downtime and ensuring operational continuity. Regular maintenance helps avoid costly repairs and maintains the integrity of food safety standards. On the other hand, installation services are emerging as critical components of the industry, particularly as new technologies are adopted in food production. As facilities modernize, the demand for qualified installation services is growing, creating opportunities for specialists who can efficiently integrate advanced systems into existing production lines.
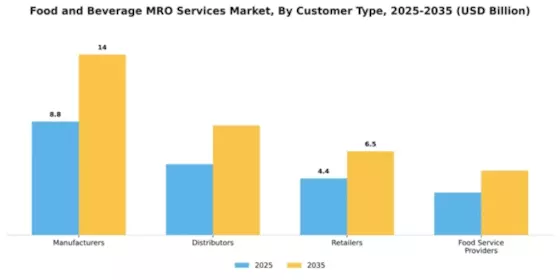
By End Use: Food Processing (Largest) vs. Beverage Production (Fastest-Growing)

Food and Beverage MRO Services Market Segment Image 1

In the Food and Beverage MRO services Market, the market share distribution among key end-use segments reveals significant dynamics. Food Processing remains the largest segment, accounting for a substantial portion of the overall market. Its established infrastructure and continuous demand for maintenance ensure a steady share. Conversely, Beverage Production is emerging as the fastest-growing segment, propelled by rising consumer preferences for innovative beverages and advancements in production technologies. This growth is indicative of shifting market trends towards varied beverage offerings and consumer-driven customization.

Food Processing (Dominant) vs. Beverage Production (Emerging)

Food Processing, as the dominant segment in the Food and Beverage MRO services Market, is characterized by consistent demand fueled by the perennial need for efficient production methods and maintenance of machinery. This segment thrives on long-standing relationships between manufacturers and service providers who supply technical support and parts to ensure seamless operations. On the other hand, Beverage Production is an emerging segment marked by rapid innovation and diverse product offerings. Its growth is driven by trends such as health-conscious consumerism and the shift towards automated production lines. Both segments are vital for sustaining the food and beverage supply chain, but their characteristics indicate different market strategies and customer engagement approaches.

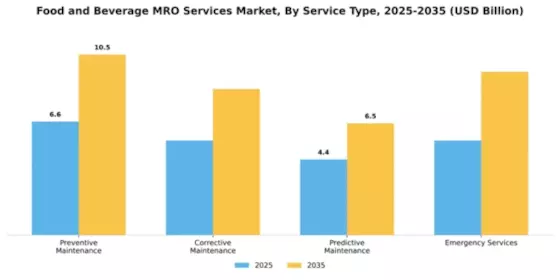
By Service Type: Preventive Maintenance (Largest) vs. Emergency Services (Fastest-Growing)

In the Food and Beverage MRO services market, 'Preventive Maintenance' constitutes the largest segment, commanding a significant share due to its essential role in reducing downtime and prolonging equipment life. This proactive approach is essential for ensuring compliance with health and safety regulations, making it a popular choice for many businesses. On the other hand, 'Emergency Services' represents the fastest-growing segment, driven by the increasing need for immediate repairs and quick responses to equipment failures, which can severely impact production schedules.
Food and Beverage MRO Services Market Segment Image 2

Preventive Maintenance (Dominant) vs. Emergency Services (Emerging)

Preventive Maintenance plays a dominant role in the Food and Beverage MRO services sector as businesses prioritize routine checks to avoid unexpected downtimes. This segment encompasses scheduled inspections, regular adjustments, and replacements of wear-and-tear parts to ensure consistent equipment performance. In contrast, Emergency Services, classified as an emerging segment, is gaining traction due to the unpredictable nature of equipment failures in food production environments. Companies are increasingly investing in rapid-response teams and support services to minimize operational disruptions, highlighting the critical need for agility in maintenance services.
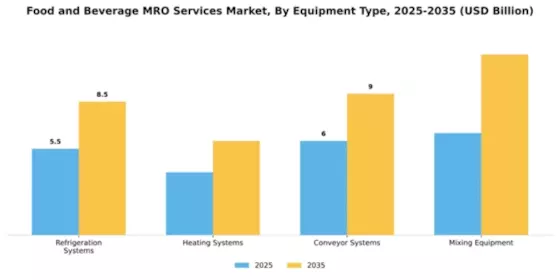
By Equipment Type: Refrigeration Systems (Largest) vs. Heating Systems (Fastest-Growing)

Food and Beverage MRO Services Market Segment Image 3

The Food and Beverage MRO services market segment of Equipment Type exhibits a structured distribution, with Refrigeration Systems currently holding the largest market share due to their critical role in preserving perishable goods. Heating Systems, while not as prominent in terms of overall share, are rapidly gaining traction as food safety regulations increase the demand for equipment that can maintain optimal food temperatures during preparation and storage. Both segments are essential, yet their market dynamics reveal varying levels of influence and growth opportunities in the industry. The growth trajectory of these segments is influenced by several key trends. The expanding food processing and distribution networks amplify the need for effective refrigeration to ensure product quality. In contrast, the heightened emphasis on compliance with health standards fuels the adoption of Heating Systems. Investment in energy-efficient and innovative solutions is also propelling the growth of these segments, with businesses increasingly seeking to upgrade their equipment for better sustainability and operational efficiency.

Refrigeration Systems (Dominant) vs. Mixing Equipment (Emerging)

Refrigeration Systems are a dominant force in the Food and Beverage MRO services market, primarily due to their indispensable role in food preservation and quality maintenance. Their robust demand stems from stringent food safety regulations and the increasing reliance on cold supply chains in the industry. In contrast, Mixing Equipment is emerging as a significant player, with its importance rising as food brands pursue varied product offerings and customized formulations. Innovations in Mixing Technology, such as automated systems and precision blending, are gaining traction, particularly among manufacturers focusing on efficiency and consistency. While Refrigeration Systems remain essential for safety and compliance, Mixing Equipment is carving out its niche, presenting opportunities for growth and diversification in the market.

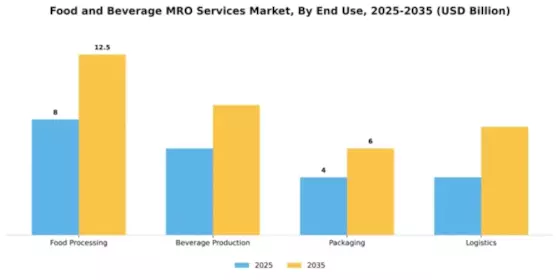
By Customer Type: Manufacturers (Largest) vs. Retailers (Fastest-Growing)

In the Food and Beverage MRO services Market, the customer type segment is critical, with manufacturers holding the largest market share. They are the backbone of production and heavily rely on maintenance, repair, and operational services to ensure efficiency and compliance with safety standards. Retailers, while smaller in market share, are growing rapidly as they adapt to consumer trends and demand for convenience. This shift is driven by the need to maintain a constant supply of fresh food and beverages, particularly in a competitive landscape, pushing retailers to invest more in MRO services.
Food and Beverage MRO Services Market Segment Image 4

Manufacturers (Dominant) vs. Food Service Providers (Emerging)

Manufacturers represent the dominant force in the Food and Beverage MRO services Market, leveraging advanced maintenance systems to optimize production efficiency. They rely on robust supply chains and integrated service solutions to minimize downtime. Conversely, food service providers are an emerging segment, fueled by the expanding trends in dining out and the increasing sophistication of culinary needs. As they seek to enhance operational excellence, food service providers are investing in MRO services to ensure that kitchen equipment operates smoothly and meets regulatory standards.

Get more detailed insights about Food and Beverage MRO Services Market Request Free Sample

Regional Insights

North America : Market Leader in MRO Services

North America is poised to maintain its leadership in the Food and Beverage MRO services market, holding a significant market share of 10.5 in 2024. Key growth drivers include stringent food safety regulations, increasing demand for automation, and a focus on sustainability. The region's robust infrastructure and technological advancements further enhance its market position, making it a hub for innovation in MRO services. The competitive landscape is characterized by major players such as Ecolab, Diversey Holdings, and ITW, which dominate the market with their comprehensive service offerings. The U.S. leads the region, supported by a strong regulatory framework that emphasizes hygiene and safety standards. This competitive environment fosters continuous improvement and innovation, ensuring that North America remains at the forefront of the Food and Beverage MRO services market.

Europe : Emerging Market with Growth Potential

Europe's Food and Beverage MRO services market is valued at 6.5, reflecting a growing demand driven by increasing consumer awareness regarding food safety and quality. Regulatory frameworks, such as the EU Food Safety Regulation, play a crucial role in shaping market dynamics, encouraging companies to invest in MRO services to comply with stringent standards. The region is also witnessing a shift towards sustainable practices, further propelling market growth. Leading countries in this region include Germany, France, and the UK, where key players like Danfoss and Karcher are making significant strides. The competitive landscape is marked by a mix of established firms and emerging players, all vying for market share. The presence of innovative technologies and a focus on customer-centric solutions are key factors that enhance the region's attractiveness in the Food and Beverage MRO services market.

Asia-Pacific : Rapidly Growing Market Segment

The Asia-Pacific region, with a market size of 4.5, is rapidly emerging as a significant player in the Food and Beverage MRO services market. The growth is fueled by rising disposable incomes, urbanization, and an increasing focus on food safety standards. Governments are implementing regulations to enhance food quality, which is driving demand for MRO services across the region. The market is expected to witness substantial growth as these trends continue to evolve. Countries like China, India, and Japan are leading the charge, with a competitive landscape that includes both local and international players. Companies are increasingly investing in advanced technologies to improve service efficiency and meet the growing demands of the food and beverage sector. The presence of key players such as 3M and Hygiena further strengthens the region's market position, making it a focal point for MRO services in the food industry.

Middle East and Africa : Untapped Market Opportunities

The Middle East and Africa region, with a market size of 0.5, presents untapped opportunities in the Food and Beverage MRO services market. The growth is driven by increasing investments in the food processing industry and a rising awareness of food safety standards. Governments are beginning to implement regulations that promote hygiene and quality, which is expected to catalyze demand for MRO services in the coming years. Countries such as South Africa and the UAE are at the forefront of this emerging market, with a competitive landscape that is gradually evolving. While the presence of key players is still developing, there is significant potential for growth as local companies begin to adopt advanced MRO solutions. The region's unique challenges and opportunities make it a compelling area for investment in food and beverage MRO services.

Key Players and Competitive Insights

The Food and Beverage MRO services Market is characterized by a dynamic competitive landscape, driven by the increasing demand for operational efficiency and sustainability. Key players such as Ecolab (US), Diversey Holdings, Ltd. (US), and 3M Company (US) are at the forefront, each adopting distinct strategies to enhance their market positioning. Ecolab (US) focuses on innovation in water and energy management solutions, while Diversey Holdings, Ltd. (US) emphasizes digital transformation through smart cleaning technologies. Meanwhile, 3M Company (US) leverages its extensive product portfolio to cater to diverse customer needs, indicating a trend towards comprehensive service offerings that enhance operational reliability.The market structure appears moderately fragmented, with numerous players competing for market share. Key tactics employed by these companies include localizing manufacturing to reduce lead times and optimizing supply chains to enhance responsiveness. This collective approach not only strengthens their competitive edge but also fosters a collaborative environment where innovation can thrive, ultimately benefiting end-users in the food and beverage sector.In November Ecolab (US) announced a strategic partnership with a leading food processing company to implement advanced water treatment solutions aimed at reducing water usage by 30%. This initiative underscores Ecolab's commitment to sustainability and positions it as a leader in eco-friendly practices within the MRO services sector. The partnership is likely to enhance Ecolab's reputation and expand its market reach, aligning with the growing emphasis on environmental responsibility.In October Diversey Holdings, Ltd. (US) launched a new line of smart cleaning products that utilize IoT technology to monitor cleaning processes in real-time. This innovation not only improves operational efficiency but also provides clients with actionable insights, thereby enhancing service quality. The introduction of these products reflects Diversey's strategic focus on digitalization, which is becoming increasingly vital in the competitive landscape.In September 3M Company (US) expanded its product offerings by acquiring a niche player specializing in food safety solutions. This acquisition is expected to bolster 3M's capabilities in the food and beverage sector, allowing it to provide a more comprehensive suite of services. The move indicates a strategic shift towards enhancing product diversity and addressing the evolving needs of customers in a competitive market.As of December the competitive trends in the Food and Beverage MRO services Market are increasingly defined by digitalization, sustainability, and the integration of AI technologies. Strategic alliances are becoming more prevalent, enabling companies to pool resources and expertise to drive innovation. The competitive differentiation is likely to evolve from traditional price-based competition to a focus on technological advancements, innovative solutions, and reliable supply chains, suggesting a transformative shift in how companies engage with their customers.

Key Companies in the Food and Beverage MRO Services Market include

Future Outlook

Food and Beverage MRO Services Market Future Outlook

The Food and Beverage MRO services Market is projected to grow at a 4.31% CAGR from 2025 to 2035, driven by technological advancements, sustainability initiatives, and increasing demand for efficiency.

New opportunities lie in:

  • Integration of IoT for predictive maintenance solutions. Development of eco-friendly cleaning and sanitization products. Expansion of remote monitoring services for equipment performance.

By 2035, the market is expected to achieve robust growth, reflecting evolving industry needs and technological advancements.

Market Segmentation

food-and-beverage-mro-services-market End Use Outlook

  • Food Processing
  • Beverage Production
  • Packaging
  • Logistics

food-and-beverage-mro-services-market Application Outlook

  • Maintenance Services
  • Repair Services
  • Overhaul Services
  • Installation Services

food-and-beverage-mro-services-market Service Type Outlook

  • Preventive Maintenance
  • Corrective Maintenance
  • Predictive Maintenance
  • Emergency Services

food-and-beverage-mro-services-market Customer Type Outlook

  • Manufacturers
  • Distributors
  • Retailers
  • Food Service Providers

food-and-beverage-mro-services-market Equipment Type Outlook

  • Refrigeration Systems
  • Heating Systems
  • Conveyor Systems
  • Mixing Equipment

Report Scope

MARKET SIZE 2024 22.0(USD Billion)
MARKET SIZE 2025 22.95(USD Billion)
MARKET SIZE 2035 35.0(USD Billion)
COMPOUND ANNUAL GROWTH RATE (CAGR) 4.31% (2025 - 2035)
REPORT COVERAGE Revenue Forecast, Competitive Landscape, Growth Factors, and Trends
BASE YEAR 2024
Market Forecast Period 2025 - 2035
Historical Data 2019 - 2024
Market Forecast Units USD Billion
Key Companies Profiled Ecolab (US), Diversey Holdings, Ltd. (US), Parker Hannifin Corporation (US), ITW (US), Brady Corporation (US), Hygiena, LLC (US), 3M Company (US), Danfoss A/S (DK), Karcher (DE)
Segments Covered Application, End Use, Service Type, Equipment Type, Customer Type
Key Market Opportunities Integration of automation and IoT technologies enhances efficiency in the Food and Beverage MRO services Market.
Key Market Dynamics Rising demand for sustainable practices drives innovation and competition in Food and Beverage Maintenance, Repair, and Operations services.
Countries Covered North America, Europe, APAC, South America, MEA

Table of Contents

  1. SECTION I: EXECUTIVE SUMMARY AND KEY HIGHLIGHTS |
    1. 1.1 EXECUTIVE SUMMARY | |
      1. 1.1.1 Market Overview | |
      2. 1.1.2 Key Findings | |
      3. 1.1.3 Market Segmentation | |
      4. 1.1.4 Competitive Landscape | |
      5. 1.1.5 Challenges and Opportunities | |
      6. 1.1.6 Future Outlook 2
  2. SECTION II: SCOPING, METHODOLOGY AND MARKET STRUCTURE |
    1. 2.1 MARKET INTRODUCTION | |
      1. 2.1.1 Definition | |
      2. 2.1.2 Scope of the study | | |
        1. 2.1.2.1 Research Objective | | |
        2. 2.1.2.2 Assumption | | |
        3. 2.1.2.3 Limitations |
    2. 2.2 RESEARCH METHODOLOGY | |
      1. 2.2.1 Overview | |
      2. 2.2.2 Data Mining | |
      3. 2.2.3 Secondary Research | |
      4. 2.2.4 Primary Research | | |
        1. 2.2.4.1 Primary Interviews and Information Gathering Process | | |
        2. 2.2.4.2 Breakdown of Primary Respondents | |
      5. 2.2.5 Forecasting Model | |
      6. 2.2.6 Market Size Estimation | | |
        1. 2.2.6.1 Bottom-Up Approach | | |
        2. 2.2.6.2 Top-Down Approach | |
      7. 2.2.7 Data Triangulation | |
      8. 2.2.8 Validation 3
  3. SECTION III: QUALITATIVE ANALYSIS |
    1. 3.1 MARKET DYNAMICS | |
      1. 3.1.1 Overview | |
      2. 3.1.2 Drivers | |
      3. 3.1.3 Restraints | |
      4. 3.1.4 Opportunities |
    2. 3.2 MARKET FACTOR ANALYSIS | |
      1. 3.2.1 Value chain Analysis | |
      2. 3.2.2 Porter's Five Forces Analysis | | |
        1. 3.2.2.1 Bargaining Power of Suppliers | | |
        2. 3.2.2.2 Bargaining Power of Buyers | | |
        3. 3.2.2.3 Threat of New Entrants | | |
        4. 3.2.2.4 Threat of Substitutes | | |
        5. 3.2.2.5 Intensity of Rivalry | |
      3. 3.2.3 COVID-19 Impact Analysis | | |
        1. 3.2.3.1 Market Impact Analysis | | |
        2. 3.2.3.2 Regional Impact | | |
        3. 3.2.3.3 Opportunity and Threat Analysis 4
  4. SECTION IV: QUANTITATIVE ANALYSIS |
    1. 4.1 Industrial Automation & Equipment, BY Application (USD Billion) | |
      1. 4.1.1 Maintenance Services | |
      2. 4.1.2 Repair Services | |
      3. 4.1.3 Overhaul Services | |
      4. 4.1.4 Installation Services |
    2. 4.2 Industrial Automation & Equipment, BY End Use (USD Billion) | |
      1. 4.2.1 Food Processing | |
      2. 4.2.2 Beverage Production | |
      3. 4.2.3 Packaging | |
      4. 4.2.4 Logistics |
    3. 4.3 Industrial Automation & Equipment, BY Service Type (USD Billion) | |
      1. 4.3.1 Preventive Maintenance | |
      2. 4.3.2 Corrective Maintenance | |
      3. 4.3.3 Predictive Maintenance | |
      4. 4.3.4 Emergency Services |
    4. 4.4 Industrial Automation & Equipment, BY Equipment Type (USD Billion) | |
      1. 4.4.1 Refrigeration Systems | |
      2. 4.4.2 Heating Systems | |
      3. 4.4.3 Conveyor Systems | |
      4. 4.4.4 Mixing Equipment |
    5. 4.5 Industrial Automation & Equipment, BY Customer Type (USD Billion) | |
      1. 4.5.1 Manufacturers | |
      2. 4.5.2 Distributors | |
      3. 4.5.3 Retailers | |
      4. 4.5.4 Food Service Providers |
    6. 4.6 Industrial Automation & Equipment, BY Region (USD Billion) | |
      1. 4.6.1 North America | | |
        1. 4.6.1.1 US | | |
        2. 4.6.1.2 Canada | |
      2. 4.6.2 Europe | | |
        1. 4.6.2.1 Germany | | |
        2. 4.6.2.2 UK | | |
        3. 4.6.2.3 France | | |
        4. 4.6.2.4 Russia | | |
        5. 4.6.2.5 Italy | | |
        6. 4.6.2.6 Spain | | |
        7. 4.6.2.7 Rest of Europe | |
      3. 4.6.3 APAC | | |
        1. 4.6.3.1 China | | |
        2. 4.6.3.2 India | | |
        3. 4.6.3.3 Japan | | |
        4. 4.6.3.4 South Korea | | |
        5. 4.6.3.5 Malaysia | | |
        6. 4.6.3.6 Thailand | | |
        7. 4.6.3.7 Indonesia | | |
        8. 4.6.3.8 Rest of APAC | |
      4. 4.6.4 South America | | |
        1. 4.6.4.1 Brazil | | |
        2. 4.6.4.2 Mexico | | |
        3. 4.6.4.3 Argentina | | |
        4. 4.6.4.4 Rest of South America | |
      5. 4.6.5 MEA | | |
        1. 4.6.5.1 GCC Countries | | |
        2. 4.6.5.2 South Africa | | |
        3. 4.6.5.3 Rest of MEA 5
  5. SECTION V: COMPETITIVE ANALYSIS |
    1. 5.1 Competitive Landscape | |
      1. 5.1.1 Overview | |
      2. 5.1.2 Competitive Analysis | |
      3. 5.1.3 Market share Analysis | |
      4. 5.1.4 Major Growth Strategy in the Industrial Automation & Equipment | |
      5. 5.1.5 Competitive Benchmarking | |
      6. 5.1.6 Leading Players in Terms of Number of Developments in the Industrial Automation & Equipment | |
      7. 5.1.7 Key developments and growth strategies | | |
        1. 5.1.7.1 New Product Launch/Service Deployment | | |
        2. 5.1.7.2 Merger & Acquisitions | | |
        3. 5.1.7.3 Joint Ventures | |
      8. 5.1.8 Major Players Financial Matrix | | |
        1. 5.1.8.1 Sales and Operating Income | | |
        2. 5.1.8.2 Major Players R&D Expenditure. 2023 |
    2. 5.2 Company Profiles | |
      1. 5.2.1 Ecolab (US) | | |
        1. 5.2.1.1 Financial Overview | | |
        2. 5.2.1.2 Products Offered | | |
        3. 5.2.1.3 Key Developments | | |
        4. 5.2.1.4 SWOT Analysis | | |
        5. 5.2.1.5 Key Strategies | |
      2. 5.2.2 Diversey Holdings, Ltd. (US) | | |
        1. 5.2.2.1 Financial Overview | | |
        2. 5.2.2.2 Products Offered | | |
        3. 5.2.2.3 Key Developments | | |
        4. 5.2.2.4 SWOT Analysis | | |
        5. 5.2.2.5 Key Strategies | |
      3. 5.2.3 Parker Hannifin Corporation (US) | | |
        1. 5.2.3.1 Financial Overview | | |
        2. 5.2.3.2 Products Offered | | |
        3. 5.2.3.3 Key Developments | | |
        4. 5.2.3.4 SWOT Analysis | | |
        5. 5.2.3.5 Key Strategies | |
      4. 5.2.4 ITW (US) | | |
        1. 5.2.4.1 Financial Overview | | |
        2. 5.2.4.2 Products Offered | | |
        3. 5.2.4.3 Key Developments | | |
        4. 5.2.4.4 SWOT Analysis | | |
        5. 5.2.4.5 Key Strategies | |
      5. 5.2.5 Brady Corporation (US) | | |
        1. 5.2.5.1 Financial Overview | | |
        2. 5.2.5.2 Products Offered | | |
        3. 5.2.5.3 Key Developments | | |
        4. 5.2.5.4 SWOT Analysis | | |
        5. 5.2.5.5 Key Strategies | |
      6. 5.2.6 Hygiena, LLC (US) | | |
        1. 5.2.6.1 Financial Overview | | |
        2. 5.2.6.2 Products Offered | | |
        3. 5.2.6.3 Key Developments | | |
        4. 5.2.6.4 SWOT Analysis | | |
        5. 5.2.6.5 Key Strategies | |
      7. 5.2.7 3M Company (US) | | |
        1. 5.2.7.1 Financial Overview | | |
        2. 5.2.7.2 Products Offered | | |
        3. 5.2.7.3 Key Developments | | |
        4. 5.2.7.4 SWOT Analysis | | |
        5. 5.2.7.5 Key Strategies | |
      8. 5.2.8 Danfoss A/S (DK) | | |
        1. 5.2.8.1 Financial Overview | | |
        2. 5.2.8.2 Products Offered | | |
        3. 5.2.8.3 Key Developments | | |
        4. 5.2.8.4 SWOT Analysis | | |
        5. 5.2.8.5 Key Strategies | |
      9. 5.2.9 Karcher (DE) | | |
        1. 5.2.9.1 Financial Overview | | |
        2. 5.2.9.2 Products Offered | | |
        3. 5.2.9.3 Key Developments | | |
        4. 5.2.9.4 SWOT Analysis | | |
        5. 5.2.9.5 Key Strategies |
    3. 5.3 Appendix | |
      1. 5.3.1 References | |
      2. 5.3.2 Related Reports 6 LIST OF FIGURES |
    4. 6.1 MARKET SYNOPSIS |
    5. 6.2 NORTH AMERICA MARKET ANALYSIS |
    6. 6.3 US MARKET ANALYSIS BY APPLICATION |
    7. 6.4 US MARKET ANALYSIS BY END USE |
    8. 6.5 US MARKET ANALYSIS BY SERVICE TYPE |
    9. 6.6 US MARKET ANALYSIS BY EQUIPMENT TYPE |
    10. 6.7 US MARKET ANALYSIS BY CUSTOMER TYPE |
    11. 6.8 CANADA MARKET ANALYSIS BY APPLICATION |
    12. 6.9 CANADA MARKET ANALYSIS BY END USE |
    13. 6.10 CANADA MARKET ANALYSIS BY SERVICE TYPE |
    14. 6.11 CANADA MARKET ANALYSIS BY EQUIPMENT TYPE |
    15. 6.12 CANADA MARKET ANALYSIS BY CUSTOMER TYPE |
    16. 6.13 EUROPE MARKET ANALYSIS |
    17. 6.14 GERMANY MARKET ANALYSIS BY APPLICATION |
    18. 6.15 GERMANY MARKET ANALYSIS BY END USE |
    19. 6.16 GERMANY MARKET ANALYSIS BY SERVICE TYPE |
    20. 6.17 GERMANY MARKET ANALYSIS BY EQUIPMENT TYPE |
    21. 6.18 GERMANY MARKET ANALYSIS BY CUSTOMER TYPE |
    22. 6.19 UK MARKET ANALYSIS BY APPLICATION |
    23. 6.20 UK MARKET ANALYSIS BY END USE |
    24. 6.21 UK MARKET ANALYSIS BY SERVICE TYPE |
    25. 6.22 UK MARKET ANALYSIS BY EQUIPMENT TYPE |
    26. 6.23 UK MARKET ANALYSIS BY CUSTOMER TYPE |
    27. 6.24 FRANCE MARKET ANALYSIS BY APPLICATION |
    28. 6.25 FRANCE MARKET ANALYSIS BY END USE |
    29. 6.26 FRANCE MARKET ANALYSIS BY SERVICE TYPE |
    30. 6.27 FRANCE MARKET ANALYSIS BY EQUIPMENT TYPE |
    31. 6.28 FRANCE MARKET ANALYSIS BY CUSTOMER TYPE |
    32. 6.29 RUSSIA MARKET ANALYSIS BY APPLICATION |
    33. 6.30 RUSSIA MARKET ANALYSIS BY END USE |
    34. 6.31 RUSSIA MARKET ANALYSIS BY SERVICE TYPE |
    35. 6.32 RUSSIA MARKET ANALYSIS BY EQUIPMENT TYPE |
    36. 6.33 RUSSIA MARKET ANALYSIS BY CUSTOMER TYPE |
    37. 6.34 ITALY MARKET ANALYSIS BY APPLICATION |
    38. 6.35 ITALY MARKET ANALYSIS BY END USE |
    39. 6.36 ITALY MARKET ANALYSIS BY SERVICE TYPE |
    40. 6.37 ITALY MARKET ANALYSIS BY EQUIPMENT TYPE |
    41. 6.38 ITALY MARKET ANALYSIS BY CUSTOMER TYPE |
    42. 6.39 SPAIN MARKET ANALYSIS BY APPLICATION |
    43. 6.40 SPAIN MARKET ANALYSIS BY END USE |
    44. 6.41 SPAIN MARKET ANALYSIS BY SERVICE TYPE |
    45. 6.42 SPAIN MARKET ANALYSIS BY EQUIPMENT TYPE |
    46. 6.43 SPAIN MARKET ANALYSIS BY CUSTOMER TYPE |
    47. 6.44 REST OF EUROPE MARKET ANALYSIS BY APPLICATION |
    48. 6.45 REST OF EUROPE MARKET ANALYSIS BY END USE |
    49. 6.46 REST OF EUROPE MARKET ANALYSIS BY SERVICE TYPE |
    50. 6.47 REST OF EUROPE MARKET ANALYSIS BY EQUIPMENT TYPE |
    51. 6.48 REST OF EUROPE MARKET ANALYSIS BY CUSTOMER TYPE |
    52. 6.49 APAC MARKET ANALYSIS |
    53. 6.50 CHINA MARKET ANALYSIS BY APPLICATION |
    54. 6.51 CHINA MARKET ANALYSIS BY END USE |
    55. 6.52 CHINA MARKET ANALYSIS BY SERVICE TYPE |
    56. 6.53 CHINA MARKET ANALYSIS BY EQUIPMENT TYPE |
    57. 6.54 CHINA MARKET ANALYSIS BY CUSTOMER TYPE |
    58. 6.55 INDIA MARKET ANALYSIS BY APPLICATION |
    59. 6.56 INDIA MARKET ANALYSIS BY END USE |
    60. 6.57 INDIA MARKET ANALYSIS BY SERVICE TYPE |
    61. 6.58 INDIA MARKET ANALYSIS BY EQUIPMENT TYPE |
    62. 6.59 INDIA MARKET ANALYSIS BY CUSTOMER TYPE |
    63. 6.60 JAPAN MARKET ANALYSIS BY APPLICATION |
    64. 6.61 JAPAN MARKET ANALYSIS BY END USE |
    65. 6.62 JAPAN MARKET ANALYSIS BY SERVICE TYPE |
    66. 6.63 JAPAN MARKET ANALYSIS BY EQUIPMENT TYPE |
    67. 6.64 JAPAN MARKET ANALYSIS BY CUSTOMER TYPE |
    68. 6.65 SOUTH KOREA MARKET ANALYSIS BY APPLICATION |
    69. 6.66 SOUTH KOREA MARKET ANALYSIS BY END USE |
    70. 6.67 SOUTH KOREA MARKET ANALYSIS BY SERVICE TYPE |
    71. 6.68 SOUTH KOREA MARKET ANALYSIS BY EQUIPMENT TYPE |
    72. 6.69 SOUTH KOREA MARKET ANALYSIS BY CUSTOMER TYPE |
    73. 6.70 MALAYSIA MARKET ANALYSIS BY APPLICATION |
    74. 6.71 MALAYSIA MARKET ANALYSIS BY END USE |
    75. 6.72 MALAYSIA MARKET ANALYSIS BY SERVICE TYPE |
    76. 6.73 MALAYSIA MARKET ANALYSIS BY EQUIPMENT TYPE |
    77. 6.74 MALAYSIA MARKET ANALYSIS BY CUSTOMER TYPE |
    78. 6.75 THAILAND MARKET ANALYSIS BY APPLICATION |
    79. 6.76 THAILAND MARKET ANALYSIS BY END USE |
    80. 6.77 THAILAND MARKET ANALYSIS BY SERVICE TYPE |
    81. 6.78 THAILAND MARKET ANALYSIS BY EQUIPMENT TYPE |
    82. 6.79 THAILAND MARKET ANALYSIS BY CUSTOMER TYPE |
    83. 6.80 INDONESIA MARKET ANALYSIS BY APPLICATION |
    84. 6.81 INDONESIA MARKET ANALYSIS BY END USE |
    85. 6.82 INDONESIA MARKET ANALYSIS BY SERVICE TYPE |
    86. 6.83 INDONESIA MARKET ANALYSIS BY EQUIPMENT TYPE |
    87. 6.84 INDONESIA MARKET ANALYSIS BY CUSTOMER TYPE |
    88. 6.85 REST OF APAC MARKET ANALYSIS BY APPLICATION |
    89. 6.86 REST OF APAC MARKET ANALYSIS BY END USE |
    90. 6.87 REST OF APAC MARKET ANALYSIS BY SERVICE TYPE |
    91. 6.88 REST OF APAC MARKET ANALYSIS BY EQUIPMENT TYPE |
    92. 6.89 REST OF APAC MARKET ANALYSIS BY CUSTOMER TYPE |
    93. 6.90 SOUTH AMERICA MARKET ANALYSIS |
    94. 6.91 BRAZIL MARKET ANALYSIS BY APPLICATION |
    95. 6.92 BRAZIL MARKET ANALYSIS BY END USE |
    96. 6.93 BRAZIL MARKET ANALYSIS BY SERVICE TYPE |
    97. 6.94 BRAZIL MARKET ANALYSIS BY EQUIPMENT TYPE |
    98. 6.95 BRAZIL MARKET ANALYSIS BY CUSTOMER TYPE |
    99. 6.96 MEXICO MARKET ANALYSIS BY APPLICATION |
    100. 6.97 MEXICO MARKET ANALYSIS BY END USE |
    101. 6.98 MEXICO MARKET ANALYSIS BY SERVICE TYPE |
    102. 6.99 MEXICO MARKET ANALYSIS BY EQUIPMENT TYPE |
    103. 6.100 MEXICO MARKET ANALYSIS BY CUSTOMER TYPE |
    104. 6.101 ARGENTINA MARKET ANALYSIS BY APPLICATION |
    105. 6.102 ARGENTINA MARKET ANALYSIS BY END USE |
    106. 6.103 ARGENTINA MARKET ANALYSIS BY SERVICE TYPE |
    107. 6.104 ARGENTINA MARKET ANALYSIS BY EQUIPMENT TYPE |
    108. 6.105 ARGENTINA MARKET ANALYSIS BY CUSTOMER TYPE |
    109. 6.106 REST OF SOUTH AMERICA MARKET ANALYSIS BY APPLICATION |
    110. 6.107 REST OF SOUTH AMERICA MARKET ANALYSIS BY END USE |
    111. 6.108 REST OF SOUTH AMERICA MARKET ANALYSIS BY SERVICE TYPE |
    112. 6.109 REST OF SOUTH AMERICA MARKET ANALYSIS BY EQUIPMENT TYPE |
    113. 6.110 REST OF SOUTH AMERICA MARKET ANALYSIS BY CUSTOMER TYPE |
    114. 6.111 MEA MARKET ANALYSIS |
    115. 6.112 GCC COUNTRIES MARKET ANALYSIS BY APPLICATION |
    116. 6.113 GCC COUNTRIES MARKET ANALYSIS BY END USE |
    117. 6.114 GCC COUNTRIES MARKET ANALYSIS BY SERVICE TYPE |
    118. 6.115 GCC COUNTRIES MARKET ANALYSIS BY EQUIPMENT TYPE |
    119. 6.116 GCC COUNTRIES MARKET ANALYSIS BY CUSTOMER TYPE |
    120. 6.117 SOUTH AFRICA MARKET ANALYSIS BY APPLICATION |
    121. 6.118 SOUTH AFRICA MARKET ANALYSIS BY END USE |
    122. 6.119 SOUTH AFRICA MARKET ANALYSIS BY SERVICE TYPE |
    123. 6.120 SOUTH AFRICA MARKET ANALYSIS BY EQUIPMENT TYPE |
    124. 6.121 SOUTH AFRICA MARKET ANALYSIS BY CUSTOMER TYPE |
    125. 6.122 REST OF MEA MARKET ANALYSIS BY APPLICATION |
    126. 6.123 REST OF MEA MARKET ANALYSIS BY END USE |
    127. 6.124 REST OF MEA MARKET ANALYSIS BY SERVICE TYPE |
    128. 6.125 REST OF MEA MARKET ANALYSIS BY EQUIPMENT TYPE |
    129. 6.126 REST OF MEA MARKET ANALYSIS BY CUSTOMER TYPE |
    130. 6.127 KEY BUYING CRITERIA OF INDUSTRIAL AUTOMATION & EQUIPMENT |
    131. 6.128 RESEARCH PROCESS OF MRFR |
    132. 6.129 DRO ANALYSIS OF INDUSTRIAL AUTOMATION & EQUIPMENT |
    133. 6.130 DRIVERS IMPACT ANALYSIS: INDUSTRIAL AUTOMATION & EQUIPMENT |
    134. 6.131 RESTRAINTS IMPACT ANALYSIS: INDUSTRIAL AUTOMATION & EQUIPMENT |
    135. 6.132 SUPPLY / VALUE CHAIN: INDUSTRIAL AUTOMATION & EQUIPMENT |
    136. 6.133 INDUSTRIAL AUTOMATION & EQUIPMENT, BY APPLICATION, 2024 (% SHARE) |
    137. 6.134 INDUSTRIAL AUTOMATION & EQUIPMENT, BY APPLICATION, 2024 TO 2035 (USD Billion) |
    138. 6.135 INDUSTRIAL AUTOMATION & EQUIPMENT, BY END USE, 2024 (% SHARE) |
    139. 6.136 INDUSTRIAL AUTOMATION & EQUIPMENT, BY END USE, 2024 TO 2035 (USD Billion) |
    140. 6.137 INDUSTRIAL AUTOMATION & EQUIPMENT, BY SERVICE TYPE, 2024 (% SHARE) |
    141. 6.138 INDUSTRIAL AUTOMATION & EQUIPMENT, BY SERVICE TYPE, 2024 TO 2035 (USD Billion) |
    142. 6.139 INDUSTRIAL AUTOMATION & EQUIPMENT, BY EQUIPMENT TYPE, 2024 (% SHARE) |
    143. 6.140 INDUSTRIAL AUTOMATION & EQUIPMENT, BY EQUIPMENT TYPE, 2024 TO 2035 (USD Billion) |
    144. 6.141 INDUSTRIAL AUTOMATION & EQUIPMENT, BY CUSTOMER TYPE, 2024 (% SHARE) |
    145. 6.142 INDUSTRIAL AUTOMATION & EQUIPMENT, BY CUSTOMER TYPE, 2024 TO 2035 (USD Billion) |
    146. 6.143 BENCHMARKING OF MAJOR COMPETITORS 7 LIST OF TABLES |
    147. 7.1 LIST OF ASSUMPTIONS | |
      1. 7.1.1 |
    148. 7.2 North America MARKET SIZE ESTIMATES; FORECAST | |
      1. 7.2.1 BY APPLICATION, 2025-2035 (USD Billion) | |
      2. 7.2.2 BY END USE, 2025-2035 (USD Billion) | |
      3. 7.2.3 BY SERVICE TYPE, 2025-2035 (USD Billion) | |
      4. 7.2.4 BY EQUIPMENT TYPE, 2025-2035 (USD Billion) | |
      5. 7.2.5 BY CUSTOMER TYPE, 2025-2035 (USD Billion) |
    149. 7.3 US MARKET SIZE ESTIMATES; FORECAST | |
      1. 7.3.1 BY APPLICATION, 2025-2035 (USD Billion) | |
      2. 7.3.2 BY END USE, 2025-2035 (USD Billion) | |
      3. 7.3.3 BY SERVICE TYPE, 2025-2035 (USD Billion) | |
      4. 7.3.4 BY EQUIPMENT TYPE, 2025-2035 (USD Billion) | |
      5. 7.3.5 BY CUSTOMER TYPE, 2025-2035 (USD Billion) |
    150. 7.4 Canada MARKET SIZE ESTIMATES; FORECAST | |
      1. 7.4.1 BY APPLICATION, 2025-2035 (USD Billion) | |
      2. 7.4.2 BY END USE, 2025-2035 (USD Billion) | |
      3. 7.4.3 BY SERVICE TYPE, 2025-2035 (USD Billion) | |
      4. 7.4.4 BY EQUIPMENT TYPE, 2025-2035 (USD Billion) | |
      5. 7.4.5 BY CUSTOMER TYPE, 2025-2035 (USD Billion) |
    151. 7.5 Europe MARKET SIZE ESTIMATES; FORECAST | |
      1. 7.5.1 BY APPLICATION, 2025-2035 (USD Billion) | |
      2. 7.5.2 BY END USE, 2025-2035 (USD Billion) | |
      3. 7.5.3 BY SERVICE TYPE, 2025-2035 (USD Billion) | |
      4. 7.5.4 BY EQUIPMENT TYPE, 2025-2035 (USD Billion) | |
      5. 7.5.5 BY CUSTOMER TYPE, 2025-2035 (USD Billion) |
    152. 7.6 Germany MARKET SIZE ESTIMATES; FORECAST | |
      1. 7.6.1 BY APPLICATION, 2025-2035 (USD Billion) | |
      2. 7.6.2 BY END USE, 2025-2035 (USD Billion) | |
      3. 7.6.3 BY SERVICE TYPE, 2025-2035 (USD Billion) | |
      4. 7.6.4 BY EQUIPMENT TYPE, 2025-2035 (USD Billion) | |
      5. 7.6.5 BY CUSTOMER TYPE, 2025-2035 (USD Billion) |
    153. 7.7 UK MARKET SIZE ESTIMATES; FORECAST | |
      1. 7.7.1 BY APPLICATION, 2025-2035 (USD Billion) | |
      2. 7.7.2 BY END USE, 2025-2035 (USD Billion) | |
      3. 7.7.3 BY SERVICE TYPE, 2025-2035 (USD Billion) | |
      4. 7.7.4 BY EQUIPMENT TYPE, 2025-2035 (USD Billion) | |
      5. 7.7.5 BY CUSTOMER TYPE, 2025-2035 (USD Billion) |
    154. 7.8 France MARKET SIZE ESTIMATES; FORECAST | |
      1. 7.8.1 BY APPLICATION, 2025-2035 (USD Billion) | |
      2. 7.8.2 BY END USE, 2025-2035 (USD Billion) | |
      3. 7.8.3 BY SERVICE TYPE, 2025-2035 (USD Billion) | |
      4. 7.8.4 BY EQUIPMENT TYPE, 2025-2035 (USD Billion) | |
      5. 7.8.5 BY CUSTOMER TYPE, 2025-2035 (USD Billion) |
    155. 7.9 Russia MARKET SIZE ESTIMATES; FORECAST | |
      1. 7.9.1 BY APPLICATION, 2025-2035 (USD Billion) | |
      2. 7.9.2 BY END USE, 2025-2035 (USD Billion) | |
      3. 7.9.3 BY SERVICE TYPE, 2025-2035 (USD Billion) | |
      4. 7.9.4 BY EQUIPMENT TYPE, 2025-2035 (USD Billion) | |
      5. 7.9.5 BY CUSTOMER TYPE, 2025-2035 (USD Billion) |
    156. 7.10 Italy MARKET SIZE ESTIMATES; FORECAST | |
      1. 7.10.1 BY APPLICATION, 2025-2035 (USD Billion) | |
      2. 7.10.2 BY END USE, 2025-2035 (USD Billion) | |
      3. 7.10.3 BY SERVICE TYPE, 2025-2035 (USD Billion) | |
      4. 7.10.4 BY EQUIPMENT TYPE, 2025-2035 (USD Billion) | |
      5. 7.10.5 BY CUSTOMER TYPE, 2025-2035 (USD Billion) |
    157. 7.11 Spain MARKET SIZE ESTIMATES; FORECAST | |
      1. 7.11.1 BY APPLICATION, 2025-2035 (USD Billion) | |
      2. 7.11.2 BY END USE, 2025-2035 (USD Billion) | |
      3. 7.11.3 BY SERVICE TYPE, 2025-2035 (USD Billion) | |
      4. 7.11.4 BY EQUIPMENT TYPE, 2025-2035 (USD Billion) | |
      5. 7.11.5 BY CUSTOMER TYPE, 2025-2035 (USD Billion) |
    158. 7.12 Rest of Europe MARKET SIZE ESTIMATES; FORECAST | |
      1. 7.12.1 BY APPLICATION, 2025-2035 (USD Billion) | |
      2. 7.12.2 BY END USE, 2025-2035 (USD Billion) | |
      3. 7.12.3 BY SERVICE TYPE, 2025-2035 (USD Billion) | |
      4. 7.12.4 BY EQUIPMENT TYPE, 2025-2035 (USD Billion) | |
      5. 7.12.5 BY CUSTOMER TYPE, 2025-2035 (USD Billion) |
    159. 7.13 APAC MARKET SIZE ESTIMATES; FORECAST | |
      1. 7.13.1 BY APPLICATION, 2025-2035 (USD Billion) | |
      2. 7.13.2 BY END USE, 2025-2035 (USD Billion) | |
      3. 7.13.3 BY SERVICE TYPE, 2025-2035 (USD Billion) | |
      4. 7.13.4 BY EQUIPMENT TYPE, 2025-2035 (USD Billion) | |
      5. 7.13.5 BY CUSTOMER TYPE, 2025-2035 (USD Billion) |
    160. 7.14 China MARKET SIZE ESTIMATES; FORECAST | |
      1. 7.14.1 BY APPLICATION, 2025-2035 (USD Billion) | |
      2. 7.14.2 BY END USE, 2025-2035 (USD Billion) | |
      3. 7.14.3 BY SERVICE TYPE, 2025-2035 (USD Billion) | |
      4. 7.14.4 BY EQUIPMENT TYPE, 2025-2035 (USD Billion) | |
      5. 7.14.5 BY CUSTOMER TYPE, 2025-2035 (USD Billion) |
    161. 7.15 India MARKET SIZE ESTIMATES; FORECAST | |
      1. 7.15.1 BY APPLICATION, 2025-2035 (USD Billion) | |
      2. 7.15.2 BY END USE, 2025-2035 (USD Billion) | |
      3. 7.15.3 BY SERVICE TYPE, 2025-2035 (USD Billion) | |
      4. 7.15.4 BY EQUIPMENT TYPE, 2025-2035 (USD Billion) | |
      5. 7.15.5 BY CUSTOMER TYPE, 2025-2035 (USD Billion) |
    162. 7.16 Japan MARKET SIZE ESTIMATES; FORECAST | |
      1. 7.16.1 BY APPLICATION, 2025-2035 (USD Billion) | |
      2. 7.16.2 BY END USE, 2025-2035 (USD Billion) | |
      3. 7.16.3 BY SERVICE TYPE, 2025-2035 (USD Billion) | |
      4. 7.16.4 BY EQUIPMENT TYPE, 2025-2035 (USD Billion) | |
      5. 7.16.5 BY CUSTOMER TYPE, 2025-2035 (USD Billion) |
    163. 7.17 South Korea MARKET SIZE ESTIMATES; FORECAST | |
      1. 7.17.1 BY APPLICATION, 2025-2035 (USD Billion) | |
      2. 7.17.2 BY END USE, 2025-2035 (USD Billion) | |
      3. 7.17.3 BY SERVICE TYPE, 2025-2035 (USD Billion) | |
      4. 7.17.4 BY EQUIPMENT TYPE, 2025-2035 (USD Billion) | |
      5. 7.17.5 BY CUSTOMER TYPE, 2025-2035 (USD Billion) |
    164. 7.18 Malaysia MARKET SIZE ESTIMATES; FORECAST | |
      1. 7.18.1 BY APPLICATION, 2025-2035 (USD Billion) | |
      2. 7.18.2 BY END USE, 2025-2035 (USD Billion) | |
      3. 7.18.3 BY SERVICE TYPE, 2025-2035 (USD Billion) | |
      4. 7.18.4 BY EQUIPMENT TYPE, 2025-2035 (USD Billion) | |
      5. 7.18.5 BY CUSTOMER TYPE, 2025-2035 (USD Billion) |
    165. 7.19 Thailand MARKET SIZE ESTIMATES; FORECAST | |
      1. 7.19.1 BY APPLICATION, 2025-2035 (USD Billion) | |
      2. 7.19.2 BY END USE, 2025-2035 (USD Billion) | |
      3. 7.19.3 BY SERVICE TYPE, 2025-2035 (USD Billion) | |
      4. 7.19.4 BY EQUIPMENT TYPE, 2025-2035 (USD Billion) | |
      5. 7.19.5 BY CUSTOMER TYPE, 2025-2035 (USD Billion) |
    166. 7.20 Indonesia MARKET SIZE ESTIMATES; FORECAST | |
      1. 7.20.1 BY APPLICATION, 2025-2035 (USD Billion) | |
      2. 7.20.2 BY END USE, 2025-2035 (USD Billion) | |
      3. 7.20.3 BY SERVICE TYPE, 2025-2035 (USD Billion) | |
      4. 7.20.4 BY EQUIPMENT TYPE, 2025-2035 (USD Billion) | |
      5. 7.20.5 BY CUSTOMER TYPE, 2025-2035 (USD Billion) |
    167. 7.21 Rest of APAC MARKET SIZE ESTIMATES; FORECAST | |
      1. 7.21.1 BY APPLICATION, 2025-2035 (USD Billion) | |
      2. 7.21.2 BY END USE, 2025-2035 (USD Billion) | |
      3. 7.21.3 BY SERVICE TYPE, 2025-2035 (USD Billion) | |
      4. 7.21.4 BY EQUIPMENT TYPE, 2025-2035 (USD Billion) | |
      5. 7.21.5 BY CUSTOMER TYPE, 2025-2035 (USD Billion) |
    168. 7.22 South America MARKET SIZE ESTIMATES; FORECAST | |
      1. 7.22.1 BY APPLICATION, 2025-2035 (USD Billion) | |
      2. 7.22.2 BY END USE, 2025-2035 (USD Billion) | |
      3. 7.22.3 BY SERVICE TYPE, 2025-2035 (USD Billion) | |
      4. 7.22.4 BY EQUIPMENT TYPE, 2025-2035 (USD Billion) | |
      5. 7.22.5 BY CUSTOMER TYPE, 2025-2035 (USD Billion) |
    169. 7.23 Brazil MARKET SIZE ESTIMATES; FORECAST | |
      1. 7.23.1 BY APPLICATION, 2025-2035 (USD Billion) | |
      2. 7.23.2 BY END USE, 2025-2035 (USD Billion) | |
      3. 7.23.3 BY SERVICE TYPE, 2025-2035 (USD Billion) | |
      4. 7.23.4 BY EQUIPMENT TYPE, 2025-2035 (USD Billion) | |
      5. 7.23.5 BY CUSTOMER TYPE, 2025-2035 (USD Billion) |
    170. 7.24 Mexico MARKET SIZE ESTIMATES; FORECAST | |
      1. 7.24.1 BY APPLICATION, 2025-2035 (USD Billion) | |
      2. 7.24.2 BY END USE, 2025-2035 (USD Billion) | |
      3. 7.24.3 BY SERVICE TYPE, 2025-2035 (USD Billion) | |
      4. 7.24.4 BY EQUIPMENT TYPE, 2025-2035 (USD Billion) | |
      5. 7.24.5 BY CUSTOMER TYPE, 2025-2035 (USD Billion) |
    171. 7.25 Argentina MARKET SIZE ESTIMATES; FORECAST | |
      1. 7.25.1 BY APPLICATION, 2025-2035 (USD Billion) | |
      2. 7.25.2 BY END USE, 2025-2035 (USD Billion) | |
      3. 7.25.3 BY SERVICE TYPE, 2025-2035 (USD Billion) | |
      4. 7.25.4 BY EQUIPMENT TYPE, 2025-2035 (USD Billion) | |
      5. 7.25.5 BY CUSTOMER TYPE, 2025-2035 (USD Billion) |
    172. 7.26 Rest of South America MARKET SIZE ESTIMATES; FORECAST | |
      1. 7.26.1 BY APPLICATION, 2025-2035 (USD Billion) | |
      2. 7.26.2 BY END USE, 2025-2035 (USD Billion) | |
      3. 7.26.3 BY SERVICE TYPE, 2025-2035 (USD Billion) | |
      4. 7.26.4 BY EQUIPMENT TYPE, 2025-2035 (USD Billion) | |
      5. 7.26.5 BY CUSTOMER TYPE, 2025-2035 (USD Billion) |
    173. 7.27 MEA MARKET SIZE ESTIMATES; FORECAST | |
      1. 7.27.1 BY APPLICATION, 2025-2035 (USD Billion) | |
      2. 7.27.2 BY END USE, 2025-2035 (USD Billion) | |
      3. 7.27.3 BY SERVICE TYPE, 2025-2035 (USD Billion) | |
      4. 7.27.4 BY EQUIPMENT TYPE, 2025-2035 (USD Billion) | |
      5. 7.27.5 BY CUSTOMER TYPE, 2025-2035 (USD Billion) |
    174. 7.28 GCC Countries MARKET SIZE ESTIMATES; FORECAST | |
      1. 7.28.1 BY APPLICATION, 2025-2035 (USD Billion) | |
      2. 7.28.2 BY END USE, 2025-2035 (USD Billion) | |
      3. 7.28.3 BY SERVICE TYPE, 2025-2035 (USD Billion) | |
      4. 7.28.4 BY EQUIPMENT TYPE, 2025-2035 (USD Billion) | |
      5. 7.28.5 BY CUSTOMER TYPE, 2025-2035 (USD Billion) |
    175. 7.29 South Africa MARKET SIZE ESTIMATES; FORECAST | |
      1. 7.29.1 BY APPLICATION, 2025-2035 (USD Billion) | |
      2. 7.29.2 BY END USE, 2025-2035 (USD Billion) | |
      3. 7.29.3 BY SERVICE TYPE, 2025-2035 (USD Billion) | |
      4. 7.29.4 BY EQUIPMENT TYPE, 2025-2035 (USD Billion) | |
      5. 7.29.5 BY CUSTOMER TYPE, 2025-2035 (USD Billion) |
    176. 7.30 Rest of MEA MARKET SIZE ESTIMATES; FORECAST | |
      1. 7.30.1 BY APPLICATION, 2025-2035 (USD Billion) | |
      2. 7.30.2 BY END USE, 2025-2035 (USD Billion) | |
      3. 7.30.3 BY SERVICE TYPE, 2025-2035 (USD Billion) | |
      4. 7.30.4 BY EQUIPMENT TYPE, 2025-2035 (USD Billion) | |
      5. 7.30.5 BY CUSTOMER TYPE, 2025-2035 (USD Billion) |
    177. 7.31 PRODUCT LAUNCH/PRODUCT DEVELOPMENT/APPROVAL | |
      1. 7.31.1 |
    178. 7.32 ACQUISITION/PARTNERSHIP | |

FAQs

What is the current valuation of the Food and Beverage MRO services market as of 2024?

The market valuation was 22.0 USD Billion in 2024.

What is the projected market size for the Food and Beverage MRO services market by 2035?

The market is projected to reach 35.0 USD Billion by 2035.

What is the expected CAGR for the Food and Beverage MRO services market during the forecast period 2025 - 2035?

The expected CAGR for the market during this period is 4.31%.

Which companies are considered key players in the Food and Beverage MRO services market?

Key players include Ecolab, Diversey Holdings, Parker Hannifin Corporation, and ITW.

What are the main segments of the Food and Beverage MRO services market by application?

The main segments include Maintenance Services, Repair Services, Overhaul Services, and Installation Services.

How much is the Food Processing segment valued at in the Food and Beverage MRO services market?

The Food Processing segment is valued between 8.0 and 12.5 USD Billion.

What is the valuation range for the Refrigeration Systems segment in the market?

The Refrigeration Systems segment is valued between 5.5 and 8.5 USD Billion.

What types of maintenance services are included in the Food and Beverage MRO services market?

The types of maintenance services include Preventive Maintenance, Corrective Maintenance, Predictive Maintenance, and Emergency Services.

What is the projected valuation for the Installation Services segment by 2035?

The Installation Services segment is projected to grow from 7.0 to 12.0 USD Billion by 2035.

Which customer types are represented in the Food and Beverage MRO services market?

Customer types include Manufacturers, Distributors, Retailers, and Food Service Providers.

Author
Author
Author Profile
Shubham Munde LinkedIn
Team Lead - Research
Shubham brings over 7 years of expertise in Market Intelligence and Strategic Consulting, with a strong focus on the Automotive, Aerospace, and Defense sectors. Backed by a solid foundation in semiconductors, electronics, and software, he has successfully delivered high-impact syndicated and custom research on a global scale. His core strengths include market sizing, forecasting, competitive intelligence, consumer insights, and supply chain mapping. Widely recognized for developing scalable growth strategies, Shubham empowers clients to navigate complex markets and achieve a lasting competitive edge. Trusted by start-ups and Fortune 500 companies alike, he consistently converts challenges into strategic opportunities that drive sustainable growth.
Share::
Request Free Sample
Download Free Sample

Kindly complete the form below to receive a free sample of this Report

Share::
Request Free Sample
Download PDF ×

We do not share your information with anyone. However, we may send you emails based on your report interest from time to time. You may contact us at any time to opt-out.