Fortified Dairy Products Market (2026 - 2035)

Fortified Dairy Products Market Size, Share, Industry Trend & Analysis Research Report By Product Type (Milk, Yogurt, Cheese, Butter & Spreads, Other Dairy Products), By Nutrient Type (Vitamins, Minerals, Proteins, Probiotics, Others), By Customer Demographics (Children, Adults, Pregnant & Lactating Women, Elderly), By Distribution Channel (Supermarkets/Hypermarkets, Convenience Stores, Online Retail, Specialty Health Stores, Other Channels), By Geography (North America, Europe, Asia-Pacific, South America, Middle East & Africa) - Forecast to 2035
ID: MRFR/FnB/30272-HCR
128 Pages
Varsha More
Last Updated: July 12, 2026
Fortified Dairy Products Market
Market Size
Forecast Period2026-2035
CAGR (2026-2035)6.10%
2025 Market SizeUSD 40.08 Billion
2035 Market SizeUSD 72.45 Billion
Key Players
Nestlé S.A.
Danone S.A.
Fonterra Co-operative
Arla Foods
FrieslandCampina
Amul
Opportunities
  • Expansion of School-Feeding Programs in Emerging Markets
  • Direct-to-Consumer Subscription Models
  • Personalized Nutrition Platforms

Fortified Dairy Products Market Summary

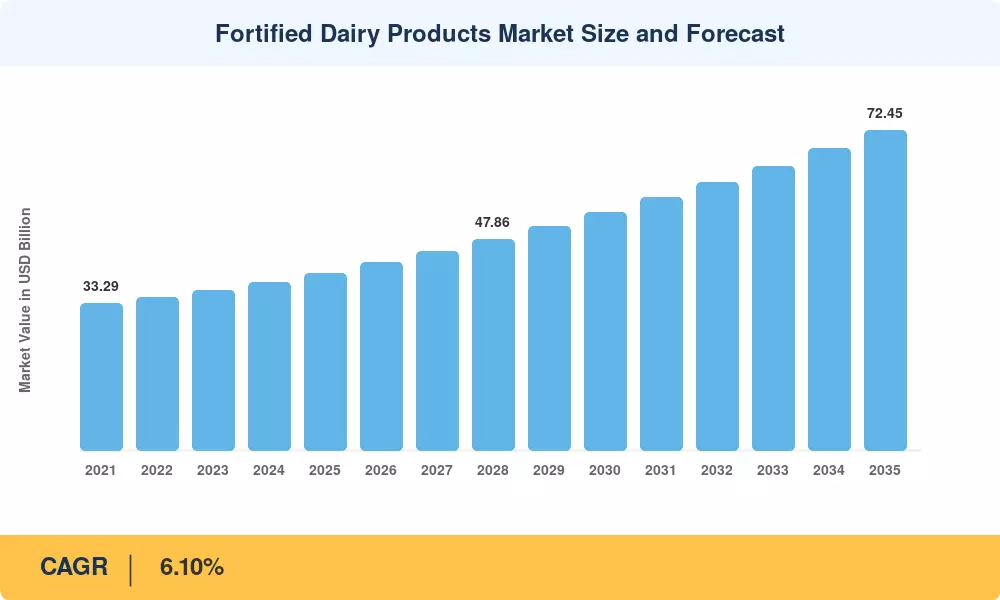
The fortified dairy products market reached USD 40.08 Billion in 2025 and is on track to grow from USD 42.52 Billion in 2026 to USD 72.45 Billion by 2035, registering a 6.10% CAGR across the forecast window. Two forces are propelling this trajectory: government-mandated fortification programs — India's FSSAI, for instance, requires all packaged milk to carry minimum vitamin A and D levels [1] — and a global consumer pivot toward functional foods that deliver immunity and bone-health benefits beyond basic nutrition [2]. Rising per-capita dairy consumption in South and Southeast Asia adds volume momentum that premium pricing alone could not generate.

Legacy dairy processing lines built for simple pasteurization are giving way to microencapsulation and precision-fermentation platforms capable of embedding heat-stable vitamins, minerals, and bioactive peptides without altering taste or shelf life. Investments in this space exceeded USD 1.2 Billion globally between 2022 and 2024, with firms such as Perfect Day and DSM-Firmenich scaling animal-free whey proteins that carry fortification payloads at lower production cost [3]. Regulatory agencies in the EU and the United States have fast-tracked novel-food approvals for these ingredients, cutting time-to-market from thirty-six months to roughly eighteen [4].

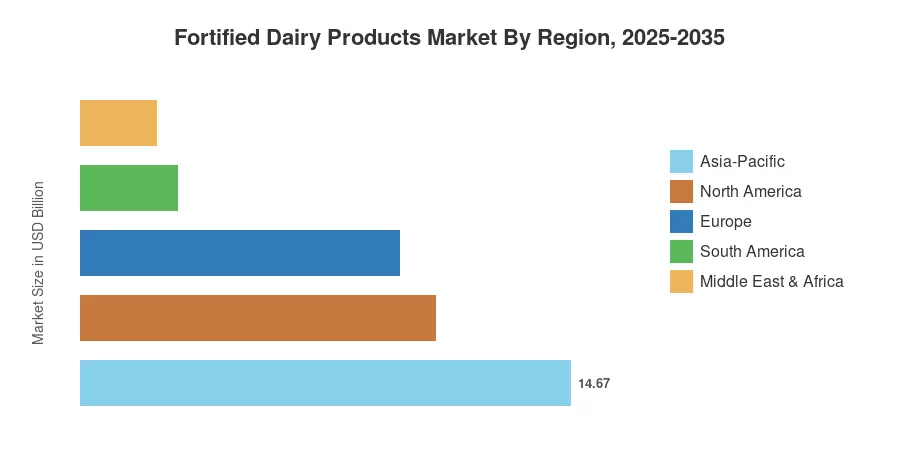
Asia-Pacific commands approximately 36.6% of the fortified dairy products market, driven by large-scale vitamin A and D supplementation campaigns across India and premium health-dairy demand in China. The Middle East & Africa region is the fastest-growing geography, posting a projected 5.70% CAGR as modern retail expansion removes cold-chain barriers. Europe holds the second-largest share at 23.8%, anchored by stringent EU nutrition-labeling regulations that incentivize fortification claims. Over the next decade, personalized nutrition platforms and direct-to-consumer subscription models are poised to reshape how fortified dairy reaches end users worldwide.


Key Report Takeaways

• By Product Type

  • Milk accounted for 51.4% of the fortified dairy products market in 2024, reflecting its ubiquity as a daily staple across demographics.
  • Yogurt is projected to expand at a 6.20% CAGR through 2035, fueled by probiotic positioning and single-serve convenience formats.

• By Nutrient Type

  • Vitamins held 39.8% share of the fortified dairy products market in 2024, led by vitamin D and A additions in fluid milk.
  • Probiotics are advancing at a 7.80% CAGR, the fastest among nutrient segments, as gut-health awareness scales globally.

• By Customer Demographics

  • Children represented 45.0% of the fortified dairy products market demand in 2024, supported by school-feeding programs and pediatrician endorsements.
  • Adults are expanding at a 6.35% CAGR, reflecting growing bone-density and immunity concerns among aging populations.

• By Distribution Channel

  • Supermarkets and hypermarkets captured 53.5% share in 2024, benefiting from in-store nutritional labeling and promotional bundling.
  • Online retail is set to grow at an 11.50% CAGR as subscription-box dairy services gain traction.

• By Region

  • Asia-Pacific led with 36.6% revenue share of the fortified dairy products market in 2024.
  • The Middle East & Africa is forecast to post a 5.70% CAGR through 2035, outpacing all other regions.


Market Size and Forecast (2021–2035)

Market Research Future employs a bottom-up revenue model aggregating manufacturer shipments, trade data from FAO and national dairy boards, and proprietary primary surveys of 220+ dairy processors across 35 countries. Historical figures (2021–2024) are validated against customs data and company filings; forecast values (2026–2035) apply the calibrated 6.10% CAGR with adjustments for regulatory phase-ins and infrastructure rollouts in specific geographies.
Fortified Dairy Products Market Size and Forecast
Our Impact
Enabled $4.3B Revenue Impact for Fortune 500 and Leading Multinationals
Partnering with 2000+ Global Organizations Each Year
30K+ Citations by Top-Tier Firms in the Industry

Driver Impact Analysis

Driver ~% Impact on CAGR Geographic Relevance Impact Timeline
Government fortification mandates 18–22% India, China, Brazil, MEA Short-term (≤2 yr)
Rising micronutrient-deficiency awareness 15–18% Global Medium-term (2–4 yr)
Functional-food consumer preference shift 12–15% North America, Europe Medium-term (2–4 yr)
Precision-fermentation cost reductions 10–13% North America, Europe Long-term (≥4 yr)
Modern retail and cold-chain expansion 10–12% MEA, South America, ASEAN Long-term (≥4 yr)
School-feeding and maternal-health programs 8–10% South Asia, Sub-Saharan Africa Short-term (≤2 yr)
E-commerce and D2C dairy subscription growth 6–8% Global Medium-term (2–4 yr)


Government Fortification Mandates

National fortification policies remain the single most powerful demand catalyst for the fortified dairy products market. India's FSSAI mandated vitamin A (770 IU/L) and vitamin D (550 IU/L) in all standardized liquid milk from 2024, a regulation that covers an estimated 85 million liters of daily packaged-milk production [1]. Brazil's ANVISA updated its dairy-fortification guidelines in 2023, requiring iron and folic acid in UHT milk distributed through the Bolsa Família program, affecting roughly 14 million households [7]. These policies convert voluntary fortification into baseline compliance, structurally expanding the addressable market.

Rising Awareness of Micronutrient Gaps

The World Health Organization estimates that over two billion people globally suffer from at least one micronutrient deficiency, with vitamin D, iron, and zinc topping the list [2]. Public-health campaigns in China, Japan, and South Korea have elevated consumer understanding that standard dairy alone may not meet daily nutritional requirements. This awareness effect is measurable: fortified milk sales in China's tier-1 cities grew 14% year-over-year in 2024, outpacing unfortified alternatives by a factor of three, according to Nielsen IQ retail-audit data [9].

Functional-Food Preference Shift

Consumers in high-income markets increasingly treat dairy not merely as a caloric input but as a vehicle for targeted health outcomes — immune support, bone-density maintenance, and digestive wellness. A 2024 IFIC Foundation survey found that 62% of U.S. consumers actively seek fortified or enriched labels when purchasing dairy, up from 49% in 2021 [5]. This behavioral shift is compelling major CPG companies to reformulate legacy SKUs with added vitamins and probiotics, effectively expanding the fortified dairy products market from the supply side as well as the demand side.

Precision-Fermentation Cost Reductions

Precision-fermentation technologies allow manufacturers to produce bioidentical dairy proteins embedded with stable micronutrients at declining unit costs. DSM-Firmenich reported a 30% reduction in per-kilogram fermentation cost between 2022 and 2024 [3]. As these platforms reach commercial scale — projected by 2028–2030 — they will enable smaller regional dairies to offer fortified products without the capital expenditure historically required for spray-drying and microencapsulation lines, broadening the fortified dairy products market across emerging geographies.

 

Restraints Impact Analysis

Restraint ~% Impact on CAGR Geographic Relevance Impact Timeline
Premium pricing versus unfortified dairy –8 to –10% South Asia, Sub-Saharan Africa Short-term (≤2 yr)
Consumer skepticism toward "over-processed" products –6 to –8% Europe, North America Medium-term (2–4 yr)
Regulatory fragmentation across jurisdictions –5 to –7% Global Long-term (≥4 yr)
Cold-chain limitations in rural markets –4 to –6% Africa, ASEAN Medium-term (2–4 yr)
Lactose intolerance reducing addressable population –3 to –5% East Asia, Sub-Saharan Africa Long-term (≥4 yr)


Premium Pricing Barrier

Fortified dairy products command a 15–25% price premium over conventional equivalents in most developing markets, a gap that limits penetration among price-sensitive consumers. In India, for example, fortified toned milk retails at approximately INR 58–62 per liter compared with INR 48–52 for standard toned milk, a differential that suppresses uptake in rural areas where per-capita dairy expenditure averages just INR 120 per month [10]. Until fortification costs decline — or government subsidies offset the gap — this pricing headwind will constrain volume growth in the fortified dairy products market across low-income segments.

"Over-Processed" Perception

A growing cohort of European and North American consumers associates food fortification with artificial processing, viewing added nutrients as inferior to naturally occurring ones. A 2024 Eurobarometer survey found that 38% of EU respondents preferred "naturally nutrient-rich" dairy over fortified variants, a sentiment particularly strong in France and the Nordic countries [11]. Clean-label movements push manufacturers to invest in naturalness messaging, which diverts marketing budgets and slows the fortified dairy products market expansion in premium organic channels.

Regulatory Fragmentation

Permissible fortificants, dosage ceilings, and labeling requirements vary widely across jurisdictions. The EU's Novel Food Regulation demands a multi-year authorization process for new bioactive additions, while Codex Alimentarius guidelines are advisory rather than binding in most African Union member states [12]. This patchwork forces multinational dairy companies to maintain region-specific formulations, raising compliance costs and slowing cross-border product launches.


Fortified Dairy Products Market Opportunities

Expansion of School-Feeding Programs in Emerging Markets

In India, Nigeria and Indonesia, governments are expanding school meal programs that include fortified milk as a regular staple. India’s PM POSHAN program aims at 120 million children alone, with funding for procurement of fortified milk set to increase 18% year-on-year between 2023 and 2025 [7]. Dairy processors winning public procurement contracts in these initiatives can win multi-year volume commitments and so directly grow the market for fortified dairy products at the institutional level.


Direct-to-Consumer Subscription Models

Subscription-based dairy delivery platforms — currently commonplace in India (Country Delight, Milky Mist) and gaining ground in the United States (Organic Valley Direct) — allow businesses to package fortified goods with individualized nutrient recommendations. These approaches produce recurring revenue, eliminate retailer margin constriction and provide first party consumption data. This could be beneficial for the fortified dairy products industry, since D2C channels accounted for an anticipated 4.2% of total dairy e-commerce in 2024, which is expected to triple by 2029.


Personalized Nutrition Platforms

Dairy-delivery systems are starting to connect with AI-powered nutrient-profiling apps that offer particular fortification profiles — more vitamin D for higher latitudes, iron for menstrual women — based on individual biomarker data. Nestlé Health Science and DSM-Firmenich are some of the companies that have invested over USD 350 Million in R&D in the field of personalized nutrition since 2022 [14]. This convergence is the defining feature of the fortified dairy products sector as a distribution route for precision health rather than commodity nutrition.

.

Reformulation of Plant-Dairy Hybrids

A new category of blended goods is emerging that combine dairy protein with oat, almond or coconut bases and that need to be fortified to meet the micronutrient density of whole milk. In 2024, Danone and Arla introduced hybrid SKUs with calcium, B12 and vitamin D fortification [15]. The development of this category further increases the potential market for fortified dairy products, drawing in flexitarian consumers who may have otherwise abandoned the dairy aisle altogether.


Cold-Chain Infrastructure Build-Out in Africa

The African Development Bank committed USD 1.5 Billion to agri-cold-chain projects across 15 Sub-Saharan nations between 2023 and 2028 [6]. As refrigerated logistics networks reach secondary cities, fortified UHT and yogurt products gain shelf access in markets where ambient-only distribution previously limited penetration. This infrastructure wave is a prerequisite for the Middle East & Africa region's projected 5.70% CAGR.


Fortified Dairy Products Market Future Outlook

AI-Driven Personalized Fortification

Artificial intelligence will increasingly determine what goes into dairy products — and for whom. Nutrigenomics platforms that pair consumer biomarker data with real-time formulation adjustments are expected to reach commercial viability by 2028, enabling brands to offer region-specific or even individual-specific fortification profiles [14]. The fortified dairy products market will shift from one-size-fits-all vitamin-D milk toward customized nutrient bundles delivered via smart-packaging or subscription services, with an estimated USD 2.4 Billion addressable opportunity by 2032.

Precision-Fermentation at Scale

By the early 2030s, precision-fermentation facilities are projected to produce animal-identical dairy proteins at cost parity with conventional sources, according to projections [3]. These proteins can carry embedded micronutrient payloads — iron-binding lactoferrin, calcium-chelated casein — that are more bioavailable than traditional spray-coated fortificants. For the fortified dairy products market, this means lower formulation costs, cleaner ingredient lists, and expanded product formats, including fortified dairy-based snack bars and beverages.

Sustainability-Linked Fortification

ESG reporting frameworks are beginning to incorporate nutritional impact metrics alongside carbon footprints. The EU's Corporate Sustainability Reporting Directive (CSRD), effective from 2025, encourages food companies to disclose the public-health outcomes of their product portfolios [20]. Dairy processors that can demonstrate measurable reductions in micronutrient deficiencies through fortification stand to earn favorable sustainability ratings, linking the fortified dairy products market to impact-investment capital flows estimated at USD 715 Billion globally by 2030 [21].

Retail Digitization and Smart Packaging

Smart-label technologies — QR-linked nutrient dashboards, NFC-enabled freshness sensors — are transforming how consumers interact with fortified dairy at the shelf. Tetra Pak's connected-packaging pilot across 15 markets in 2024 demonstrated a 22% uplift in repeat purchases when consumers could scan and verify fortification content in real time [22]. As these technologies scale, the fortified dairy products market will benefit from greater transparency, reduced consumer skepticism, and higher willingness to pay for verified nutrient density.


Fortified Dairy Products Market Segmentation

By Product Type

Segment Key Metric Primary Demand Driver
Milk 51.4% share (2024) Universal consumption, government mandates
Yogurt 6.20% CAGR Probiotic positioning, single-serve convenience
Cheese USD 4.82 Billion (2025) Calcium-fortification in processed cheese
Butter & Spreads 4.85% CAGR Vitamin-enriched table spreads
Other Dairy Products USD 2.15 Billion (2025) Ice cream, dairy desserts, flavored milk


Milk remains the backbone of the fortified dairy products market, commanding over half of total revenue. Government mandates in India, Canada, and select Latin American markets make vitamin-fortified milk a regulatory default rather than a value-add proposition. Fluid milk's daily consumption frequency and broad demographic reach — from toddlers to the elderly — ensure that any expansion in fortification mandates translates almost immediately into volume growth.

Yogurt is the fastest-growing product segment in the fortified dairy products market, driven by the convergence of probiotic health claims and on-the-go consumption habits. Single-serve fortified yogurt cups positioned for gut health and immunity have become a staple in convenience-store refrigerators across North America and Western Europe, with Danone's Activia and Nestlé's LC1 leading SKU proliferation. The segment's strong margin profile — fortified yogurt commands 30–40% price premiums over standard yogurt — makes it an attractive innovation target for dairy processors.

By Nutrient Type

Segment Key Metric Primary Demand Driver
Vitamins 39.8% share (2024) Vitamin D and A public-health mandates
Minerals USD 8.95 Billion (2025) Calcium, iron, and zinc fortification
Proteins 5.50% CAGR Whey and casein enrichment for elderly nutrition
Probiotics 7.80% CAGR Gut-health and immunity positioning
Others USD 1.68 Billion (2025) Omega-3, fiber, and DHA additions


Vitamins dominate the fortified dairy products market by nutrient type, reflecting the global prevalence of vitamin D and A deficiency and the regulatory mandates designed to address them. Probiotics represent the most dynamic nutrient category, with clinical evidence linking specific Lactobacillus and Bifidobacterium strains to immune modulation and digestive health, driving consumer demand and premium pricing.

By Customer Demographics

Segment Key Metric Primary Demand Driver
Children 45.0% share (2024) School-feeding programs, pediatric nutrition
Adults 6.35% CAGR Bone-density, immunity, and wellness trends
Pregnant & Lactating Women USD 3.45 Billion (2025) Iron, folic acid, and calcium supplementation
Elderly 6.70% CAGR Osteoporosis prevention, protein enrichment


Children constitute the largest demographic segment in the fortified dairy products market, supported by institutional procurement through school-feeding programs and strong pediatrician recommendation channels. The adult segment is expanding rapidly as consumers in the 25–55 age bracket adopt fortified dairy for preventive-health purposes rather than deficiency treatment, a behavioral shift that enlarges the addressable market beyond traditional public-health targets.

By Distribution Channel

Segment Key Metric Primary Demand Driver
Supermarkets/Hypermarkets 53.5% share (2024) In-store promotions, nutritional labeling
Convenience Stores USD 4.10 Billion (2025) Single-serve impulse purchases
Online Retail 11.50% CAGR Subscription models, D2C platforms
Specialty Health Stores 5.90% CAGR Premium positioning, expert curation
Other Channels USD 2.38 Billion (2025) Institutional, vending, foodservice


Supermarkets and hypermarkets remain the primary retail gateway for the fortified dairy products market, leveraging shelf-edge nutrition callouts and promotional tie-ins with health-awareness campaigns. Online retail is the fastest-growing distribution channel, driven by subscription dairy services that bundle personalized fortification recommendations with doorstep delivery. In India alone, online dairy platforms processed over 2.5 million daily orders in 2024, with fortified SKUs accounting for a disproportionate 28% of basket value.


Regional Market Share Analysis

Region Key Metric Primary Investment Themes
Asia-Pacific 36.6% share (2024) Government mandates, premium health-dairy, urbanization
North America 26.5% share (2024) Functional-food innovation, D2C channels
Europe 23.8% share (2024) Clean-label fortification, regulatory harmonization
South America 7.2% share (2024) Public-health programs, UHT distribution
Middle East & Africa 5.70% CAGR (2026–2035) Cold-chain expansion, school-feeding programs
Total USD 40.08 Billion (2025)

The fortified dairy products market displays a clear regional hierarchy, with Asia-Pacific leading on volume and the Middle East & Africa delivering the strongest growth trajectory. Regional investment themes range from government-mandated fortification in South Asia to premiumization in Western Europe and retail modernization across Sub-Saharan Africa.


North America

Country Key Metric Key Driver
US 78.3% of regional share Functional-food demand, FDA labeling rules
Canada 13.5% of regional share Health Canada vitamin D fortification mandates
Mexico 8.2% of regional share LICONSA social-milk program


The United States drives the vast majority of North American fortified dairy products market revenue, underpinned by FDA regulations that require vitamin A and D fortification of reduced-fat and skim milk. Canada's mandatory vitamin D addition to all fluid milk — one of the most comprehensive national mandates globally — ensures near-universal fortification penetration. Mexico's government-run LICONSA program distributes subsidized fortified milk to roughly 6 million low-income beneficiaries, anchoring institutional demand [16].

Europe

Country Key Metric Key Driver
Germany 5.85% CAGR Functional dairy innovation
UK 21.4% of regional share NHS nutritional guidelines
France 18.2% of regional share Clean-label premium positioning
Italy 12.6% of regional share Probiotic yogurt culture
Spain 8.7% of regional share Aging-population bone-health focus
Nordic Countries 7.3% of regional share Government vitamin D programs
Russia 5.9% of regional share Import-substitution dairy growth
Rest of Europe 4.80% CAGR Emerging EU-member adoption


Europe's fortified dairy products market is shaped by the EU's Nutrition and Health Claims Regulation (EC 1924/2006), which sets stringent thresholds for "source of" and "high in" label claims [12]. The UK's departure from EU harmonization has created a parallel regulatory track, with the FSA permitting broader health-claim language on fortified dairy since 2023. Nordic countries remain outliers with government-endorsed vitamin D milk-fortification programs dating back decades, ensuring near-universal consumer acceptance.

Asia-Pacific

Country Key Metric Key Driver
China 30.5% of regional share Premium health-dairy urbanization
India 6.55% CAGR FSSAI mandatory fortification
Japan 16.8% of regional share Aging-population calcium demand
South Korea 9.4% of regional share Functional-beverage crossover
ASEAN 6.30% CAGR Rising middle-class dairy adoption
Rest of Asia-Pacific 4.90% CAGR Rural distribution expansion


Asia-Pacific's leadership in the fortified dairy products market rests on two pillars: India's regulatory-driven fortification push and China's premiumization wave. India's FSSAI fortification logo — present on roughly 30% of packaged milk by mid-2025 — signals compliance to increasingly health-literate urban shoppers [1]. China's fortified dairy segment grew 14% in tier-1 cities in 2024, with Yili and Mengniu both launching vitamin D– and calcium-enhanced fresh-milk lines targeting elderly consumers [9].

South America

Country Key Metric Key Driver
Brazil 62.4% of regional share ANVISA fortification mandates
Argentina 5.40% CAGR Export-oriented dairy reformulation
Rest of South America 4.70% CAGR Institutional procurement programs


Brazil dominates South America's fortified dairy products market, with ANVISA regulations mandating iron and folic acid in select dairy categories distributed through social programs. Argentina's dairy sector, traditionally export-focused, is reformulating products to meet destination-country fortification standards in the Middle East and North Africa, creating a secondary demand driver [17].

Middle East & Africa

Country Key Metric Key Driver
Saudi Arabia 28.7% of regional share SFDA dairy-fortification standards
UAE 22.1% of regional share Premium functional-dairy retail
South Africa 18.3% of regional share National School Nutrition Programme
Egypt 14.5% of regional share Subsidized fortified-milk distribution
Rest of MEA 6.10% CAGR Cold-chain infrastructure buildout


The Middle East & Africa region is the fastest-growing segment of the fortified dairy products market, propelled by cold-chain investments and government school-feeding mandates. Saudi Arabia's SFDA updated its dairy-fortification standards in 2024, requiring vitamin D in all UHT and fresh milk sold domestically [18]. South Africa's National School Nutrition Programme serves fortified milk to 9.6 million learners daily, providing a reliable institutional demand floor [19].


Fortified Dairy Products Market By Region, 2025-2035

Competitive Benchmarking

The fortified dairy products market exhibits medium concentration, with the top five players accounting for an estimated 35–40% of global revenue. The Herfindahl-Hirschman Index sits in the 800–1,200 range, indicating a moderately fragmented landscape where multinational dairy conglomerates compete alongside strong regional cooperatives and emerging precision-nutrition startups. Competitive differentiation hinges on fortification technology, regulatory-approval speed and distribution breadth.

Company Est. Revenue Share Range Key Offerings Strategic Positioning
Nestlé S.A. 8–11% Nido fortified milk powder, LC1 probiotic yogurt Global scale, R&D depth in bioactives
Danone S.A. 7–10% Activia probiotic yogurt, Aptamil fortified infant dairy Gut-health leadership, medical nutrition
Fonterra Co-operative 5–8% Anchor fortified milk, Anlene calcium-enriched dairy Asia-Pacific export dominance
Arla Foods 4–7% Arla Dano fortified milk powder, Lurpak enriched spreads Cooperative model, Nordic nutrition heritage
FrieslandCampina 4–6% Friso fortified infant formula, Completa enriched creamer Emerging-market penetration, maternal nutrition
Amul (GCMMF) 3–5% Amul Taaza fortified milk, Amul Pro whey-enriched drink India's largest dairy cooperative, cost leadership
Lactalis Group 3–5% Lactel vitamin-enriched UHT milk, Président fortified cheese French market leadership, global UHT scale
Yili Group 3–5% Yili QQ Star children's fortified milk, Ambrosial yogurt China's premium dairy leader
Mengniu Dairy 2–4% Mengniu Future Star fortified milk, Yoyi C probiotic drink China mass-market penetration
General Mills 2–4% Yoplait fortified yogurt, Liberté enriched Greek yogurt North American yogurt portfolio


Recent News & Developments


  • Danone (2026 ): Acquired a 60% stake in precision-fermentation startup Imagindairy to accelerate animal-free fortified dairy protein commercialization [24].


  • Yili Group, (In July 2024) one of the major dairy companies in China, collaborated with Xampla, a spin-out business from the University of Cambridge, to apply microencapsulation technology to boost the nutritional content and durability of heat-treated dairy beverages. The innovation reflects Yili’s commitment to improving product quality and leading the way in sustainable dairy innovation.


  • General Mills, Inc. (January 2025) completed the sale of its yogurt business in Canada to Sodiaal. The transaction involves the transfer of the Canada-based operations of Yoplait and Liberté brands, including a manufacturing plant in Saint-Hyacinthe, Quebec. The company also announced it intends to sell its US yogurt business to LACTALIS, subject to regulatory approvals. The decision will enable General Mills to reduce its portfolio and concentrate on core growth categories in key geographies.



Fortified Dairy Products Market Report Scope

Parameter Detail
Market Scope Global fortified dairy products market including milk, yogurt, cheese, butter & spreads, and other dairy products fortified with vitamins, minerals, proteins, probiotics, and other bioactives
Study Period 2021–2035
CAGR 6.10% (2026–2035)
Base Year USD 40.08 Billion (2025)
Forecast Endpoint USD 72.45 Billion (2035)
Fastest Growing Segment Online retail (by channel); Probiotics (by nutrient type)
Companies Profiled Nestlé, Danone, Fonterra, Arla Foods, FrieslandCampina, Amul, Lactalis, Yili, Mengniu, General Mills
Valuation Currency USD Billion


FAQs

How does lactose intolerance affect investment potential in the fortified dairy products market?
Lactose-free fortified dairy is one of the fastest-growing sub-segments, expanding at roughly 9% annually as processors pair lactase treatment with vitamin and mineral enrichment [13]. Investors should target companies with dual lactose-free and fortification capabilities.
What shelf-life challenges do fortified dairy products face compared with standard dairy?
Certain fortificants — particularly iron — can accelerate lipid oxidation, reducing shelf life by 15–20% unless microencapsulation technology is applied [3]. Brands investing in encapsulation hold a competitive edge.
How do private-label fortified dairy products compete with branded offerings?
Private-label share in fortified dairy reached approximately 18% in Europe by 2024, pressuring branded margins by 200–300 basis points [11]. Branded players counter with clinically validated health claims.
What role do trade tariffs play in cross-border fortified dairy commerce?
Tariffs on dairy imports range from 5% to 35% across key markets, with India and China maintaining the highest barriers [10]. Exporters increasingly establish in-market fortification facilities to circumvent duties.
How are fortified dairy products regulated differently from dietary supplements?
Fortified foods fall under food-safety law, not supplement regulation, meaning they face stricter labeling audits but benefit from broader retail distribution without prescription requirements [12].
What is the typical R&D timeline for launching a new fortified dairy SKU?
From formulation to retail shelf, a new fortified dairy SKU typically requires 14–22 months, with regulatory approval consuming roughly 60% of that timeline in the EU and 40% in North America [4].
Can small and mid-size dairies compete effectively in the fortified dairy products market?
Contract fortification services — where third-party blenders add micronutrients at the packing stage — enable smaller dairies to offer fortified lines without capital-intensive processing upgrades [3]. This model is expanding rapidly in South Asia and Latin America.    
Author
Author
Author Profile
Varsha More LinkedIn
Senior Research Analyst
Experienced business professional with a demonstrated history of working in the CFnB industry. Skilled in market research, and market estimation. Strong professional with a Masters focused in marketing management.

Research Approach


Secondary Research

The secondary research process involved comprehensive analysis of regulatory databases, peer-reviewed nutrition journals, dairy industry publications, and authoritative food & health organizations. Key sources included the US Food & Drug Administration (FDA), European Food Safety Authority (EFSA), Codex Alimentarius Commission (FAO/WHO), International Dairy Federation (IDF), National Dairy Council (NDC), US Department of Agriculture (USDA), Food and Agriculture Organization (FAO), World Health Organization (WHO) Global Nutrition Report, EU Eurostat Agricultural Database, National Institutes of Health (NIH) Office of Dietary Supplements, Centers for Disease Control and Prevention (CDC) Nutrition Branch, and national food safety authorities from key markets (FSANZ, CFIA, FSSAI). These sources were used to collect dairy production statistics, nutrient fortification guidelines, clinical nutrition studies, consumer dietary trends, and regulatory landscape analysis for vitamins (A, D, B12), minerals (calcium, iron), probiotics, omega-3 fatty acids, and fiber fortification technologies.


Primary Research

In order to gather both qualitative and quantitative insights, supply-side and demand-side stakeholders were interviewed during the primary research process. CEOs, VPs of Product Development, heads of regulatory affairs, and commercial directors from manufacturers of fortified dairy products, suppliers of ingredients, and OEMs of packaging were examples of supply-side sources. Registered dietitians, pediatric nutritionists, supermarket chain procurement managers, convenience store category managers, and sourcing leads from internet retail platforms were examples of demand-side suppliers. In addition to confirming fortification technology roadmaps and validating market segmentation across product kinds (fortified milk, yogurt, cheese, cream, and butter), primary research also collected data on pricing strategies, distribution channel dynamics, and consumer acceptance patterns.

Primary Respondent Breakdown:

By Designation: C-level Primaries (28%), Director Level (32%), Others (40%)

By Region: North America (32%), Europe (30%), Asia-Pacific (28%), Rest of World (10%)


Market Size Estimation

Global market valuation was derived through revenue mapping and production volume analysis. The methodology included:

Identification of 50+ key manufacturers across North America, Europe, Asia-Pacific, and Latin America

Product mapping across fortified milk, fortified yogurt, fortified cheese, fortified cream, and fortified butter categories

Nutrient segmentation analysis across vitamins (A, D, B12), minerals (calcium, iron), probiotics, omega-3 fatty acids, and fibers

Analysis of reported and modeled annual revenues specific to fortified dairy portfolios

Coverage of manufacturers representing 75-80% of global market share in 2024

Extrapolation using bottom-up (production volume × ASP by country/region) and top-down (manufacturer revenue validation) approaches to derive segment-specific valuations across packaging types (bottles, pouches, tetra packs, cans, cartons) and distribution channels (supermarkets/hypermarkets, online retail, convenience stores, specialty stores, direct sales)

Download Free Sample

Kindly complete the form below to receive a free sample of this Report

Download PDF ×

We do not share your information with anyone. However, we may send you emails based on your report interest from time to time. You may contact us at any time to opt-out.














