Fortified Dairy Products Market (2026 - 2035)

ID: MRFR/FnB/30272-HCR
128 Pages
Varsha More
Last Updated: July 12, 2026
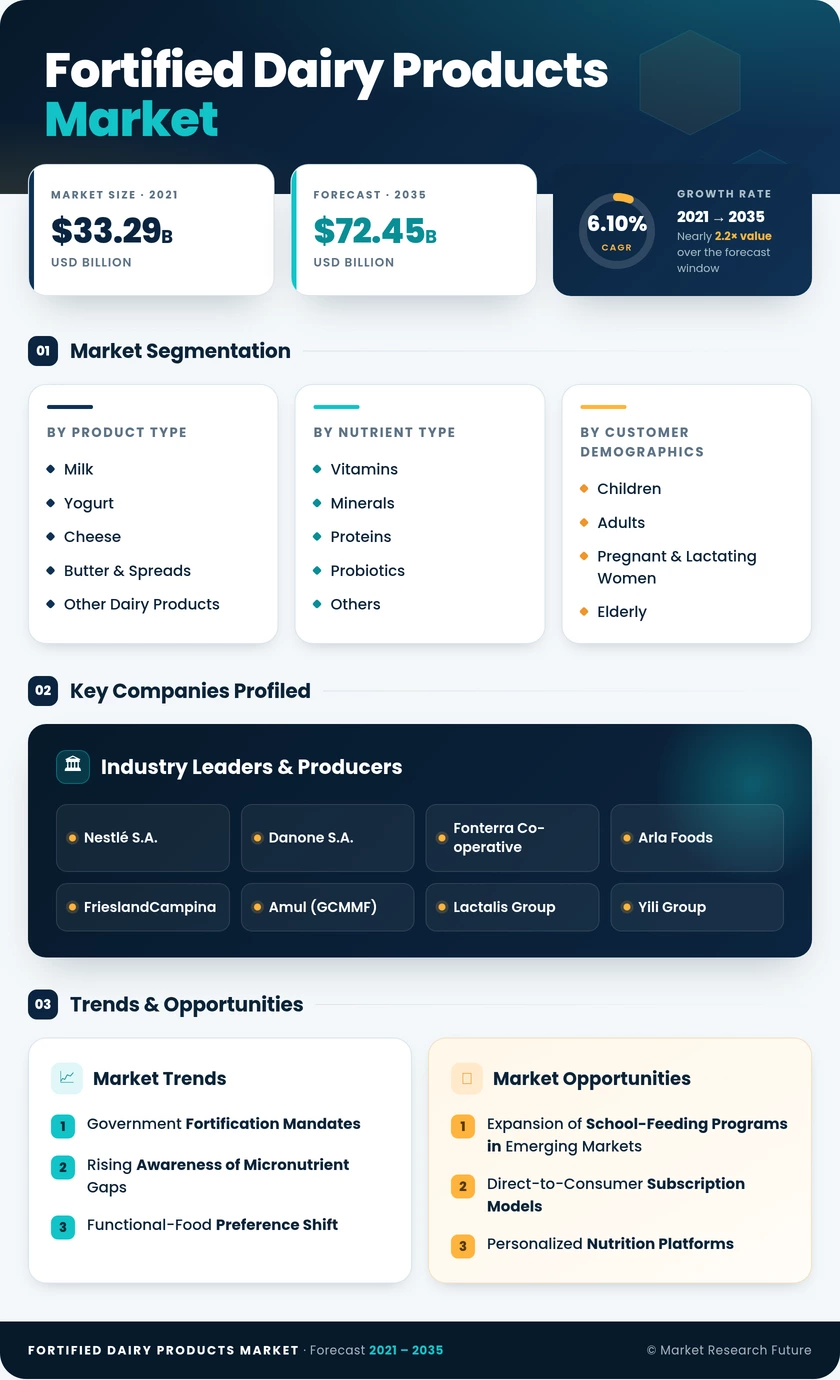
Fortified Dairy Products Market Size, Share, Industry Trend & Analysis Research Report By Product Type (Milk, Yogurt, Cheese, Butter & Spreads, Other Dairy Products), By Nutrient Type (Vitamins, Minerals, Proteins, Probiotics, Others), By Customer Demographics (Children, Adults, Pregnant & Lactating Women, Elderly), By Distribution Channel (Supermarkets/Hypermarkets, Convenience Stores, Online Retail, Specialty Health Stores, Other Channels), By Geography (North America, Europe, Asia-Pacific, South America, Middle East & Africa) - Forecast to 2035
Fortified Dairy Products Market
Market Size
Forecast Period2026-2035
CAGR (2026-2035)6.10%
2025 Market SizeUSD 40.08 Billion
2035 Market SizeUSD 72.45 Billion
Key Players
Nestlé S.A.
Danone S.A.
Fonterra Co-operative
Arla Foods
FrieslandCampina
Amul
Opportunities
  • Expansion of School-Feeding Programs in Emerging Markets
  • Direct-to-Consumer Subscription Models
  • Personalized Nutrition Platforms
  1. 1 Market Summary |
    1. 1.1 Study Assumptions & Market Definition |
    2. 1.2 Scope of the Study |
    3. 1.3 Research Methodology
  2. 2 Key Report Takeaways
  3. 3 Market Size and Forecast (2021–2035) |
    1. 3.1 Historical Market Size (2021–2025) |
    2. 3.2 Forecast Market Size (2026–2035) |
    3. 3.3 Market Size by Revenue (USD Billion) |
    4. 3.4 Year-over-Year Growth Analysis
  4. 4 Market Dynamics — Driver Impact Analysis |
    1. 4.1 Government Fortification Mandates |
    2. 4.2 Rising Awareness of Micronutrient Gaps |
    3. 4.3 Functional-Food Preference Shift |
    4. 4.4 Precision-Fermentation Cost Reductions
  5. 5 Market Dynamics — Restraints Impact Analysis |
    1. 5.1 Premium Pricing Barrier |
    2. 5.2 "Over-Processed" Perception |
    3. 5.3 Regulatory Fragmentation
  6. 6 Opportunities |
    1. 6.1 Expansion of School-Feeding Programs in Emerging Markets |
    2. 6.2 Direct-to-Consumer Subscription Models |
    3. 6.3 Personalized Nutrition Platforms |
    4. 6.4 Reformulation of Plant-Dairy Hybrids |
    5. 6.5 Cold-Chain Infrastructure Build-Out in Africa
  7. 7 Regional Market Share and Country-Level Analysis |
    1. 7.1 North America | |
      1. 7.1.1 United States | |
      2. 7.1.2 Canada | |
      3. 7.1.3 Mexico |
    2. 7.2 Europe | |
      1. 7.2.1 Germany | |
      2. 7.2.2 United Kingdom | |
      3. 7.2.3 France | |
      4. 7.2.4 Italy | |
      5. 7.2.5 Spain | |
      6. 7.2.6 Nordic Countries | |
      7. 7.2.7 Russia | |
      8. 7.2.8 Rest of Europe |
    3. 7.3 Asia-Pacific | |
      1. 7.3.1 China | |
      2. 7.3.2 India | |
      3. 7.3.3 Japan | |
      4. 7.3.4 South Korea | |
      5. 7.3.5 ASEAN | |
      6. 7.3.6 Rest of Asia-Pacific |
    4. 7.4 South America | |
      1. 7.4.1 Brazil | |
      2. 7.4.2 Argentina | |
      3. 7.4.3 Rest of South America |
    5. 7.5 Middle East & Africa | |
      1. 7.5.1 Saudi Arabia | |
      2. 7.5.2 UAE | |
      3. 7.5.3 South Africa | |
      4. 7.5.4 Egypt | |
      5. 7.5.5 Rest of MEA
  8. 8 Future Outlook (2026–2035) |
    1. 8.1 AI-Driven Personalized Fortification |
    2. 8.2 Precision-Fermentation at Scale |
    3. 8.3 Sustainability-Linked Fortification |
    4. 8.4 Retail Digitization and Smart Packaging
  9. 9 Market Segmentation Analysis |
    1. 9.1 By Product Type | |
      1. 9.1.1 Milk | |
      2. 9.1.2 Yogurt | |
      3. 9.1.3 Cheese | |
      4. 9.1.4 Butter & Spreads | |
      5. 9.1.5 Other Dairy Products |
    2. 9.2 By Nutrient Type | |
      1. 9.2.1 Vitamins | |
      2. 9.2.2 Minerals | |
      3. 9.2.3 Proteins | |
      4. 9.2.4 Probiotics | |
      5. 9.2.5 Others |
    3. 9.3 By Customer Demographics | |
      1. 9.3.1 Children | |
      2. 9.3.2 Adults | |
      3. 9.3.3 Pregnant & Lactating Women | |
      4. 9.3.4 Elderly |
    4. 9.4 By Distribution Channel | |
      1. 9.4.1 Supermarkets/Hypermarkets | |
      2. 9.4.2 Convenience Stores | |
      3. 9.4.3 Online Retail | |
      4. 9.4.4 Specialty Health Stores | |
      5. 9.4.5 Other Channels
  10. 10 Competitive Landscape |
    1. 10.1 Market Share Analysis (2025) |
    2. 10.2 Competitive Benchmarking Matrix |
    3. 10.3 Company Profiles | |
      1. 10.3.1 Nestlé S.A. | |
      2. 10.3.2 Danone S.A. | |
      3. 10.3.3 Fonterra Co-operative | |
      4. 10.3.4 Arla Foods | |
      5. 10.3.5 FrieslandCampina | |
      6. 10.3.6 Amul (GCMMF) | |
      7. 10.3.7 Lactalis Group | |
      8. 10.3.8 Yili Group | |
      9. 10.3.9 Mengniu Dairy | |
      10. 10.3.10 General Mills
  11. 11 Recent News & Developments
  12. 12 Report Scope & Methodology |
    1. 12.1 Study Period & Base Year |
    2. 12.2 Data Sources & Citations |
    3. 12.3 Abbreviations
  13. 13 Detailed Sources and Citations
  14. 14 Frequently Asked Questions (FAQs)
  15. 15 LIST OF TABLES |
  16. TABLE 1 Global Fortified Dairy Products Market Size & Forecast, by Revenue (USD Billion), 2021–2035 |
  17. TABLE 2 Global Fortified Dairy Products Market — Year-over-Year Growth Analysis, 2021–2035 |
  18. TABLE 3 Global Fortified Dairy Products Market — Driver Impact Analysis |
  19. TABLE 4 Global Fortified Dairy Products Market — Restraints Impact Analysis |
  20. TABLE 5 Global Fortified Dairy Products Market Size, by Product Type, 2021–2035 (USD Billion) |
  21. TABLE 6 Global Fortified Dairy Products Market Size, by Nutrient Type, 2021–2035 (USD Billion) |
  22. TABLE 7 Global Fortified Dairy Products Market Size, by Customer Demographics, 2021–2035 (USD Billion) |
  23. TABLE 8 Global Fortified Dairy Products Market Size, by Distribution Channel, 2021–2035 (USD Billion) |
  24. TABLE 9 Global Fortified Dairy Products Market Size, by Region, 2021–2035 (USD Billion) |
  25. TABLE 10 North America Fortified Dairy Products Market Size, by Country, 2021–2035 (USD Billion) |
  26. TABLE 11 Europe Fortified Dairy Products Market Size, by Country, 2021–2035 (USD Billion) |
  27. TABLE 12 Asia-Pacific Fortified Dairy Products Market Size, by Country, 2021–2035 (USD Billion) |
  28. TABLE 13 South America Fortified Dairy Products Market Size, by Country, 2021–2035 (USD Billion) |
  29. TABLE 14 Middle East & Africa Fortified Dairy Products Market Size, by Country, 2021–2035 (USD Billion) |
  30. TABLE 15 Competitive Benchmarking Matrix — Global Fortified Dairy Products Market, 2025 |
  31. TABLE 16 Company Profiles — Key Players, Global Fortified Dairy Products Market |
  32. TABLE 17 Recent Developments & Strategic Announcements, 2023–2025 |
  33. TABLE 18 Report Scope and Methodology Summary |
  34. TABLE 19 Detailed Sources and Citations |
  35. TABLE 20 North America Fortified Dairy Products Market Size, by Product Type, 2021–2035 (USD Billion) |
  36. TABLE 21 North America Fortified Dairy Products Market Size, by Nutrient Type, 2021–2035 (USD Billion) |
  37. TABLE 22 North America Fortified Dairy Products Market Size, by Customer Demographics, 2021–2035 (USD Billion) |
  38. TABLE 23 North America Fortified Dairy Products Market Size, by Distribution Channel, 2021–2035 (USD Billion) |
  39. TABLE 24 Europe Fortified Dairy Products Market Size, by Product Type, 2021–2035 (USD Billion) |
  40. TABLE 25 Europe Fortified Dairy Products Market Size, by Nutrient Type, 2021–2035 (USD Billion) |
  41. TABLE 26 Europe Fortified Dairy Products Market Size, by Customer Demographics, 2021–2035 (USD Billion) |
  42. TABLE 27 Europe Fortified Dairy Products Market Size, by Distribution Channel, 2021–2035 (USD Billion) |
  43. TABLE 28 Asia-Pacific Fortified Dairy Products Market Size, by Product Type, 2021–2035 (USD Billion) |
  44. TABLE 29 Asia-Pacific Fortified Dairy Products Market Size, by Nutrient Type, 2021–2035 (USD Billion) |
  45. TABLE 30 Asia-Pacific Fortified Dairy Products Market Size, by Customer Demographics, 2021–2035 (USD Billion) |
  46. TABLE 31 Asia-Pacific Fortified Dairy Products Market Size, by Distribution Channel, 2021–2035 (USD Billion) |
  47. TABLE 32 South America Fortified Dairy Products Market Size, by Product Type, 2021–2035 (USD Billion) |
  48. TABLE 33 South America Fortified Dairy Products Market Size, by Nutrient Type, 2021–2035 (USD Billion) |
  49. TABLE 34 South America Fortified Dairy Products Market Size, by Customer Demographics, 2021–2035 (USD Billion) |
  50. TABLE 35 South America Fortified Dairy Products Market Size, by Distribution Channel, 2021–2035 (USD Billion) |
  51. TABLE 36 Middle East & Africa Fortified Dairy Products Market Size, by Product Type, 2021–2035 (USD Billion) |
  52. TABLE 37 Middle East & Africa Fortified Dairy Products Market Size, by Nutrient Type, 2021–2035 (USD Billion) |
  53. TABLE 38 Middle East & Africa Fortified Dairy Products Market Size, by Customer Demographics, 2021–2035 (USD Billion) |
  54. TABLE 39 Middle East & Africa Fortified Dairy Products Market Size, by Distribution Channel, 2021–2035 (USD Billion)
  55. 16 LIST OF FIGURES |
  56. FIGURE 1 Global Fortified Dairy Products Market Dynamics — Drivers, Restraints, Opportunities |
  57. FIGURE 2 Value Chain Analysis — Fortified Dairy Products Market |
  58. FIGURE 3 Porter's Five Forces Analysis — Fortified Dairy Products Market |
  59. FIGURE 4 Global Fortified Dairy Products Market Size Trend (USD Billion), 2021–2035 |
  60. FIGURE 5 Fortified Dairy Products Market Share, by Product Type (%), 2024 |
  61. FIGURE 6 Fortified Dairy Products Market Share, by Nutrient Type (%), 2024 |
  62. FIGURE 7 Fortified Dairy Products Market Share, by Customer Demographics (%), 2024 |
  63. FIGURE 8 Fortified Dairy Products Market Share, by Distribution Channel (%), 2024 |
  64. FIGURE 9 Fortified Dairy Products Market Share, by Region (%), 2024 |
  65. FIGURE 10 North America Fortified Dairy Products Market — Country Share (%), 2024 |
  66. FIGURE 11 Europe Fortified Dairy Products Market — Country Share (%), 2024 |
  67. FIGURE 12 Asia-Pacific Fortified Dairy Products Market — Country Share (%), 2024 |
  68. FIGURE 13 South America Fortified Dairy Products Market — Country Share (%), 2024 |
  69. FIGURE 14 Middle East & Africa Fortified Dairy Products Market — Country Share (%), 2024 |
  70. FIGURE 15 Competitive Landscape — Market Share Analysis, 2025 |
  71. FIGURE 16 Competitive Positioning Matrix — Key Players, 2025

Segmentation Quick Reference

DimensionSub-SegmentsDominant SegmentFastest Growing Segment
Product TypeMilk, Yogurt, Cheese, Butter & Spreads, Other Dairy ProductsMilkYogurt
Nutrient TypeVitamins, Minerals, Proteins, Probiotics, OthersVitaminsProbiotics
Customer DemographicsChildren, Adults, Pregnant & Lactating Women, ElderlyChildrenElderly
Distribution ChannelSupermarkets/Hypermarkets, Convenience Stores, Online Retail, Specialty Health Stores, Other ChannelsSupermarkets/HypermarketsOnline Retail
GeographyNorth America, Europe, Asia-Pacific, South America, Middle East & AfricaAsia-PacificMiddle East & Africa


Market Segmentation Overview

By Product Type

Sub-SegmentKey Trend
MilkGovernment-mandated fortification ensures baseline volume; premiumization drives value growth
YogurtProbiotic and immunity positioning fuels rapid expansion in convenience formats
CheeseCalcium and vitamin D fortification gaining traction in processed-cheese segments
Butter & SpreadsVitamin-enriched spreads targeting health-conscious breakfast consumers
Other Dairy ProductsFortified ice cream, flavored milk, and dairy desserts broadening category appeal


Milk and yogurt together account for the majority of fortified dairy products market revenue, with milk anchored by regulatory mandates and yogurt propelled by consumer-driven functional-health trends.

By Nutrient Type

Sub-SegmentKey Trend
VitaminsVitamin D and A remain the most widely added nutrients under government programs
MineralsCalcium, iron, and zinc fortification expanding in maternal and pediatric nutrition
ProteinsWhey and casein enrichment targeting elderly and sports-nutrition demographics
ProbioticsClinically validated strains commanding premium positioning in yogurt and fermented milk
OthersOmega-3, DHA, and dietary-fiber additions diversifying the fortificant palette


Vitamins and probiotics represent the two most strategically important nutrient categories, with vitamins driven by public-health policy and probiotics by consumer willingness to pay for gut-health benefits.

By Customer Demographics

Sub-SegmentKey Trend
ChildrenSchool-feeding programs and pediatric recommendations drive institutional procurement
AdultsPreventive-health adoption expanding the addressable market beyond deficiency treatment
Pregnant & Lactating WomenIron, folic acid, and calcium supplementation through fortified dairy channels
ElderlyProtein-enriched and calcium-fortified dairy targeting osteoporosis prevention


Children and adults together account for the largest share of consumption, though pregnant women and elderly segments deliver disproportionately higher per-capita value due to premium product positioning.

By Distribution Channel

Sub-SegmentKey Trend
Supermarkets/HypermarketsShelf-edge nutrition callouts and promotional bundling sustain channel dominance
Convenience StoresSingle-serve fortified yogurt and flavored milk driving impulse purchases
Online RetailSubscription models and D2C platforms delivering the fastest channel growth
Specialty Health StoresExpert curation and premium pricing supporting niche fortified-dairy brands
Other ChannelsInstitutional, vending, and foodservice distribution complementing retail


Modern retail and e-commerce channels are collectively reshaping how fortified dairy reaches consumers, with online retail's double-digit CAGR reflecting broader digitization of grocery shopping.

By Geography

Sub-SegmentKey Trend
North AmericaFDA fortification mandates and functional-food innovation sustain mature-market growth
EuropeEU health-claims regulation incentivizes reformulation; clean-label demands shape positioning
Asia-PacificGovernment programs in India and China premiumization drive regional leadership
South AmericaANVISA mandates and social-program procurement anchor institutional demand
Middle East & AfricaCold-chain expansion and school-feeding mandates power the fastest regional CAGR


Asia-Pacific's combination of regulatory push and consumer pull positions it as the dominant region, while the Middle East & Africa's infrastructure investments are unlocking previously inaccessible demand pools.


 

Download PDF ×

We do not share your information with anyone. However, we may send you emails based on your report interest from time to time. You may contact us at any time to opt-out.