GCC Glioma Diagnosis Treatment Market Segmentation
GCC Glioma Diagnosis Treatment Market By Type (USD Million, 2025-2035)
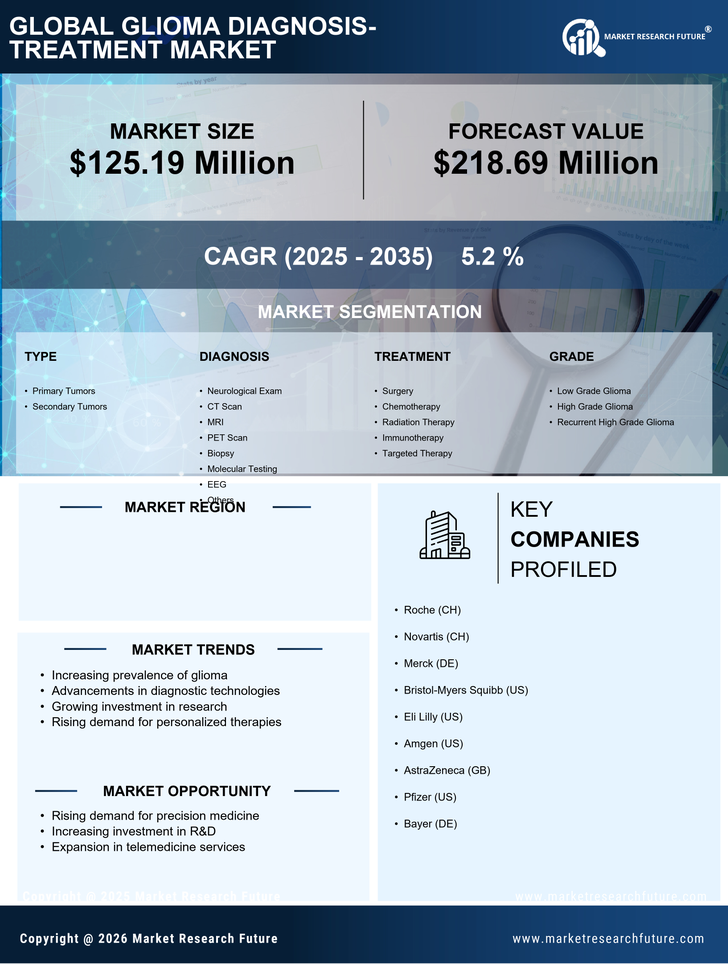
- Primary Tumors
- Secondary Tumors
GCC Glioma Diagnosis Treatment Market By Diagnosis (USD Million, 2025-2035)
- Neurological Exam
- CT Scan
- MRI
- PET Scan
- Biopsy
- Molecular Testing
- EEG
- Others
GCC Glioma Diagnosis Treatment Market By Treatment (USD Million, 2025-2035)
- Surgery
- Chemotherapy
- Radiation Therapy
- Immunotherapy
- Targeted Therapy
GCC Glioma Diagnosis Treatment Market By Grade (USD Million, 2025-2035)
- Low Grade Glioma
- High Grade Glioma
- Recurrent High Grade Glioma
GCC Glioma Diagnosis Treatment Market By Location (USD Million, 2025-2035)
- Supratentorial
- Infratentorial
GCC Glioma Diagnosis Treatment Market By End User (USD Million, 2025-2035)
- Hospitals & Clinics
- Diagnostic Centers
- Medical Research Centers
- Others