Gel Documentation Systems Market

Key Players: Bio-Rad Laboratories, Thermo Fisher Scientific, Cytiva (Danaher), Analytik Jena (Endress+Hauser), Syngene (Synoptics Group), Azure Biosystems, Vilber, LI-COR Biosciences

Gel Documentation Systems Market

Gel Documentation Systems Market Research Report Information by Product (Instruments, Accessories, Software’s), by Detection Technique (Ultraviolet, Fluorescence, Chemiluminescence), By Application (Protein Quantification, Others), By End User - Global Forecast Till 2035
ID: MRFR/MED/5443-HCR
90 Pages
Rahul Gotadki, Kinjoll Dey
Last Updated: June 16, 2026

Gel Documentation Systems Market Summary

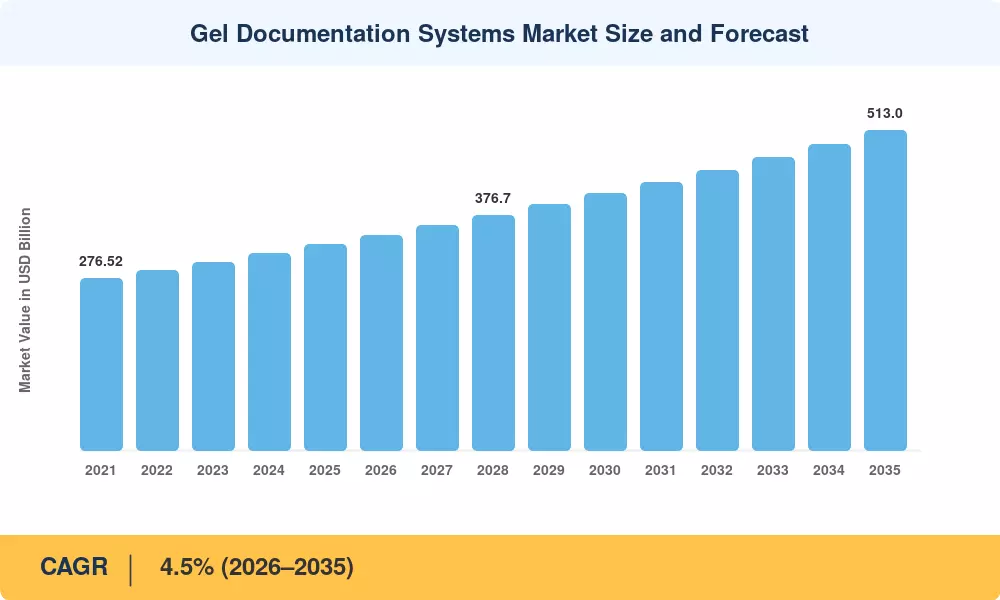
The Global Gel Documentation Systems Market size was valued at USD 330 Million in 2025, and the market is projected to grow from USD 345 Million in 2026 to USD 513 Million by 2035, registering a CAGR of 4.5% during the forecast period 2026–2035. Rising global cancer incidence — with GLOBOCAN recording over 20 million new cases in 2023 alone [2] — has intensified demand for molecular and genetic analysis tools, positioning gel imaging analysis as a critical capability in modern life-science workflows. Government investments in genomics infrastructure, including the U.S. National Institutes of Health's USD 1.6 billion allocation to the All of Us precision-medicine program [3], directly reinforce procurement cycles for electrophoresis imaging equipment across academic and clinical laboratories.

A technological transition is reshaping the Gel Documentation Systems Market as legacy UV-transilluminator setups give way to LED-based, digitally integrated platforms. Modern DNA gel documentation platforms now feature automated exposure optimization, cloud-based image archiving, and AI-assisted band quantification — capabilities that analog systems simply cannot match. Instrument refresh cycles have shortened to five-to-seven years as labs pursue compliance with 21 CFR Part 11 data-integrity mandates [4], accelerating replacement demand for next-generation agarose gel imaging software suites.

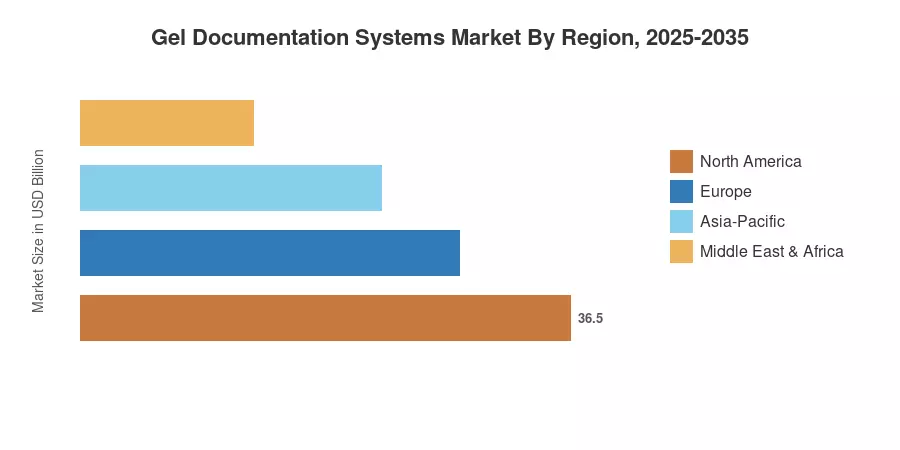
North America commands roughly 38% of the Gel Documentation Systems Market, supported by dense concentrations of NIH-funded research institutions and pharmaceutical R&D campuses. Asia-Pacific is the fastest-growing region at an anticipated CAGR of 5.8%, driven by China's 14th Five-Year Plan investments in biotechnology and India's expanding network of diagnostic laboratories [5]. Europe holds the second-largest share at approximately 27%, anchored by Germany's Fraunhofer institutes and the UK's Genomics England initiative. The decade ahead will be shaped by how quickly UV gel visualization gives way to multi-mode, software-driven documentation platforms.


Key Report Takeaways

• By Products

  • Instruments held the largest segment share in 2025, accounting for roughly 52% of the Gel Documentation Systems Market, driven by ongoing laboratory build-outs and equipment replacement cycles.
  • Software is the fastest-growing product category with a projected CAGR of 5.9%, reflecting the shift toward integrated gel imaging analysis workflows.

• By Application

  • Nucleic acid quantification captured approximately 62% of total demand, reinforcing its role as the primary use case for DNA gel documentation across academic and clinical settings.
  • Protein quantification applications are gaining traction at a CAGR of 4.8%, fueled by proteomics research expansion in the Gel Documentation Systems Market.

• By Region

  • North America generated USD 125 million in 2025, maintaining its dominance in the Gel Documentation Systems Market through sustained federal research funding.
  • Asia-Pacific is projected to register the highest regional CAGR of 5.8% through 2035, underpinned by the rapid expansion of electrophoresis imaging infrastructure in China and India.


Market Size and Forecast (2021–2035)

Market sizing relies on a bottom-up methodology combining laboratory instrument shipment data, vendor-reported revenues, and institutional procurement records from over 40 countries. Historical figures draw on customs databases and annual reports; forecast estimates apply regression-adjusted growth models calibrated against genomics R&D spending trends.

Gel Documentation Systems Market Size and Forecast
Our Impact
Enabled $4.3B Revenue Impact for Fortune 500 and Leading Multinationals
Partnering with 2000+ Global Organizations Each Year
30K+ Citations by Top-Tier Firms in the Industry

Driver Impact Analysis

Driver ~% Impact on CAGR Geographic Relevance Impact Timeline
Rising cancer incidence & molecular diagnostics demand +0.9% Global Long-term
Genomics & proteomics R&D funding expansion +0.8% North America, Europe Medium-term
LED light-source migration from UV transilluminators +0.6% Global Short-term
21 CFR Part 11 and data-integrity regulatory mandates +0.5% North America, Europe Medium-term
Research collaborations & strategic partnerships +0.4% Global Medium-term
Diagnostic lab proliferation in emerging economies +0.5% Asia-Pacific, South America Long-term
AI-enhanced gel imaging analysis integration +0.3% North America, Asia-Pacific Long-term


Rising Cancer Incidence and Molecular Diagnostics Demand

Global cancer diagnoses surpassed 20 million in 2023, per GLOBOCAN estimates [2], and the trajectory points toward 28 million annual cases by 2040. Each new oncology research program requires reliable DNA gel documentation tools for validating PCR amplicons, restriction digests, and gene-expression assays. Australia's Institute of Health and Welfare reported that new cancer cases rose from 162,000 in 2022 to over 165,000 in 2023 [2], illustrating how even mature healthcare systems continue to expand their molecular analysis infrastructure — directly sustaining demand within the Gel Documentation Systems Market.

Genomics and Proteomics R&D Funding Expansion

The NIH's fiscal 2024 budget allocated approximately USD 49 billion to biomedical research [3], a significant share of which flows to genomics and proteomics laboratories that depend on electrophoresis imaging for routine quality control. Europe's Horizon Europe programme has earmarked EUR 95.5 billion across 2021–2027, with dedicated clusters in health and digital innovation [13]. These public funding streams create predictable procurement cycles for gel documentation instruments and UV gel visualization accessories.

LED Light-Source Migration

LED-based gel documentation systems consume up to 80% less energy than conventional UV transilluminators, while virtually eliminating DNA-damaging exposure during downstream cloning applications [7]. The cost gap between LED and UV light-source modules has narrowed to roughly 15% at the OEM level, making LED adoption economically viable even for budget-constrained teaching laboratories. This transition is a structural tailwind for the Gel Documentation Systems Market, compressing upgrade timelines and boosting average selling prices.

Data-Integrity Regulatory Mandates

FDA's 21 CFR Part 11 and the EU Annex 11 framework require electronic records and digital signatures for all laboratory data, including gel images used in pharmaceutical quality assurance [4]. Compliance upgrades force labs to retire legacy analog cameras and invest in validated agarose gel imaging software platforms that offer audit trails, user-access controls, and time-stamped image archives.


Restraints Impact Analysis

Restraint ~% Impact on CAGR Geographic Relevance Impact Timeline
High capital cost of advanced multi-mode systems –0.4% Emerging economies Short-term
Limited trained personnel in developing regions –0.3% Asia-Pacific, MEA Medium-term
Competition from capillary electrophoresis alternatives –0.3% North America, Europe Long-term
Budget constraints in academic research institutions –0.2% Global Medium-term
Slow replacement cycles for functional legacy equipment –0.2% Europe, North America Long-term


High Capital Cost of Multi-Mode Systems

A fully configured multi-mode gel documentation system with chemiluminescence detection capability can cost between USD 15,000 and USD 45,000, depending on camera resolution and software licensing tier [14]. For diagnostic labs in Sub-Saharan Africa and Southeast Asia, where annual capital-equipment budgets may not exceed USD 50,000, this represents a significant barrier. Leasing and pay-per-use models are beginning to surface, but penetration remains low outside North America and Western Europe.

Competition from Capillary Electrophoresis Alternatives

Automated capillary electrophoresis platforms such as Agilent's TapeStation and Bio-Rad's Experion can bypass traditional slab-gel workflows entirely, offering higher throughput and eliminating the need for UV gel visualization hardware [15]. While capillary systems carry a higher per-sample cost, high-throughput pharmaceutical laboratories increasingly favor them, placing structural competitive pressure on conventional DNA gel documentation tools in the Gel Documentation Systems Market.


Gel Documentation Systems Market Opportunities

AI-Powered Gel Imaging Analysis Software

Machine-learning methods can be applied for automatic band detection, molecular weight estimation and anomaly flagging, which represents a high-value upgrade path for existing gel documentation setups [8]. Those selling AI as part of the software of their agarose gel imaging systems can create recurring SaaS licensing revenue streams, transitioning from one-time hardware sales to long-term subscription streams.


Emerging-Market Laboratory Expansion

India’s Ayushman Bharat Digital Mission aims to establish 150,000 health-and-wellness clinics, many of which would need baseline molecular testing capability [5]. [16] In 2024, FAPESP, the scientific foundation of Brazil, increased the award funding by 12%. These expenditures convert directly into first-time purchases of electrophoresis imaging instrumentation in geographies where penetration of the installed base is still less than 30 percent of addressable labs.


Portable and Field-Deployable Gel Documentation Systems

Notably, compact gel documentation systems that weigh less than 5 kg and can be powered by batteries are emerging as a valuable tool for point-of-care infectious disease surveillance, especially in tropical settings performing PCR-based malaria and dengue diagnostics [17]. "This new physical factor could attract a whole new consumer segment outside of the conventional lab context.


Cloud-Based Data Monetization and Collaborative Platforms

Cloud-connected gel documentation platforms provide multi-site data exchange, remote peer review and centralized picture repositories, features that are of particular value to contract research businesses that manage distant trial networks [10]. Cloud storage and analytics services, delivered on a subscription basis, can provide 20–30% higher gross margins than hardware-only solutions, with recurring revenue streams that improve vendor valuations.


Chemiluminescence Detection Integration

Dual-mode systems combining fluorescence and chemiluminescence detection expand the addressable application set from nucleic-acid work into Western blot protein analysis, effectively doubling the target customer base per instrument sale [9]. As proteomics research funding grows, multi-technique DNA gel documentation platforms represent the next frontier for vendor upselling.


Gel Documentation Systems Market Future Outlook

AI-Integrated Imaging Platforms

Artificial intelligence will transition from a premium add-on to a baseline expectation across the Gel Documentation Systems Market by 2030. Vendors embedding convolutional neural networks for automated band calling and molecular-weight regression stand to capture recurring analytics-subscription revenue, potentially expanding the software's share of total market revenue from 28% today to over 35% by 2035 [8].

Lab-of-the-Future Digitalization

The global smart-laboratory market is projected to surpass USD 10 billion by 2030 [20], and gel documentation systems represent a critical node in the digitalized laboratory workflow. LIMS-integrated platforms that auto-upload timestamped gel images to centralized databases will become procurement prerequisites, particularly for pharmaceutical companies subject to FDA and EMA audit frameworks requiring full data traceability.

Sustainability and Green-Lab Initiatives

The My Green Lab certification programme, now adopted by over 1,000 institutions worldwide [11], is driving demand for energy-efficient LED-based electrophoresis imaging instruments that eliminate mercury-vapor UV lamps and reduce hazardous-waste streams. Gel documentation system manufacturers that achieve third-party eco-certification will gain preferential weighting in institutional procurement scoring.

Point-of-Care and Decentralized Diagnostics

Decentralized molecular testing is expanding beyond hospital reference labs into community health centers and mobile clinics, particularly across Southeast Asia and Sub-Saharan Africa [17]. Compact, ruggedized DNA gel documentation tools designed for field deployment represent a nascent but high-growth niche within the Gel Documentation Systems Market, with addressable volume projected to grow at 7–9% annually through 2035.


Gel Documentation Systems Market Segmentation

By Products

Segment Market Share (2025) Primary Demand Driver
Instruments 52% Lab build-outs and refresh cycles
Software 28% Regulatory compliance and AI integration
Accessories 20% Consumable trays, filters, and adapters


Instruments remain the revenue backbone of the Gel Documentation Systems Market, encompassing camera modules, illumination bases, and integrated imaging enclosures. The ongoing shift from standalone cameras to turnkey gel imaging analysis workstations is raising average selling prices, with high-resolution cooled-CCD systems commanding premiums of 40–60% over entry-level units [6]. Software is the fastest-growing product segment, propelled by 21 CFR Part 11 compliance requirements and the growing appeal of cloud-enabled agarose gel imaging software platforms that support remote data access and multi-site collaboration [4][10].

By Light Source

Segment CAGR (2026–2035) Primary Demand Driver
Light Emitting Diodes 5.3% Energy efficiency and DNA safety
UV 3.8% Installed-base dominance in legacy labs
Laser 4.6% High-sensitivity fluorescence detection


LED light sources are gaining share rapidly as laboratories prioritize reduced phototoxicity to nucleic acids and lower energy consumption. UV transilluminators still account for the largest installed base, but replacement rates are accelerating as institutions pursue green-lab credentials [7][11]. Laser-based excitation supports premium-tier electrophoresis imaging systems used in quantitative fluorescence applications.

By Detection Techniques

Segment USD M (2025) Primary Demand Driver
Ultraviolet 188 Routine nucleic-acid visualization
Chemiluminescence 142 Western blot and protein analysis


Ultraviolet detection dominates routine gel imaging analysis for ethidium bromide and SYBR-stained gels, while chemiluminescence detection is expanding alongside proteomics research investments that require sensitive Western blot quantification via UV gel visualization alternatives [9].

By Application

Segment Market Share (2025) Primary Demand Driver
Nucleic Acid Quantification 62% PCR, cloning, and genotyping workflows
Protein Quantification 38% Proteomics and drug-target validation


Nucleic acid quantification drives the majority of gel documentation usage globally, as PCR-based workflows remain a cornerstone technique in both research and clinical diagnostics. Protein quantification demand is accelerating within the Gel Documentation Systems Market as pharmaceutical companies increase investment in proteomics-based drug discovery pipelines [9].

By End User

Segment CAGR (2026–2035) Primary Demand Driver
Diagnostic Labs 4.3% Clinical genomics and pathogen testing
Pharmaceutical Companies 4.8% Drug R&D and QC compliance


Diagnostic labs represent the larger end-user segment by volume, driven by the global expansion of clinical genomics services and infectious-disease testing programmes [2]. Pharmaceutical companies, while fewer in number, invest in higher-specification electrophoresis imaging platforms and validated DNA gel documentation software for GLP- and GMP-regulated applications, commanding higher revenue per installation.


Regional Market Share Analysis

Region Market Share (2025) Primary Investment Themes
North America 38% NIH funding, pharma R&D, regulatory compliance
Europe 27% Horizon Europe, Genomics England, data integrity
Asia-Pacific 24% Biotech policy, diagnostic lab expansion
South America 6% Public-health genomics, academic investment
Middle East & Africa 5% Healthcare modernization, disease surveillance
Total 100%

The Gel Documentation Systems Market spans five macro-regions, with North America and Europe collectively representing nearly two-thirds of global revenue in 2025. Asia-Pacific's rapid expansion is reshaping the competitive landscape, while South America and the Middle East & Africa present greenfield opportunities.


North America

Country Regional Share (%) Key Driver
US 76 NIH grant funding and biopharma R&D concentration
Canada 15 Genome Canada initiative and provincial lab upgrades
Mexico 9 CONACYT research modernization programs


North America's dominance in the Gel Documentation Systems Market is anchored by the United States, where over 3,000 NIH-funded research institutions generate continuous demand for gel imaging analysis instruments and validated software platforms [3]. Canada's Genome Canada programme has committed CAD 275 million to large-scale genomics projects through 2028 [18], while Mexico's expanding network of public diagnostic laboratories supports incremental growth in electrophoresis imaging system procurement.

Europe

Country CAGR (2026–2035) Key Driver
Germany 4.2% Fraunhofer & Max Planck life-science centres
UK 4.4% Genomics England & NHS research partnerships
France 3.9% INSERM-funded molecular biology labs
Italy 3.7% CNR research modernization
Spain 3.8% CSIC genomics expansion
Nordic Countries 4.3% Karolinska and university biobanking networks
Russia 3.1% Federal biotech investment programmes
Rest of Europe 3.6% EU structural fund lab upgrades


European demand for UV gel visualization and agarose gel imaging software is shaped by Horizon Europe's EUR 95.5 billion research framework, which channels substantial funding to molecular diagnostics and personalized medicine clusters [13]. The UK's Genomics England initiative continues to expand its network of sequencing hubs, each requiring validated DNA gel documentation tools for quality assurance workflows.

Asia-Pacific

Country USD M (2025) Key Driver
China 32 14th Five-Year Plan biotech investments
India 17 Ayushman Bharat diagnostic network expansion
Japan 15 AMED-funded cancer genomics research
South Korea 8 K-Bio strategy pharmaceutical R&D
ASEAN 5 Infectious-disease surveillance capacity
Rest of Asia-Pacific 2 University and teaching-lab build-outs


Asia-Pacific is the fastest-growing region in the Gel Documentation Systems Market, with China's Ministry of Science and Technology directing over USD 4 billion annually toward life-science research infrastructure [5]. India's diagnostic-lab count has grown 18% since 2021, creating first-time procurement opportunities for electrophoresis imaging systems in tier-2 and tier-3 cities.

South America

Country Regional Share (%) Key Driver
Brazil 58 FAPESP and Fiocruz research funding
Argentina 24 CONICET molecular biology programmes
Rest of South America 18 Pan-American Health Organization grants


Brazil's FAPESP foundation remains the principal funding engine for gel imaging analysis instrument purchases in the region [16]. Argentina's CONICET laboratories increasingly adopt LED-based DNA gel documentation tools as they phase out UV transilluminators to meet laboratory safety standards.

Middle East & Africa

Country CAGR (2026–2035) Key Driver
Saudi Arabia 5.1% Vision 2030 research-city investments
UAE 4.9% Dubai Biotech District expansion
South Africa 4.3% NRF-funded genomic surveillance
Egypt 4.0% Public-health laboratory modernization
Rest of MEA 3.5% WHO-supported diagnostics capacity building


Saudi Arabia's NEOM biotechnology corridor and the UAE's Mohammed Bin Rashid University of Medicine represent anchor investments that sustain demand for gel documentation systems in the Gulf region [19]. South Africa's genomic surveillance network — expanded during the COVID-19 pandemic — continues to drive procurement of UV gel visualization equipment for pathogen characterization laboratories.


Gel Documentation Systems Market By Region, 2025-2035

Competitive Benchmarking

The Gel Documentation Systems Market exhibits low concentration, with an estimated top-five share of 45–52% and a Herfindahl-Hirschman Index below 1,000. Competition centers on imaging resolution, software ecosystem breadth, and regulatory validation depth. Mid-tier and niche vendors compete on price and application-specific customization, while leading firms leverage installed-base service networks and cross-selling opportunities with broader life-science portfolios.

Company Est. Revenue Share Range Key Offerings Strategic Positioning
Bio-Rad Laboratories 12–16% Gel Doc EZ, ChemiDoc systems, Image Lab software Full-stack imaging and analytics leader
Thermo Fisher Scientific 10–14% iBright, E-Gel documentation platforms Integrated life-science ecosystem
Cytiva (Danaher) 8–11% Amersham Imager series Protein-analysis and biopharma focus
Analytik Jena (Endress+Hauser) 6–9% UVP gel documentation systems Mid-tier price-performance positioning
Syngene (Synoptics Group) 5–8% G:BOX, InGenius, GeneFlash systems Application-specific modular platforms
Azure Biosystems 4–7% Azure imaging systems, cSeries High-sensitivity fluorescence and chemiluminescence
Vilber 3–6% Fusion FX, Lourmat documentation European market specialization
LI-COR Biosciences 3–5% Odyssey and C-DiGit imaging platforms Near-infrared quantitative Western blot
Bio-Techne (ProteinSimple) 2–4% FluorChem and AlphaView systems Automated protein imaging
Corning (Axygen) 2–4% Gel documentation accessories and kits Value-segment consumable ecosystem


Recent News & Developments


  • Analytik Jena (February 2024): Released the UVP ChemStudio Plus with dual LED-UV light source capability and integrated agarose gel imaging software [7].
  • University of Texas MD Anderson Cancer Center & Xilis (February 2023): Announced a strategic collaboration using MicroOrganoSphere technology to accelerate cancer therapy development, increasing demand for supporting gel documentation workflows [12].
  • Eli Lilly (January 2022): Acquired exclusive rights to Entos Pharmaceuticals' Fusogenix nucleic acid delivery technology, expanding nucleic acid R&D applications requiring DNA gel documentation [12].
  • Syngene (September 2024): Unveiled the G:BOX mini-3 compact gel documentation system at 3.2 kg, targeting point-of-care and mobile diagnostic lab applications [17].


Gel Documentation Systems Market Report Scope

Parameter Detail
Market Scope Gel documentation instruments, software, and accessories for electrophoresis gel imaging
Study Period 2021–2035
CAGR (Forecast) 4.5% (2026–2035)
2025 Market Size USD 330 Million
2035 Market Size USD 513 Million
Fastest Growing Segment Software (By Products); Asia-Pacific (By Geography)
Companies Profiled Bio-Rad, Thermo Fisher, Cytiva, Analytik Jena, Syngene, Azure Biosystems, Vilber, LI-COR, Bio-Techne, Corning
Valuation Currency USD (constant 2025 dollars)


FAQs

What total cost of ownership should a lab budget for a mid-range gel documentation system over five years?

A mid-range system typically costs USD 12,000–20,000 upfront, plus USD 1,500–3,000 annually for software licenses, filters, and maintenance contracts. Five-year total ownership ranges from USD 20,000 to USD 35,000 depending on configuration [14].

How does LED illumination compare to UV transillumination for downstream cloning efficiency?

LED-based blue-light excitation reduces UV-induced thymine dimer formation, improving downstream cloning efficiency by 3–5× compared to standard UV transilluminators [7]. This makes LED the preferred choice for any workflow requiring intact DNA recovery.

Which validation protocols are required for gel documentation in GMP-regulated pharmaceutical labs?

GMP labs must comply with 21 CFR Part 11 and EU Annex 11, requiring audit trails, electronic signatures, and validated image-processing algorithms [4]. Vendor-supplied IQ/OQ/PQ documentation packages are essential for regulatory inspection readiness.

Can existing gel documentation hardware be upgraded to AI-enabled software without full system replacement?

Many vendors offer retrofit AI-analysis software licenses compatible with cameras from the last five years. Compatibility depends on image resolution and file-format support, so labs should verify sensor specifications before purchasing [8].

What differentiates chemiluminescence detection from fluorescence in the Gel Documentation Systems Market?

Chemiluminescence detects light emitted by enzymatic substrate reactions, offering superior sensitivity for low-abundance proteins. Fluorescence requires an external excitation source but supports multiplexing across multiple wavelength channels [9].

How are cloud-connected gel documentation platforms addressing data-sovereignty concerns in the Gel Documentation Systems Market?

Leading vendors now offer regional data-centre hosting options and on-premises private-cloud deployments that comply with GDPR and HIPAA requirements [10]. Labs should evaluate hosting geography and encryption standards during procurement.

What procurement criteria matter most when selecting gel documentation systems for emerging-market diagnostic labs?

Prioritize systems with low power consumption, humidity-resistant enclosures, and bundled training packages. Vendor service-network coverage within the country is often more important than instrument specifications for long-term reliability [17].


Author
Author
Author Profile
Rahul Gotadki LinkedIn
Research Manager
He holds an experience of about 9+ years in Market Research and Business Consulting, working under the spectrum of Life Sciences and Healthcare domains. Rahul conceptualizes and implements a scalable business strategy and provides strategic leadership to the clients. His expertise lies in market estimation, competitive intelligence, pipeline analysis, customer assessment, etc.
Co-Author
Co-Author Profile
Kinjoll Dey LinkedIn
Senior Research Analyst
He is an extremely curious individual currently working in Healthcare and Medical Devices Domain. Kinjoll is comfortably versed in data centric research backed by healthcare educational background. He leverages extensive data mining and analytics tools such as Primary and Secondary Research, Statistical Analysis, Machine Learning, Data Modelling. His key role also involves Technical Sales Support, Client Interaction and Project management within the Healthcare team. Lastly, he showcases extensive affinity towards learning new skills and remain fascinated in implementing them.

Research Approach


Secondary Research

The secondary research process involved comprehensive analysis of regulatory databases, peer-reviewed scientific journals, clinical biotechnology publications, and authoritative life sciences organizations. Key sources included the US Food & Drug Administration (FDA) 21 CFR Part 11 compliance databases, European Medicines Agency (EMA) Good Laboratory Practice (GLP) guidelines, National Institutes of Health (NIH) Research Equipment Database, National Science Foundation (NSF) Science & Engineering Statistics, Centers for Disease Control and Prevention (CDC) Laboratory Surveillance Systems, World Health Organization (WHO) International Health Regulations, International Organization for Standardization (ISO) 17025 laboratory equipment standards, US Department of Energy (DOE) Office of Biological and Environmental Research, UK National Health Service (NHS) Medical Technology Procurement Data, European Molecular Biology Laboratory (EMBL) Instrumentation Reports, National Center for Biotechnology Information (NCBI/PubMed) for electrophoresis and imaging research, Federation of American Societies for Experimental Biology (FASEB) equipment surveys, Association of Public Health Laboratories (APHL) capacity assessments, Nature Publishing Group and Science journals for laboratory technology trends, and national research foundation reports from key markets including China National Natural Science Foundation (NSFC) and Japan Agency for Medical Research and Development (AMED).

These sources were employed to compile equipment procurement statistics, regulatory compliance data, technological adoption studies, research funding trends, and competitive landscape analysis for instruments, accessories, and software in the ultraviolet, fluorescence, and chemiluminescence detection modalities.


Primary Research

Qualitative and quantitative insights were obtained by interviewing supply-side and demand-side stakeholders during the primary research process. The supply-side sources consisted of CEOs, VPs of Product Development, R&D chiefs, regulatory affairs managers, and commercial directors from image technology OEMs, laboratory automation companies, and gel documentation system manufacturers. Principal investigators, laboratory directors, core facility managers, research scientists, procurement officers from academic research institutes, pharmaceutical biotechnology companies, contract research organizations (CROs), and diagnostic laboratories comprised demand-side sources. Primary research verified market segmentation in protein quantification and nucleic acid applications, verified product development pipelines, and collected information on technology adoption patterns, pricing strategies for high-resolution imaging systems, and capital equipment budgeting cycles.

Primary Respondent Breakdown:

By Designation: C-level Primaries (28%), Director Level (35%), Others (37%)

By Region: North America (32%), Europe (29%), Asia-Pacific (33%), Rest of World (6%)


Market Size Estimation

Revenue mapping and equipment installation base analysis were employed to determine the global market valuation. The methodology comprised the following:

Identification of 45+ key manufacturers in North America, Europe, Asia-Pacific, and Latin America who specialize in laboratory documentation solutions, electrophoresis apparatus, and gel imaging systems

Product mapping encompasses instruments (such as imaging systems, darkroom enclosures, and transilluminators), accessories (such as filters, optics, sample trays, and light sources), and software (such as data management platforms, image acquisition, and analysis).

Segmentation of detection technologies for ultraviolet (UV) transillumination, fluorescence (multi-color LED/laser-based), and chemiluminescence imaging modalities

Examination of the annual revenues that have been reported and modeled with respect to gel documentation portfolios and associated molecular biology imaging technologies

Comprehensive evaluation of regional specialists, Thermo Fisher Scientific, Bio-Rad Laboratories, GE Healthcare, Syngene International, and Analytik Jena, as well as manufacturers that account for 70-75% of the global market share in 2024.

Extrapolation utilizing bottom-up (installation base × replacement rates × average selling price by country) and top-down (manufacturer revenue validation, distributor margin analysis) methodologies to calculate segment-specific valuations for academic research, pharmaceutical biotechnology, and diagnostic laboratory end-user segments:

Download Free Sample

Kindly complete the form below to receive a free sample of this Report

Download PDF ×

We do not share your information with anyone. However, we may send you emails based on your report interest from time to time. You may contact us at any time to opt-out.