Segmentation Quick Reference
| Dimension | Sub-Segments | Dominant Segment | Fastest Growing Segment |
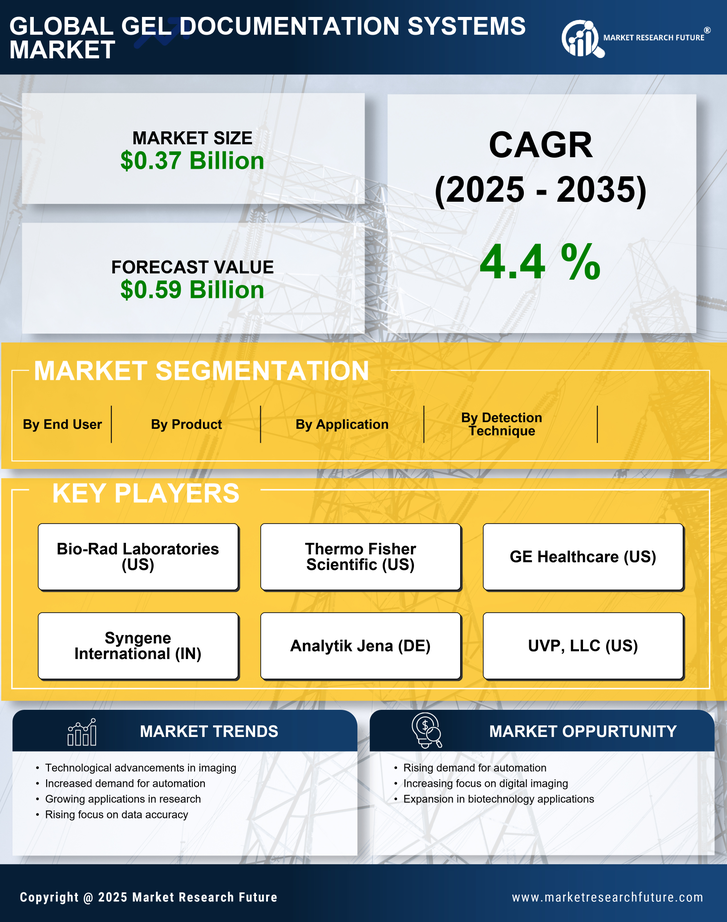
| By Products | Instruments, Software, Accessories | Instruments | Software |
| By Light Source | Light Emitting Diodes, UV, Laser | UV (installed base) | Light Emitting Diodes |
| By Detection Techniques | Ultraviolet, Chemiluminescence | Ultraviolet | Chemiluminescence |
| By Application | Nucleic Acid Quantification, Protein Quantification | Nucleic Acid Quantification | Protein Quantification |
| By End User | Diagnostic Labs, Gel Documentation Systems Market Companies | Diagnostic Labs | Gel Documentation Systems Market Companies |
| By Geography | North America, Europe, Asia-Pacific, South America, Middle East & Africa | North America | Asia-Pacific |
Market Segmentation Overview
By Products
| Sub-Segment | Key Trend |
| Instruments | Shift from standalone cameras to integrated multi-mode imaging workstations with cooled-CCD and CMOS sensors |
| Software | Growing adoption of cloud-enabled, 21 CFR Part 11-compliant analysis platforms with AI-assisted band detection |
| Accessories | Rising demand for application-specific filter sets, transilluminator trays, and gel-casting modules |
Instruments continue to anchor revenue generation, though software's share is expanding as laboratories invest in regulatory-compliant digital workflows. Accessories maintain steady replacement-cycle demand driven by consumable filter degradation and expanding application diversity.
By Light Source
| Sub-Segment | Key Trend |
| Light Emitting Diodes | Rapid uptake driven by energy efficiency, reduced DNA damage, and declining cost premium over UV |
| UV | Dominant installed base undergoing accelerated replacement; still the default in budget-constrained settings |
| Laser | Premium excitation source for quantitative fluorescence; growing in pharmaceutical QC applications |
LED sources are overtaking UV as the preferred illumination technology, driven by both performance advantages and sustainability mandates. Laser-based systems serve a smaller but high-value niche in advanced fluorescence quantification.
By Detection Techniques
| Sub-Segment | Key Trend |
| Ultraviolet | Remains the workhorse for routine ethidium bromide and SYBR-stained nucleic acid visualization |
| Chemiluminescence | Expanding alongside proteomics research, particularly in Western blot and immunoassay documentation |
Ultraviolet detection maintains volume dominance, while chemiluminescence grows faster as protein-analysis applications gain share in both academic and pharmaceutical workflows.
By Application
| Sub-Segment | Key Trend |
| Nucleic Acid Quantification | Core application for PCR validation, cloning, and genotyping across research and clinical labs |
| Protein Quantification | Accelerating demand from proteomics drug-discovery pipelines and biomarker validation studies |
Nucleic acid quantification remains the foundational use case, but protein quantification is emerging as a significant growth vector driven by increased proteomics research investment.
By End User
| Sub-Segment | Key Trend |
| Diagnostic Labs | Expanding globally with clinical genomics, infectious-disease testing, and population-health screening programmes |
| Gel Documentation Systems Market Companies | Investing in higher-specification validated systems for GLP/GMP-regulated drug development workflows |
Diagnostic labs account for the larger share of installed systems, while pharmaceutical companies generate higher revenue per unit due to premium validation, documentation, and compliance requirements.