Health Supplements Market (2026 - 2035)

Health Supplements Market Research Report Information By Type (Dietary Supplements, Bodybuilding Supplements, Eye Health Supplements, Specialty Supplements, Others), By Application (Cardiology, Rheumatic Disorders, Allergy, Others), By Ingredients (Vitamins & Minerals, Amino Acids, Botanicals, Enzymes, Others), By End-Users (Hospitals, Clinics, Research Centers, Other) And By Region (North America, Europe, Asia-Pacific, And Rest Of The World) –Market Forecast Till 2035
ID: MRFR/Pharma/1115-HCR
85 Pages
Satyendra Maurya, Kinjoll Dey
Last Updated: July 02, 2026
Health Supplements Market
Market Size
Forecast Period2026-2035
CAGR (2026-2035)4.6%
2025 Market SizeUSD 155.8 Billion
2035 Market SizeUSD 243.5 Billion
Key Players
Herbalife Nutrition
Amway
Abbott Laboratories
Bayer AG
Nestlé Health Science
Haleon
Opportunities
  • Personalized Nutrition and AI-Driven Formulation
  • Emerging Market Expansion in Africa and Southeast Asia
  • Clean-Label and Plant-Based Ingredient Sourcing

Health Supplements Market Summary

The Global Health Supplements Market size was valued at USD 155.8 Billion in 2025, and the market is projected to grow from USD 162.4 Billion in 2026 to USD 243.5 Billion by 2035, registering a CAGR of 4.6% during the forecast period 2026–2035. This expansion is anchored in two structural catalysts: the World Health Organization's 2023 Global Action Plan on non-communicable diseases, which pushed over 40 national governments to integrate preventive nutrition into public health mandates, and the cumulative USD 14.2 Billion in venture capital deployed into personalized nutrition startups between 2021 and 2024 [2].

The Health Supplements Market is witnessing a fundamental shift away from legacy pill-and-capsule formats toward advanced delivery systems. Gummy formulations, liquid shots, and functional beverages now account for a rapidly growing share of new product launches, driven by consumer demand for better taste and bioavailability. Pectin-based gummy matrices have unlocked the vegan demographic, while microencapsulation technologies are improving nutrient stability across shelf-life windows [3]. The U.S. FDA's expanded GRAS pathway for novel probiotic strains has reduced time-to-market for gut-health products by an estimated 18 months compared to 2019 benchmarks [4].

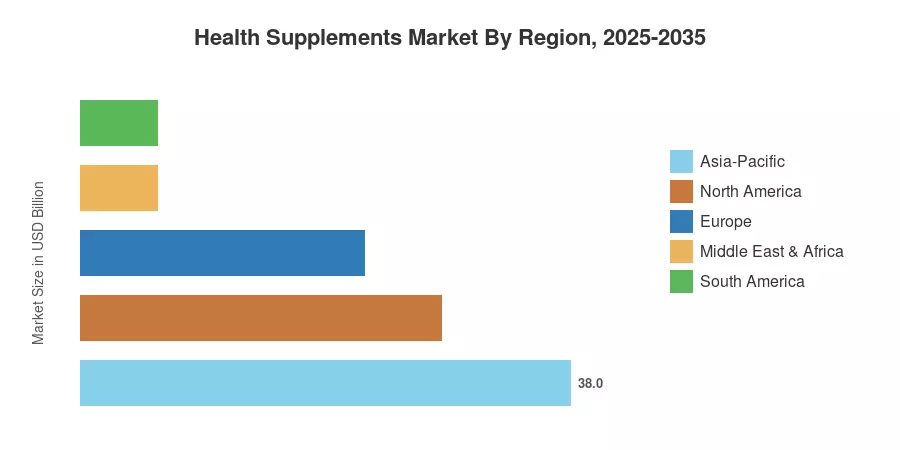
Asia-Pacific commands the largest share of the Health Supplements Market at approximately 38% of global revenue, supported by robust consumer spending in China, Japan, and India. Middle East & Africa represents the fastest-growing region, where rising disposable incomes and expanding pharmacy retail networks are accelerating supplement adoption. North America holds the second-largest share at roughly 28%, driven by a mature e-commerce infrastructure and high per-capita supplement spending [5].


Key Report Takeaways

• By Product Type

  • Vitamins captured approximately 29% of the Health Supplements Market in 2025, led by Vitamin D and multivitamin formulations targeting immune and bone health.
  • Prebiotics and probiotics represent the fastest-growing product category, expanding at a CAGR of 10.3% through 2035, fueled by clinical evidence linking gut microbiome diversity to immune and cognitive function.

• By Form

  • Capsules and tablets continue to dominate by volume, though gummy formats are gaining ground at a CAGR of 13.0% as formulators expand flavor profiles and eliminate gelatin-based ingredients.
  • Powder-based supplements are gaining traction in the Health Supplements Market, particularly among fitness-oriented consumer segments in North America and Europe.

• By Region

  • Asia-Pacific leads the Health Supplements Market with the highest regional revenue, driven by China's Healthy China 2030 initiative and Japan's aging population.
  • Middle East & Africa is poised to grow at the highest regional CAGR through 2035, supported by government healthcare diversification strategies in Saudi Arabia and the UAE.


Health Supplements Market Size and Forecast (2021–2035)

Market Research Future's estimates draw on a triangulated methodology combining top-down revenue analysis from publicly listed supplement manufacturers, bottom-up channel audits across pharmacy, e-commerce, and specialty retail, and cross-validation against regulatory filing databases maintained by the FDA, EFSA, and FSSAI.
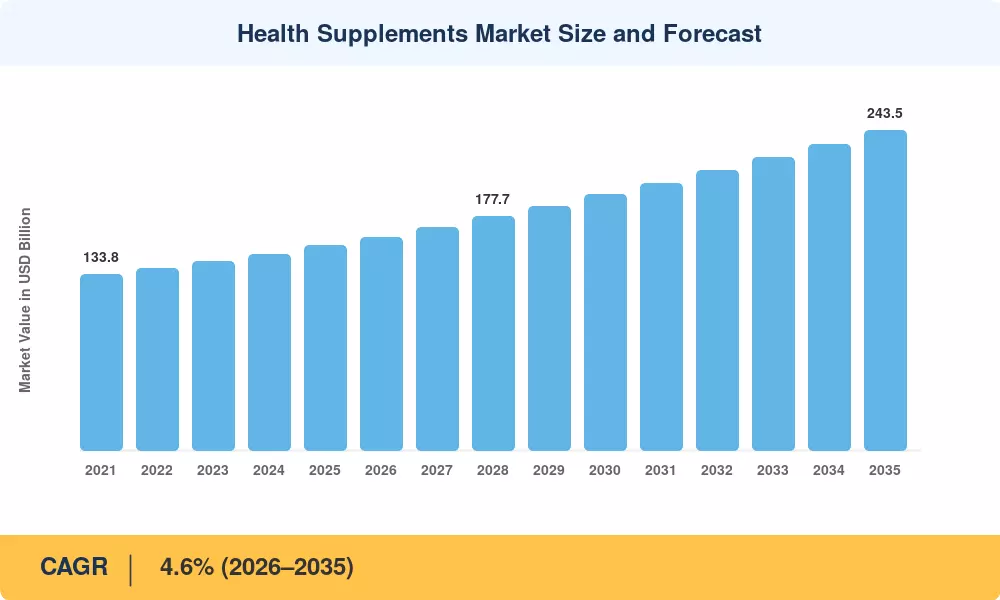
Health Supplements Market Size and Forecast
Our Impact
Enabled $4.3B Revenue Impact for Fortune 500 and Leading Multinationals
Partnering with 2000+ Global Organizations Each Year
30K+ Citations by Top-Tier Firms in the Industry

Driver Impact Analysis

Driver ~% Impact on CAGR Geographic Relevance Impact Timeline
Rising preventive healthcare awareness 22% Global Long-term (≥4 yr)
Aging global population 18% North America, Europe, Japan Long-term (≥4 yr)
E-commerce and D2C channel expansion 16% Global Medium-term (2–4 yr)
Novel delivery format innovation 14% North America, Europe Short-term (≤2 yr)
Gut-health and microbiome clinical evidence 12% Global Medium-term (2–4 yr)
Rising disposable incomes in emerging markets 10% APAC, MEA, South America Long-term (≥4 yr)
Regulatory pathway simplification (FDA GRAS, EFSA) 8% North America, Europe Short-term (≤2 yr)


Rising Preventive Healthcare Awareness

The biggest structural driver for the health supplements market is the global shift toward preventative health. According to WHO data, non-communicable illnesses cause 74% of all deaths globally; thus, between 2022 and 2025, countries will allocate an extra USD 6.8 billion to nutrition-based preventative initiatives [2]. 68% of adults now include supplements in their daily wellness routine, up from 51% in 2019, according to consumer surveys conducted in 15 major economies [5].

Aging Global Population

According to UN Population Division estimates, one in six persons worldwide will be 60 years of age or older by 2030 [5]. Customers 55 and older spend 2.3 times as much on bone-health, joint-support, and cognitive supplements as those in the 25–34 age range, which directly affects the health supplements market. Demand trends that are currently expanding throughout Europe and North America can be seen in Japan, where more than 29% of the population is over 65 [13].

E-Commerce and Direct-to-Consumer Expansion

Online supplement sales grew at roughly 19% annually between 2020 and 2024, outpacing brick-and-mortar channels by a factor of four. Subscription-based models — where consumers receive personalized supplement packs monthly — now represent an estimated 12% of online supplement revenue in the United States. Amazon's Health & Wellness storefront alone hosts more than 85,000 supplement SKUs, intensifying price competition but dramatically expanding consumer access.

Novel Delivery Format Innovation

Gummy supplements are expanding at a CAGR of 13.0%, making them the fastest-growing delivery format in the Health Supplements Market. The shift is driven by pectin-based formulations that cater to vegan consumers and by flavor technology borrowed from the confectionery industry [3]. Liquid shots and effervescent tablets are also gaining share, particularly in convenience-oriented markets like South Korea and the UK, where single-serve formats align with on-the-go lifestyles [4].


Restraints Impact Analysis

The restraint impacts below are directional estimates and represent headwinds that moderate the overall growth trajectory. They do not sum to a precise CAGR drag and should be read as qualitative influence weightings.

Restraint ~% Drag on CAGR Geographic Relevance Impact Timeline
Regulatory fragmentation across markets –18% Global Long-term (≥4 yr)
Consumer skepticism and label trust issues –15% North America, Europe Medium-term (2–4 yr)
Raw material price volatility –12% Global Short-term (≤2 yr)
Adverse event reporting and product recalls –10% North America Short-term (≤2 yr)
Competition from fortified food and beverages –8% Europe, APAC Medium-term (2–4 yr)


Regulatory Fragmentation

The market for health supplements is governed by a patchwork of national laws that increase the cost of compliance and impede international growth. Market-entry timescales are extended by 12–24 months and up to EUR 250,000 per ingredient due to the EU's Novel Food Regulation, which mandates a separate safety dossier for ingredients not ingested before 1997 [11]. In the meantime, different ingredient affirmative lists are maintained by China's SAMR and India's FSSAI, which forces international corporations to reformulate their products market by market [14].

Consumer Skepticism and Label Trust

21% of tested supplement items did not match label claims for active ingredient content, according to a 2024 ConsumerLab.com investigation [14]. This encourages regulatory scrutiny and increases consumer mistrust. Although third-party certification schemes like USP Verified and NSF International are becoming more popular, adoption is still optional and unequal, especially among smaller private-label brands [16].

Raw Material Price Volatility

Key inputs — including fish oil, whey protein isolate, and botanical extracts — experienced price swings of 15–30% between 2022 and 2024 due to supply-chain disruptions and climate-related harvest variability [15]. Algae-sourced omega-3 prices rose 22% in 2023 alone following drought conditions in Southeast Asian cultivation regions, pressuring margins for manufacturers committed to plant-based sourcing.


Health Supplements Market Opportunities

Personalized Nutrition and AI-Driven Formulation

Supplement companies are able to provide hyper-personalized stacks based on individual biomarker profiles due to developments in nutrigenomics and real-time wearable health data. Businesses that use AI-based recommendation engines routinely report customer retention rates that are 30–35% higher than those that offer generic product lines. As D2C subscription platforms develop and incorporate more detailed diagnostic data, this continues to be a high-margin development path for the health supplements market.

Emerging Market Expansion in Africa and Southeast Asia

The African Development Bank projects that by 2030, there will be 580 million middle-class people in Sub-Saharan Africa [10]. Significant whitespace is evident in the region's supplement penetration, which is still below 8% compared to 45% in North America. In South Africa, pharmacy chains like Dis-Chem and Clicks are expanding, creating the retail infrastructure required for mass-market distribution.

Clean-Label and Plant-Based Ingredient Sourcing

Consumer demand for transparency and sustainability is pushing brands to reformulate using algae, mushroom, and fermented botanical ingredients. Plant-based supplements are growing at approximately double the rate of synthetic counterparts, and brands achieving certified organic or non-GMO status command a 20–25% price premium.

Gut-Brain Axis and Mental Wellness Positioning

Clinical research linking microbiome composition to mental health outcomes has opened a new positioning frontier for the Health Supplements Market. Psychobiotic formulations targeting stress, sleep, and cognitive performance are attracting both consumer interest and clinical investment, with over 120 registered clinical trials underway globally as of 2024 [4].

Data Monetization Through Supplement-as-a-Platform Models

Leading D2C supplement brands are monetizing the health data they collect through personalized quiz engines, wearable integrations, and loyalty programs. Anonymized, aggregated wellness data has value for insurance, employer wellness, and pharmaceutical R&D partners, creating a secondary revenue stream estimated at 3–5% of top-line supplement revenue for early movers [7].


Health Supplements Market Future Outlook

AI-Powered Formulation and Precision Nutrition

Machine learning platforms are transforming how supplement companies develop products. By analyzing datasets spanning genomics, microbiome composition, and blood biomarkers, AI systems can identify optimal ingredient combinations 60% faster than traditional R&D cycles [7]. The Health Supplements Market will increasingly bifurcate between commodity multivitamins and premium precision-nutrition products carrying subscription price points of USD 50–100 per month.

Platform Economics and Subscription Models

The shift from transactional retail to recurring subscription revenue is reshaping the competitive landscape of the Health Supplements Market. Brands operating subscription platforms report 2.8x higher lifetime customer value and 40% lower customer acquisition costs compared to retail-dependent peers. By 2030, subscription models are expected to account for over 20% of total online supplement revenue globally.

Sustainability and ESG-Driven Sourcing

Environmental sustainability is transitioning from a marketing differentiator to a procurement requirement. Major retailers including Whole Foods, Boots, and Watsons now mandate third-party sustainability certifications for shelf placement. Brands investing in regenerative agriculture partnerships for botanical sourcing and carbon-neutral manufacturing will capture share from competitors unable to meet tightening retailer ESG scorecards.

Regulatory Convergence and Global Harmonization

CODEX Alimentarius working groups are advancing toward harmonized maximum permitted levels for key vitamins and minerals, a development that could reduce reformulation costs for multinational supplement brands by 15–20% [11]. The Health Supplements Market stands to benefit significantly if mutual recognition agreements between the FDA, EFSA, and APEC member-state regulators reduce duplicative clinical testing requirements.


Health Supplements Market Segmentation

By Product Type

Segment Market Share (2025) Primary Demand Driver
Vitamins 29% Immune health awareness and daily wellness routines
Minerals 18% Bone health and electrolyte supplementation
Prebiotics & Probiotics 10.3% CAGR Gut-brain axis research and microbiome awareness
Enzymes 7% Digestive health and food sensitivity management
Amino Acids & Proteins 15% Fitness culture and muscle recovery
Herbal & Botanical 12% Clean-label and traditional medicine integration
Others 19% Omega-3, CoQ10, specialty compounds


Vitamins remain the cornerstone of the Health Supplements Market, led by Vitamin D, Vitamin C, and B-complex formulations. The COVID-19 pandemic permanently elevated baseline demand for immune-relevant vitamins, and daily multivitamin usage rates among U.S. adults now exceed 52%, according to CRN survey data [2][3]. Prebiotics and probiotics represent the most dynamic growth segment, expanding at a 10.3% CAGR as clinical trial evidence increasingly validates the connection between gut microbiome diversity and systemic health outcomes ranging from immune function to mood regulation [4].

By Form

Segment CAGR (2026–2035) Primary Demand Driver
Tablets 3.2% Cost efficiency and dosing precision
Capsules 3.8% Ease of swallowing and controlled release
Gummies 13.0% Taste, convenience, and vegan formulations
Powders 5.4% Sports nutrition and shake-based consumption
Liquids & Shots 6.1% On-the-go convenience and rapid absorption
Others 3.5% Effervescents, softgels, patches


Gummies are the standout format story within the Health Supplements Market. Their 13.0% CAGR reflects a broader consumer preference shift toward supplements that double as enjoyable daily rituals rather than clinical obligations. Pectin-based gummy matrices have eliminated the gelatin barrier, opening the format to vegan and halal consumer segments [3]. Powder formats maintain strong penetration in the sports and fitness channel, where protein and amino acid formulations are consumed as part of pre- and post-workout routines.

By Source

Segment Market Share (2025) Primary Demand Driver
Plant-Based 35% Clean-label demand and sustainability concerns
Animal-Based 42% Established supply chains and bioavailability
Synthetic 23% Cost advantage and manufacturing scalability


Plant-based supplements are gaining ground at roughly double the growth rate of synthetic alternatives in the Health Supplements Market, driven by consumer preference for clean-label products and brands pivoting toward algae, mushroom, and fermented botanical sourcing.

By Distribution Channel

Segment CAGR (2026–2035) Primary Demand Driver
Supermarkets/Hypermarkets 3.4% Mass accessibility and impulse purchasing
Pharmacies/Drug Stores 3.9% Professional recommendation and trust
Online/E-Commerce 7.8% Convenience, personalization, and subscription
Specialty Stores 4.2% Curated assortments and expert advice
Others 3.0% Direct sales, MLM, practitioner channels


Online and e-commerce channels are the fastest-growing distribution pathway in the Health Supplements Market, powered by personalized recommendation algorithms, subscription convenience, and consumer comfort with digital health purchasing post-pandemic.


Regional Market Share Analysis

Region Share of Global Revenue (2025) Primary Investment Themes
Asia-Pacific 38% Traditional medicine integration, e-commerce, aging demographics
North America 28% Personalized nutrition, D2C subscription, clinical-grade products
Europe 22% Clean-label regulation, organic certification, pharmacy distribution
South America 6% Retail pharmacy expansion, emerging middle class
Middle East & Africa 6% Healthcare diversification, pharmacy chain build-out
Total 100%

The Health Supplements Market exhibits significant regional variation in consumer penetration, distribution infrastructure, and regulatory maturity. Asia-Pacific maintains its position as the dominant region, while Middle East & Africa is accelerating fastest off a smaller base.


North America

Country CAGR (2026–2035) Key Driver
US 4.3% D2C personalization and clinical-grade positioning
Canada 4.1% Natural health product regulatory framework
Mexico 5.0% Expanding pharmacy retail and growing middle class


The United States accounts for the majority of North American Health Supplements Market revenue, underpinned by the highest per-capita supplement spending globally at approximately USD 150 per year. Canada's Natural and Non-prescription Health Products Directorate provides one of the world's most structured pre-market licensing frameworks, which lends Canadian-origin brands a trust premium in export markets. Mexico's Health Supplements Market is expanding as Farmacias del Ahorro and Farmacias Guadalajara extend supplement shelf space into tier-2 and tier-3 cities [5].

Europe

Country Share of European Revenue (2025) Key Driver
Germany 24% Pharmacy-centric distribution and insurance integration
UK 19% Online retail leadership and functional food crossover
France 15% Organic and clean-label consumer preference
Italy 13% Highest per-capita supplement consumption in Europe
Spain 9% Growing wellness tourism and retail expansion
Nordic Countries 8% Omega-3 heritage and preventive health culture
Russia 6% Import substitution and domestic production scaling
Rest of Europe 6% Varied regulatory adoption


Italy leads Europe in per-capita supplement consumption, spending nearly EUR 32 per person annually, supported by a deeply embedded pharmacy advisory culture. Germany's Health Supplements Market benefits from the integration of certain supplement categories into statutory health insurance reimbursement pathways, a model that other EU member states are studying for potential adoption [11][13].

Asia-Pacific

Country Revenue (USD Billion, 2025) Key Driver
China 24.8 Healthy China 2030 initiative and TCM integration
India 9.4 Ayurveda modernization and rising health awareness
Japan 11.2 Super-aging population and functional food regulation
South Korea 6.5 K-beauty crossover and online channel dominance
ASEAN 5.2 Expanding pharmacy networks and urbanization
Rest of Asia-Pacific 2.1 Varied


China's Health Supplements Market is shaped by the convergence of traditional Chinese medicine heritage with modern clinical validation requirements. The "Blue Hat" registration system administered by SAMR governs health food claims, and products securing this certification command significant consumer trust premiums. Japan's FOSHU (Foods for Specified Health Uses) system similarly provides a regulatory moat for approved products, and the country's 29% elderly population ratio ensures sustained demand for bone, joint, and cognitive health formulations [8][13].

South America

Country CAGR (2026–2035) Key Driver
Brazil 5.2% Largest regional economy, growing fitness culture
Argentina 4.8% Urban wellness trends despite macroeconomic volatility
Rest of South America 4.5% Emerging retail infrastructure


Brazil dominates the South American Health Supplements Market, driven by a strong fitness culture and the rapid expansion of supplement-focused retail chains such as Mundo Verde. Regulatory oversight by ANVISA has tightened quality standards, which benefits established brands with robust compliance infrastructure while creating barriers for smaller importers [10].

Middle East & Africa

Country Share of MEA Revenue (2025) Key Driver
Saudi Arabia 28% Vision 2030 healthcare investment
UAE 22% Premium consumer segment and retail density
South Africa 20% Pharmacy chain expansion (Dis-Chem, Clicks)
Egypt 14% Population scale and growing urban health awareness
Rest of MEA 16% Varied


The Middle East & Africa Health Supplements Market is the fastest-growing regional segment globally, propelled by Saudi Arabia's Vision 2030 healthcare diversification strategy, which has allocated over USD 65 Billion toward health infrastructure through 2030 [10]. The UAE's positioning as a wellness tourism hub and its liberal import policies for certified health products have made Dubai a regional distribution gateway for global supplement brands.


Health Supplements Market By Region, 2025-2035

Competitive Benchmarking

The Health Supplements Market is characterized by low concentration, with the top five players collectively holding an estimated 18–22% of global revenue. The Herfindahl-Hirschman Index (HHI) for the sector remains below 500, indicating a highly fragmented landscape where regional specialists, private-label brands, and D2C startups compete alongside multinational corporations. M&A activity has intensified since 2022, with strategic acquirers targeting brands with strong subscription bases and proprietary formulation IP.

Company Est. Revenue Share Range Key Offerings Strategic Positioning
Herbalife Nutrition 3–5% Weight management, targeted nutrition D2C and MLM distribution network
Amway (Nutrilite) 3–5% Multivitamins, plant-based supplements Global direct-selling and organic farming
Abbott Laboratories 2–4% Ensure, PediaSure, therapeutic nutrition Clinical-grade positioning and pharmacy channel
Bayer AG 2–4% One A Day, Flintstones, Elevit Mass-market retail and brand recognition
Nestlé Health Science 2–3% Garden of Life, Vital Proteins, Pure Encapsulations Acquisition-led premium portfolio build
Haleon 2–3% Centrum, Caltrate, Emergen-C Pharmacy-centric global distribution
Glanbia 1–3% Optimum Nutrition, Amazing Grass Sports nutrition and performance focus
The Bountiful Company 1–2% Nature's Bounty, Sundown, Osteo Bi-Flex Value positioning and mass retail
Blackmores 1–2% Natural health supplements, fish oil Asia-Pacific leadership and naturopathic heritage
Swisse Wellness 1–2% Multivitamins, beauty-from-within Premium wellness positioning in APAC


Recent News & Developments

  • Nestlé Health Science (March 2025): Completed acquisition of a fermented botanical ingredients startup for USD 340 million, strengthening its plant-based supplement pipeline and vertical integration strategy [18].
  • Haleon (January 2025): Launched Centrum Silver+ with enhanced Vitamin K2 and magnesium glycinate, targeting the 65+ demographic across 28 markets simultaneously [19].
  • Herbalife Nutrition (October 2024): Expanded its AI-powered personalized nutrition platform to 15 additional markets, incorporating wearable health data for product recommendations [20].
  • U.S. FDA (July 2024): Issued three new GRAS notices for novel Lactobacillus and Bifidobacterium strains, streamlining market entry for probiotic supplement manufacturers [4].
  • Bayer AG (April 2024): Announced a USD 200 Million investment in a dedicated gummy supplement manufacturing facility in Germany, targeting European and Middle Eastern markets [21].
  • Amway (December 2023): Launched Nutrilite Organics line with USDA Organic and Non-GMO Project Verified certifications across all SKUs, positioning against clean-label competitors [22].
  • European Commission (September 2023): Proposed updated maximum permitted levels for Vitamin D and selenium supplements under the Food Supplements Directive, impacting formulations across all 27 EU member states [11].
  • Blackmores (June 2023): Opened a new manufacturing facility in Braeside, Australia, increasing production capacity by 30% and adding AI-based quality control systems [23].
  • In May 2025, Awshad released CalmaGummies, which are designed to improve mental clarity, relaxation, and the quality of sleep. Each gummy has 135 mg of full-spectrum hemp extract, which combines THC and CBD to provide medicinal effects.
  • In April 2025, The Vitamin Shoppe launched GLP-1 Support from Whole Health Rx, a line of nutritional supplements for people taking GLP-1 drugs as part of their weight-management regimens.
  • March 2025: As part of its range of LTH supplements, Life Time launched NOURISH, a liquid multivitamin and green powder. Compared to other goods, NOURISH has 21% more important vitamins and minerals per serving.

Health Supplements Market Report Scope

Parameter Detail
Market Scope Global Health Supplements Market covering product type, form, source, consumer group, health application, and distribution channel
Study Period 2021–2035
CAGR 4.6% (2026–2035)
Base Year Market Size USD 155.8 Billion (2025)
Forecast Endpoint USD 243.5 Billion (2035)
Fastest Growing Product Segment Prebiotics & Probiotics (10.3% CAGR)
Fastest Growing Form Segment Gummies (13.0% CAGR)
Companies Profiled 10 (Herbalife, Amway, Abbott, Bayer, Nestlé Health Science, Haleon, Glanbia, The Bountiful Company, Blackmores, Swisse Wellness)
Valuation Currency USD Billion


FAQs

How do third-party testing certifications like USP Verified affect supplement pricing power?
Products carrying USP or NSF certification typically command a 15–20% retail price premium over uncertified equivalents [14]. The certification investment pays back within 12–18 months through higher conversion rates and reduced return volumes.
What role do subscription-based models play in reshaping customer economics for supplement brands?
Subscription platforms reduce customer acquisition costs by roughly 40% and increase lifetime value by 2.8x compared to one-time retail purchases [6]. Brands with over 50% subscription revenue trade at higher valuation multiples.
How are halal and kosher certification requirements influencing the Health Supplements Market globally?
Halal-certified supplements are a prerequisite for retail distribution across the GCC and Southeast Asia, covering over 1.8 billion consumers [10]. Brands lacking certification forfeit access to the fastest-growing regional segments.
What integration challenges do supplement brands face when adopting AI-driven formulation platforms?
Primary barriers include proprietary data silos, limited biomarker standardization, and the 18–24-month validation cycle required before AI-optimized formulations can be commercially launched [12]. Smaller brands often lack the data volume to train effective models.
How does the Health Supplements Market differ for practitioner-channel versus mass-retail products?
Practitioner brands achieve 45–55% gross margins versus 30–35% for mass-retail, reflecting higher ingredient quality and controlled distribution [3]. The trade-off is lower volume and dependence on healthcare professional endorsement.
What are the key patent landscape considerations for new entrants in the Health Supplements Market?
Bioavailability-enhancement patents — covering liposomal encapsulation, chelated minerals, and phytosome complexes — represent the densest IP cluster [12]. New entrants must conduct freedom-to-operate analyses before commercializing advanced-delivery formats.
How do cross-border e-commerce regulations affect the Health Supplements Market for international brands?
China's cross-border e-commerce pilot zones allow foreign supplements to bypass full SAMR registration, reducing market-entry timelines from 24 months to under 6 months [8]. This channel now accounts for over 30% of imported supplement sales in China.    
Author
Author
Author Profile
Satyendra Maurya LinkedIn
Research Analyst
An accomplished research analyst with high proficiency in market forecasting, data visualization, competitive benchmarking, and others. He holds a pronounced track record in research and consulting projects for sectors such as life sciences, medical devices, and healthcare IT. His capabilities in qualitative and quantitative analysis have resulted in positive client outcomes. Working on niche market trends, opportunities, sales, and forecasted value is part of his skill set.
Co-Author
Co-Author Profile
Kinjoll Dey LinkedIn
Senior Research Analyst
He is an extremely curious individual currently working in Healthcare and Medical Devices Domain. Kinjoll is comfortably versed in data centric research backed by healthcare educational background. He leverages extensive data mining and analytics tools such as Primary and Secondary Research, Statistical Analysis, Machine Learning, Data Modelling. His key role also involves Technical Sales Support, Client Interaction and Project management within the Healthcare team. Lastly, he showcases extensive affinity towards learning new skills and remain fascinated in implementing them.

Research Approach


Secondary Research

The secondary research process involved comprehensive analysis of defense databases, military publications, government procurement records, and authoritative defense organizations. Key sources included the US Department of Defense (DoD), NATO Standardization Office (NSO), European Defence Agency (EDA), US Defense Security Cooperation Agency (DSCA), Stockholm International Peace Research Institute (SIPRI), Jane's Defence Intelligence, Defense News, Military & Aerospace Electronics, National Defense Industrial Association (NDIA), Aerospace Industries Association (AIA), EU Eurostat Defence Database, Government Accountability Office (GAO) defense reports, Congressional Research Service (CRS) reports, and national defense ministry procurement databases from key markets. These sources were employed to gather data on defense spending, procurement statistics, technology development programs, threat assessment reports, and market landscape analysis for electronic attack, electronic support, electronic protection systems, jammers, countermeasure systems, decoys, directed energy weapons, and antenna technologies.


Primary Research

As part of the primary research process, stakeholders from both the supply and demand sides were interviewed to acquire both qualitative and quantitative insights. The supply-side sources consisted of CEOs, VPs of Engineering, chief technology officers, and program directors from electronic warfare system manufacturers, defense contractors, and OEMs. Demand-side sources included program directors from armed forces, defense ministries, and military research laboratories, as well as military procurement officers, defense acquisition program managers, electronic warfare officers, and military intelligence analysts. Through primary research, market segmentation was verified, technology development timelines were verified, and insights regarding operational requirements, procurement strategies, and budget allocation dynamics were obtained.

Primary Respondent Breakdown:

By Designation: C-level Primaries (32%), Director Level (31%), Others (37%)

By Region: North America (32%), Europe (30%), Asia-Pacific (28%), Rest of World (10%)


Market Size Estimation

Global market valuation was determined through system deployment mapping and contract value analysis. Included in the methodology were the followingIdentification of over 50 critical defense contractors in North America, Europe, Asia-Pacific, and the worldCross-product mapping for electronic attack, electronic support, electronic protection, jammers, countermeasure systems, decoys, directed energy weapons, and antenna systemsAn examination of the annual revenues that have been reported and modeled for electronic warfare portfolios

Coverage of contractors representing 75-80% of global market share in 2024

Extrapolation using bottom-up (system deployment × unit cost by platform) and top-down (contractor revenue validation) approaches to derive segment-specific valuations

Download Free Sample

Kindly complete the form below to receive a free sample of this Report

Download PDF ×

We do not share your information with anyone. However, we may send you emails based on your report interest from time to time. You may contact us at any time to opt-out.
















