Healthcare Digital Twin Market (2026 - 2035)

Healthcare Digital Twin Market Research Report: Size, Share, Trend Analysis By Component (Software, Services, Hardware), By Deployment Model (On-premise, Cloud-based, Hybrid), By Applications (Medical Device Development, Drug Discovery and Development, Clinical Trial Optimization, Personalized Medicine, Precision Medicine, Remote Patient Monitoring, Surgical Planning and Simulation, Hospital Management, Healthcare Research and Innovation), By End-use Industry (Hospitals, Clinics, Pharmaceutical and Biotechnology Companies, Medical Device Manufacturers, Academic and Research Institutions) and By Regional (North America, Europe, South America, Asia Pacific, Middle East and Africa) - Growth Outlook & Industry Forecast 2025 To 2035

Forecast Period
2026-2035
CAGR
28.7%
2025 Market Size
USD 3.01 Billion
2035 Market Size
USD 38.16 Billion
Healthcare ● Updated August 25, 2026 Report ID: MRFR/HC/29467-HCR | Pages: 100 | Author: Rahul Gotadki, Vikita Thakur

Healthcare Digital Twin Market Summary

The Healthcare Digital Twin Market closed 2025 at USD 3.01 billion and enters its forecast window at USD 3.94 billion in 2026, climbing to USD 38.16 billion by 2035 at a 28.7% CAGR. Two catalysts explain the steepness of that curve. The U.S. FDA's expanding credibility framework for computational modelling in regulatory submissions has given sponsors a defensible path to substitute in silico evidence for a portion of physical testing [1], while the EU's EUR 95.5 billion Horizon Europe envelope has channelled dedicated funding into virtual human research clusters [2].

Legacy retrospective analytics — cohort dashboards, static EHR reporting layers, batch-mode capacity planners — are giving way to continuously updated computational replicas fed by real-time device telemetry. Health systems that once refreshed operational models monthly now recalibrate them hourly. Venture and corporate investors committed more than USD 1.6 billion to simulation-led health technology ventures between 2023 and 2025 [3], and roughly 38% of large U.S. academic medical centres reported at least one production-grade simulation deployment by late 2025 [4].

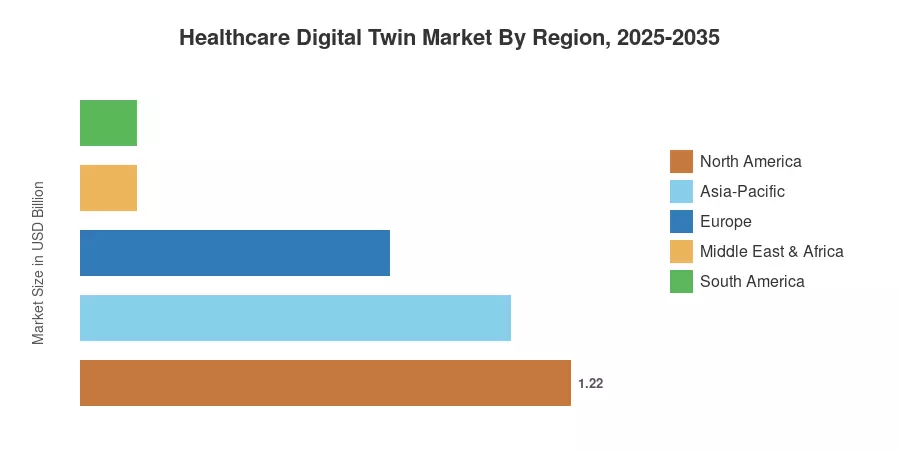
North America holds 40.4% of the Healthcare Digital Twin Market on the strength of payer-provider integration and NIH-funded modelling consortia. Asia-Pacific compounds fastest at 35.6% through 2035, propelled by China's hospital informatisation mandates and India's Ayushman Bharat Digital Mission. Europe ranks second, anchored by Germany's Hospital Future Act. The next decade belongs to whoever validates these models clinically, not merely computationally.


Key Report Takeaways

• By Technology (Component)

  • Software platforms commanded 51.2% of Healthcare Digital Twin Market revenue in 2025, reflecting the licence-led structure of early deployments.
  • Services will expand at a 26.4% CAGR through 2035 as integration and validation workloads outpace licence growth.
  • Patient-level analytics modules are the fastest-scaling software layer, advancing at a 32.7% CAGR.

• By Sector (Application)

  • Drug discovery and pre-clinical modelling accounted for 24.7% of application revenue in 2025.
  • Personalized treatment optimisation is forecast to compound at 34.6% CAGR to 2035, the fastest of any application.By End User
  • Hospitals and clinics generated USD 1.69 billion in 2025 end-user revenue.

• By Region

  • North America led the Healthcare Digital Twin Market with a 40.4% share in 2025.
  • Asia-Pacific posts the steepest regional trajectory at 35.6% CAGR across 2026–2035.
  • Middle East & Africa contributed USD 0.14 billion in 2025, concentrated in Gulf tertiary-care programmes.


Market Size and Forecast (2021–2035)

Sizing for the Healthcare Digital Twin Market combines bottom-up vendor revenue triangulation across 40-plus platform and services suppliers with top-down validation against hospital IT capital expenditure disclosures, pharmaceutical R&D informatics budgets, and public grant registries. Historical figures were reconciled against audited filings where available; forecast years apply a demand-side adoption curve moderated by clinical validation cycle times.
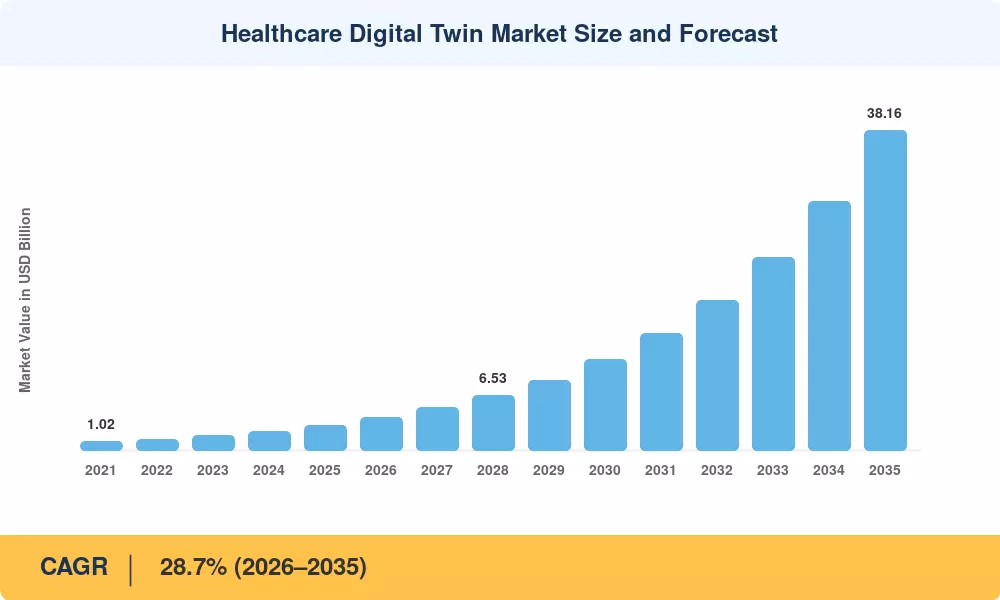
Healthcare Digital Twin Market Size and Forecast
Our Impact
Enabled $4.3B Revenue Impact for Fortune 500 and Leading Multinationals
Partnering with 2000+ Global Organizations Each Year
30K+ Citations by Top-Tier Firms in the Industry

Driver Impact Analysis

Driver ~% Impact on CAGR Geographic Relevance Impact Timeline
Regulatory acceptance of in silico clinical evidence 6.4 North America, Europe Medium-term (2–4 yr)
Clinical trial cost escalation 5.8 Global Short-term (≤2 yr)
Hospital workforce shortages and capacity strain 5.1 Global Short-term (≤2 yr)
Wearable and implantable device telemetry growth 4.6 North America, Asia-Pacific Medium-term (2–4 yr)
National health data infrastructure programmes 4.2 Europe, Asia-Pacific Long-term (≥4 yr)
Cloud and GPU compute cost decline 3.5 Global Medium-term (2–4 yr)
Precision oncology and rare-disease pipelines 3.1 North America, Europe Long-term (≥4 yr)


Regulatory Acceptance of Computational Evidence

The Healthcare Digital Twin Market has moved beyond regulators. Sponsors can now submit simulation-derived endpoints under specified verification processes through the FDA's Model-Informed Drug Development pilot and its evaluation framework for computational modeling credibility [1]. A qualification opinion on prognostic digital-twin methods for Alzheimer's trials was released by the European Medicines Agency, allowing sponsors to reduce control arms by up to 20% without losing power [11]. At current per-patient expenditures of USD 41,000, that one concession translates into savings of about USD 8–14 million per Phase II program [7].


Clinical Trial Economics Under Pressure

Sponsors must contend with a 90% attrition rate from Phase I to approval and a median cost of USD 19 million per pivotal trial [7]. Both numbers are simultaneously attacked by in silico dose-ranging and virtual control arms. In contrast to flat total R&D budgets, pharmaceutical R&D informatics spending increased 11.3% in 2025, a clear reallocation indication [10].


Workforce Shortage and Operational Modelling

WHO projects a global shortfall of 11.1 million health workers by 2030 [8]. Health systems cannot hire their way out, so they simulate their way through it — modelling theatre scheduling, bed turnover, and staffing rosters against live demand. Deployments at large European tertiary hospitals have reported 12–17% improvements in operating-room utilisation within eighteen months [12].

Device Telemetry as Model Fuel

Connected medical device shipments exceeded 490 million units in 2025, and continuous glucose monitors alone crossed 12 million active users [9]. Each device stream raises the fidelity ceiling of the replicas it feeds, converting a static model into a living one.


Restraints Impact Analysis

Restraint ~% Drag on CAGR Geographic Relevance Impact Timeline
Absence of dedicated reimbursement codes -4.7 North America, Europe Medium-term (2–4 yr)
Clinical validation and liability uncertainty -4.1 Global Long-term (≥4 yr)
Health data fragmentation and interoperability gaps -3.6 Global Short-term (≤2 yr)
Cybersecurity and data residency constraints -2.9 Europe, Middle East & Africa Medium-term (2–4 yr)
Scarcity of clinical-computational hybrid talent -2.4 Asia-Pacific, South America Long-term (≥4 yr)


The Reimbursement Void

Payers reimburse processes rather than forecasts. Hospitals are forced to finance the Healthcare Digital Twin Market from capital budgets rather than operating revenue because there is currently no CPT Category I code for simulation-guided care planning [13]. In the larger software-as-medical-device category, CMS has only issued a small number of Category III codes, and those codes lack defined relative value units. Deployment size is still dependent on institutional discretionary spending until it happens.


Validation and Liability Exposure

In most jurisdictions, the allocation of culpability between the vendor, the institution, and the treating physician remains unsettled, according to a 2025 analysis of algorithmic decision-support lawsuits [14]. Legal departments have responded with slower approvals, and malpractice carriers have responded with exclusion wording.


Interoperability Debt

Roughly 31% of U.S. hospitals still cannot exchange structured clinical data bidirectionally with unaffiliated systems [15]. Replicas built on incomplete inputs degrade quietly, and the remediation cost — data mapping, terminology harmonisation, quality gating — routinely consumes 40–55% of first-year deployment budgets.


Healthcare Digital Twin Market Opportunities

Regulatory-Grade Virtual Control Arms

Sponsors running rare-disease trials struggle to recruit placebo cohorts. Regulator-qualified prognostic models let them reduce enrolment burden while preserving statistical power, and the Healthcare Digital Twin Market stands to capture a meaningful slice of the USD 5.2 billion spent annually on control-arm patient recruitment [7]. Vendors that secure qualification opinions early will own this niche.

Emerging-Market Capacity Planning

Tertiary hospital capacity is being built at a rapid pace in Brazil, Nigeria, India, and Indonesia, and simulation-led facility design is far less expensive than over-building. Few high-income systems can equal the population-scale dataset created by the Ayushman Bharat Digital Mission, which has registered over 700 million health accounts [18]. Here, leapfrog adoption is feasible because of little legacy-system debt.


Outcome-Linked Commercial Models

Licence pricing caps vendor upside. Contracts that price against measured reductions in length-of-stay or readmission convert software into a share of clinical savings, and early pilots in the Nordics have priced at 15–22% of documented savings [12]. Buyers accept risk-sharing more readily than they accept seven-figure licence fees.

Federated Data Monetisation

Health systems sit on longitudinal cohorts that pharmaceutical sponsors will pay for but cannot legally receive. Federated model training lets institutions monetise statistical signal without moving records, and the Healthcare Digital Twin Market is the natural commercial wrapper for that exchange. European Health Data Space rules explicitly contemplate secondary use under governed access [19].

Medical Device Design Acceleration

Manufacturers face escalating EU MDR evidence requirements. In-silico bench testing of implants and delivery systems compresses design iteration from months to days, and one cardiovascular device programme reported a 34% reduction in physical prototype cycles [20].


Healthcare Digital Twin Market Future Outlook

Autonomous Model Maintenance

Manual recalibration will not survive scale. By 2030, agentic pipelines that detect drift, retrain, and revalidate replicas without human intervention will define the operating economics of the Healthcare Digital Twin Market, cutting maintenance labour by an estimated 45% per deployed model [6]. Vendors still shipping static models will price themselves out.

Platform Consolidation and Standards

Buyers are tiring of point solutions. Expect convergence toward two or three horizontal platforms carrying FHIR-native ingestion and SNOMED-mapped ontologies, with specialist vendors surviving as validated modules rather than standalone products [15]. The analogy is the PACS market of the early 2000s.

Population-Scale Replicas

Individual replicas answer clinical questions; population replicas answer policy questions. WHO's push toward digital health strategy implementation across 120 member states creates demand for epidemiological simulation at national scale [25], and several ministries have already scoped procurements exceeding USD 30 million.

Evidence Standards and Trust Infrastructure

Credibility will become the competitive moat of the Healthcare Digital Twin Market. Prospective validation studies, ASME V&V 40 conformance, and published performance intervals will separate reimbursable products from research curiosities well before 2035 [14].


Healthcare Digital Twin Market Segmentation

By Component

Component structure in the Healthcare Digital Twin Market still favours licensed software, though the services gap is narrowing faster than most vendors forecast.

Segment Metric (2025) Primary Demand Driver
Software Platforms 51.2% share Modelling engine and orchestration licensing
— Patient Digital Twin Analytics 32.7% CAGR (2026–2035) Precision treatment planning demand
— Organ & System Simulation Engines USD 0.61 Billion Device testing and surgical rehearsal
Services 26.4% CAGR (2026–2035) Integration, validation, managed operations


Software captured early revenue because pilots were software-shaped: buy an engine, connect a data feed, prove a hypothesis. Production changes the ratio. Every enterprise deployment now drags two to three dollars of integration and validation work behind each licence dollar, which is why the largest platform vendors have been acquiring clinical informatics consultancies rather than building headcount organically.

By Application

Application demand within the Healthcare Digital Twin Market splits between research acceleration and operational efficiency, with clinical decision support emerging as the connective tissue.

Segment Metric (2025) Primary Demand Driver
Drug Discovery & Pre-Clinical Modelling 24.7% share Trial cost and attrition pressure
Personalized Treatment Optimisation 34.6% CAGR (2026–2035) Oncology and cardiometabolic precision care
Surgical Planning & Simulation USD 0.55 Billion Complex procedure rehearsal
Hospital Operations & Asset Management 16.9% share Capacity and workforce constraints
Medical Device Design & Testing USD 0.37 Billion EU MDR evidence requirements
Others 6.5% share Training, education, supply chain


Drug discovery leads on revenue because pharmaceutical sponsors can quantify return in avoided trial cost — a calculation hospital CFOs find harder to run. Personalized treatment optimisation grows faster because the underlying data has arrived: continuous monitoring, genomic panels, and imaging volumes now support individual-level replicas that would have been speculative five years ago. Cardiometabolic and oncology programmes account for roughly two-thirds of this subsegment.

By End User

End-user mix in the Healthcare Digital Twin Market reflects who owns the data and who owns the budget — not always the same institution.

Segment Metric (2025) Primary Demand Driver
Hospitals & Clinics USD 1.69 Billion Capacity, staffing, and care-pathway optimisation
Pharmaceutical & Biotech Companies 30.5% CAGR (2026–2035) Virtual control arms and dose optimisation
Clinical Research Organisations 11.2% share Sponsor-mandated simulation deliverables
Research & Diagnostics Laboratories USD 0.19 Billion Assay and biomarker modelling
Medical Device Manufacturers 8.4% share Regulatory in-silico submissions
Others USD 0.09 Billion Payers, academia, public health agencies


Hospitals dominate absolute spend but generate thin per-deployment margins. Pharmaceutical buyers pay more, decide faster, and demand regulatory-grade documentation that most hospital-focused vendors cannot produce — which is precisely why the two go-to-market motions have stayed separate.


Regional Market Share Analysis

Region Metric (2025) Primary Investment Themes
North America 40.4% share Trial acceleration, payer-provider integration, oncology modelling
Europe USD 0.77 Billion Hospital digitisation funds, MDR-driven in-silico testing
Asia-Pacific 35.6% CAGR (2026–2035) National health IDs, hospital construction, manufacturing scale
South America USD 0.14 Billion Public-hospital capacity planning, tele-ICU networks
Middle East & Africa 4.6% share Sovereign health transformation programmes, medical tourism
Total USD 3.01 Billion

Regional performance across the Healthcare Digital Twin Market tracks three variables: reimbursement maturity, health data infrastructure, and density of academic medical centres. Where all three align, adoption compounds; where any one lags, deployments stall at pilot stage.


North America

Country Metric (2025) Key Driver
US 78.4% share of region FDA in silico evidence pathways
Canada USD 0.16 Billion Provincial health data platform consolidation
Mexico 29.8% CAGR (2026–2035) IMSS hospital modernisation programme


American leadership rests on concentration rather than breadth. Fewer than 200 institutions account for the majority of regional spend, most of them NIH-funded academic centres running modelling work under the Bridge2AI and NIBIB computational programmes [21]. Canada's investment flows through provincial consolidation rather than federal mandate, which slows procurement but produces larger single-tenant deployments once approved.

Europe

Country Metric (2025) Key Driver
Germany 24.1% share of region Krankenhauszukunftsgesetz digitisation funding
UK USD 0.16 Billion NHS Federated Data Platform rollout
France 27.9% CAGR (2026–2035) Health Data Hub secondary-use access
Italy 9.4% share of region PNRR hospital modernisation allocations
Spain USD 0.05 Billion Regional oncology network modelling
Nordic Countries 30.2% CAGR (2026–2035) Population registry depth
Russia 4.8% share of region State hospital informatisation
Rest of Europe USD 0.08 Billion EU cohesion health funding


Germany's Hospital Future Act committed EUR 4.3 billion to digital infrastructure, with a compliance penalty regime that made inaction expensive [22]. British momentum is more centralised: the NHS Federated Data Platform gives a single procurement decision national reach, which cuts both ways for vendors.

Asia-Pacific

Country Metric (2025) Key Driver
China 31.6% share of region Class III hospital informatisation grading
India 39.4% CAGR (2026–2035) Ayushman Bharat Digital Mission scale
Japan USD 0.14 Billion Ageing-population care simulation
South Korea 10.8% share of region K-Bio Health cluster investment
ASEAN 36.7% CAGR (2026–2035) Private hospital chain expansion
Rest of Asia-Pacific USD 0.05 Billion Donor-funded health system projects


Asia-Pacific will not simply mirror Western adoption sequencing. Chinese Class III hospitals face graded informatisation targets that make advanced analytics a compliance requirement rather than a discretionary purchase [23], and Indian private chains are deploying the Healthcare Digital Twin Market's operational tooling before its clinical tooling — a pragmatic inversion driven by margin pressure rather than research ambition.

South America

Country Metric (2025) Key Driver
Brazil 52.3% share of region SUS capacity modelling initiatives
Argentina USD 0.03 Billion Provincial hospital network projects
Rest of South America 26.4% CAGR (2026–2035) Chilean and Colombian private-sector adoption


Brazilian demand originates in the public system, where SUS administrators use simulation to allocate scarce ICU capacity across states with wildly divergent bed ratios. Currency volatility remains the practical brake on licence-denominated contracts, pushing vendors toward local-currency subscription structures.

Middle East & Africa

Country Metric (2025) Key Driver
Saudi Arabia 28.9% share of region Vision 2030 Health Sector Transformation
UAE 34.1% CAGR (2026–2035) Malaffi and Riayati health information exchanges
South Africa USD 0.02 Billion Private hospital group analytics
Egypt 9.6% share of region Universal Health Insurance rollout
Rest of MEA USD 0.03 Billion Donor and development-bank health projects


Gulf spending is programme-driven and unusually fast. Saudi Arabia's Health Sector Transformation Program allocates dedicated budget lines to advanced clinical analytics, and procurement cycles that take three years in Europe close in nine months in Riyadh [24]. Sub-Saharan adoption remains donor-dependent and concentrated in disease surveillance rather than clinical applications.


Healthcare Digital Twin Market By Region, 2025-2035

Competitive Benchmarking

Concentration in the Healthcare Digital Twin Market is moderate. Top-five vendors hold an estimated 38–46% of revenue, and the calculated HHI sits near 720 — fragmented enough that specialist entrants still win competitive bids, consolidated enough that enterprise buyers shortlist the same four or five names. Simulation-engineering incumbents compete against clinical-AI natives on different axes: the former bring physics fidelity and regulatory track record, the latter bring data-native architectures and faster deployment. Acquisition activity has run at roughly 8–11 disclosed transactions annually since 2023.

Company Est. Revenue Share Range Key Offerings for Healthcare Digital Twin Market Strategic Positioning
Siemens Healthineers ~9–12% Cardiac and imaging-derived replicas, workflow simulation Imaging install base as distribution moat
Dassault Systèmes ~8–11% Living Heart and Living Brain simulation, MODSIM stack Regulatory-grade physics fidelity leader
Philips ~6–9% Patient monitoring replicas, radiology operations twins Acute-care telemetry integration
GE HealthCare ~5–8% Command Center capacity simulation, imaging analytics Hospital operations specialist
Microsoft ~5–7% Azure Digital Twins, healthcare data solutions, Fabric Infrastructure and partner-ecosystem play
Ansys (Synopsys) ~4–6% In-silico device testing, biomechanical simulation Medical device manufacturer channel
Oracle Health ~3–5% EHR-linked modelling and population analytics Data-layer control via clinical records
Twin Health ~2–4% Metabolic replicas for diabetes reversal Direct-to-employer chronic care model
Unlearn.AI ~2–4% Prognostic replicas for clinical trial control arms Regulator-qualified trial methodology
Medtronic ~1–3% Implant performance and surgical planning models Device-embedded telemetry advantage
Virtonomy ~1–3% Virtual patient cohorts for MDR submissions European regulatory niche specialist
Q Bio ~1–2% Whole-body scanning and longitudinal replicas Consumer-adjacent precision screening


Recent News & Developments

  • Dassault Systèmes (March 2023): Extended the Living Heart Project into paediatric cardiology with a multi-hospital consortium, broadening validated anatomical libraries beyond adult populations [20].
  • European Medicines Agency (September 2023): Confirmed qualification of prognostic digital-twin methodology for neurodegenerative trial design, establishing the first European regulatory precedent for simulation-derived control data [11].
  • GE HealthCare (February 2024): Expanded Command Center deployments to more than 300 hospitals, adding predictive discharge modelling to existing capacity orchestration [12].
  • Unlearn.AI (January 2024): Closed a USD 50 million Series C to scale regulator-facing trial replicas, with participation from pharmaceutical strategic investors [3].
  • Siemens Healthineers (July 2024): Integrated coronary flow simulation into its enterprise imaging portfolio, bringing physics-based modelling into routine diagnostic workflow [26].
  • Microsoft & health system partners (November 2024): Announced FHIR-native ingestion templates for Azure Digital Twins, reducing typical integration timelines from months to weeks [6].
  • U.S. FDA (April 2025): Published updated guidance on credibility assessment for computational models supporting regulatory submissions, clarifying verification and validation expectations [1].
  • Saudi Ministry of Health (August 2025): Launched a national hospital simulation programme under Vision 2030, tendering multi-site capacity and clinical modelling contracts [24].


Healthcare Digital Twin Market Report Scope

Parameter Detail
Market Scope Global Healthcare Digital Twin Market across component, application, end user, and geography
Study Period 2021–2035 (Historical 2021–2024; Base Year 2025; Forecast 2026–2035)
CAGR 28.7% (2026–2035)
Market Size Checkpoints USD 3.01 Billion (2025); USD 3.94 Billion (2026); USD 38.16 Billion (2035)
Fastest Growing Segments Personalized Treatment Optimisation (application); Pharmaceutical & Biotech Companies (end user); Asia-Pacific (region)
Companies Profiled Siemens Healthineers, Dassault Systèmes, Philips, GE HealthCare, Microsoft, Ansys (Synopsys), Oracle Health, Twin Health, Unlearn.AI, Medtronic, Virtonomy, Q Bio
Valuation Currency USD Billion

FAQs

What procurement red flags should buyers watch for when evaluating Healthcare Digital Twin Market vendors?
Demand published prospective validation, not retrospective accuracy claims. Check whether the vendor owns model IP or sublicenses it, and confirm data-exit rights before signing [14].
How long until a deployment in the Healthcare Digital Twin Market pays back?
Operational deployments typically break even in 14–22 months; clinical applications take longer because benefit accrues to outcomes rather than throughput. Trial-focused implementations pay back fastest, often inside one study cycle [7].
Should health systems build in-house or buy commercial Healthcare Digital Twin Market platforms?
Building makes sense only where an institution already runs a research computing group with clinical validation capability. Everyone else underestimates lifecycle maintenance, which consumes more effort than initial development [17].
How do these replicas differ from conventional predictive analytics?
Predictive analytics scores risk at a point in time. A replica maintains a persistent, continuously updated state that supports counterfactual simulation — asking what happens if a therapy changes, not just what is likely [20].
What cybersecurity obligations apply?
Replicas concentrate identifiable longitudinal data, elevating breach severity. HIPAA, GDPR, and the NIS2 Directive all apply, and European deployments increasingly require in-region processing with documented residency controls [16].
Which interoperability standards matter most?
FHIR R4 for exchange, SNOMED CT and LOINC for terminology, DICOM for imaging, and IEEE 11073 for device telemetry. Vendors lacking native FHIR ingestion add months of integration work [15].
Is clinician resistance a real barrier?
Yes, though it stems from workflow disruption more than skepticism. Deployments that surface outputs inside existing EHR screens achieve materially higher sustained use than those requiring a separate application [12].    
Author
Author
Author Profile
Rahul Gotadki LinkedIn
Research Manager
He holds an experience of about 9+ years in Market Research and Business Consulting, working under the spectrum of Life Sciences and Healthcare domains. Rahul conceptualizes and implements a scalable business strategy and provides strategic leadership to the clients. His expertise lies in market estimation, competitive intelligence, pipeline analysis, customer assessment, etc.
Co-Author
Co-Author Profile
Vikita Thakur LinkedIn
Senior Research Analyst
She holds an experience of about 5+ years in market research and business consulting projects for sectors such as life sciences, medical devices, and healthcare IT. She possesses a robust background in data analysis, market estimation, competitive intelligence, pipeline analysis market trend identification, and consumer behavior insights. Her expertise lies in technical Sales support, client interaction and project management, designing and implementing market research studies, conducting competitive analysis, and synthesizing complex data into actionable recommendations that drive business growth.
Share::
Request Free Sample
Download Free Sample

Kindly complete the form below to receive a free sample of this Report

* Please use a valid business email

Share::
Request Free Sample
Download PDF ×

We do not share your information with anyone. However, we may send you emails based on your report interest from time to time. You may contact us at any time to opt-out.
















