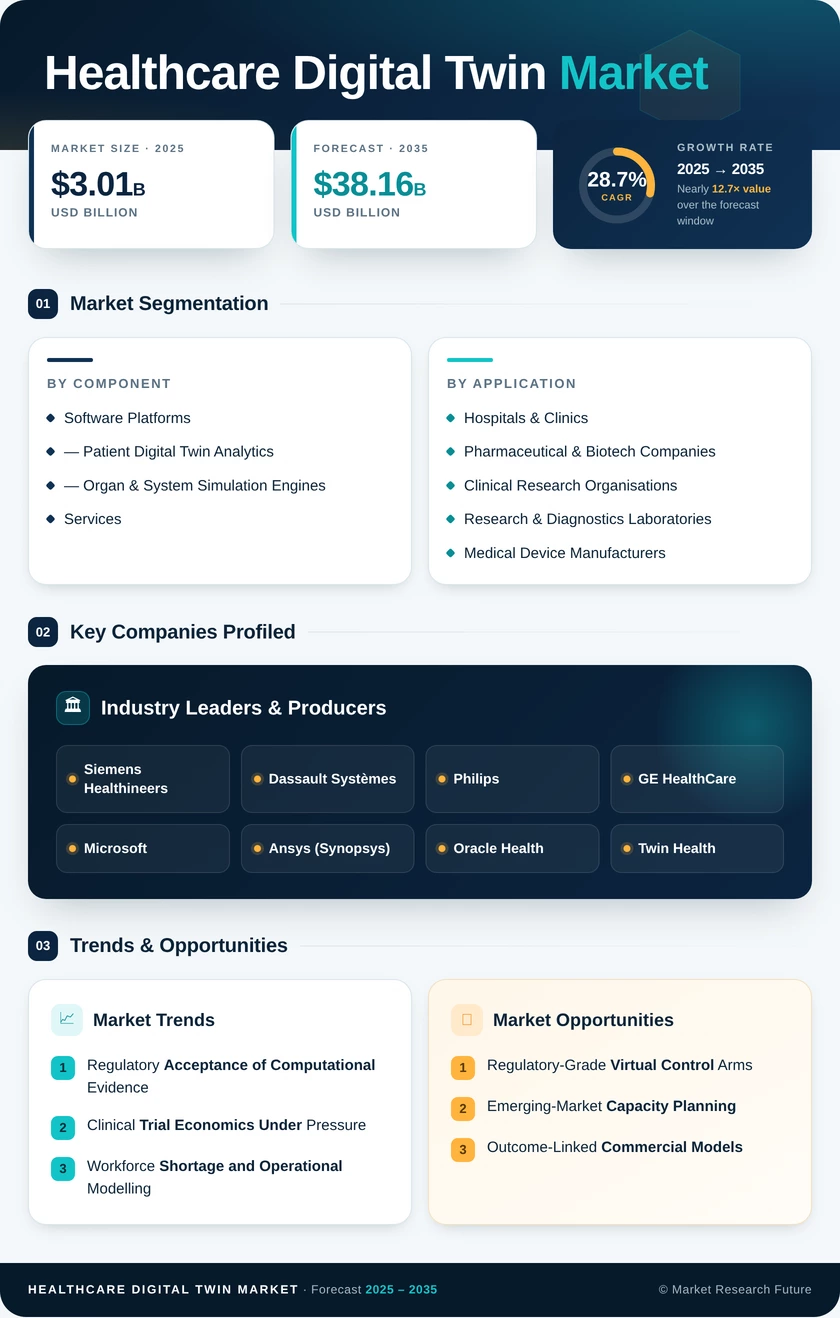
Healthcare Digital Twin Market (2026 - 2035)

Healthcare Digital Twin Market Research Report: Size, Share, Trend Analysis By Component (Software, Services, Hardware), By Deployment Model (On-premise, Cloud-based, Hybrid), By Applications (Medical Device Development, Drug Discovery and Development, Clinical Trial Optimization, Personalized Medicine, Precision Medicine, Remote Patient Monitoring, Surgical Planning and Simulation, Hospital Management, Healthcare Research and Innovation), By End-use Industry (Hospitals, Clinics, Pharmaceutical and Biotechnology Companies, Medical Device Manufacturers, Academic and Research Institutions) and By Regional (North America, Europe, South America, Asia Pacific, Middle East and Africa) - Growth Outlook & Industry Forecast 2025 To 2035

Forecast Period
2026-2035
CAGR
28.7%
2025 Market Size
USD 3.01 Billion
2035 Market Size
USD 38.16 Billion
Healthcare ● Updated August 2026 Report ID: MRFR/HC/29467-HCR | Pages: 100 | Author: Rahul Gotadki, Vikita Thakur
  1. 1 Market Summary |
    1. 1.1 Study Assumptions & Market Definition |
    2. 1.2 Scope of the Study |
    3. 1.3 Research Methodology
  2. 2 Key Report Takeaways |
    1. 2.1 By Technology (Component) |
    2. 2.2 By Sector (Application & End User) |
    3. 2.3 By Geography
  3. 3 Market Size & Forecast (2021–2035) |
    1. 3.1 Historical Market Size (2021–2024) |
    2. 3.2 Base Year Assessment (2025) |
    3. 3.3 Forecast Market Size (2026–2035) |
    4. 3.4 Year-over-Year Growth Analysis
  4. 4 Driver Impact Analysis |
    1. 4.1 Regulatory Acceptance of Computational Evidence |
    2. 4.2 Clinical Trial Economics Under Pressure |
    3. 4.3 Workforce Shortage and Operational Modelling |
    4. 4.4 Device Telemetry as Model Fuel
  5. 5 Restraints Impact Analysis |
    1. 5.1 The Reimbursement Void |
    2. 5.2 Validation and Liability Exposure |
    3. 5.3 Interoperability Debt
  6. 6 Opportunities |
    1. 6.1 Regulatory-Grade Virtual Control Arms |
    2. 6.2 Emerging-Market Capacity Planning |
    3. 6.3 Outcome-Linked Commercial Models |
    4. 6.4 Federated Data Monetisation |
    5. 6.5 Medical Device Design Acceleration
  7. 7 Regional Market Share & Country-Level Analysis |
    1. 7.1 North America | |
      1. 7.1.1 US | |
      2. 7.1.2 Canada | |
      3. 7.1.3 Mexico |
    2. 7.2 Europe | |
      1. 7.2.1 Germany | |
      2. 7.2.2 UK | |
      3. 7.2.3 France | |
      4. 7.2.4 Italy | |
      5. 7.2.5 Spain | |
      6. 7.2.6 Nordic Countries | |
      7. 7.2.7 Russia | |
      8. 7.2.8 Rest of Europe |
    3. 7.3 Asia-Pacific | |
      1. 7.3.1 China | |
      2. 7.3.2 India | |
      3. 7.3.3 Japan | |
      4. 7.3.4 South Korea | |
      5. 7.3.5 ASEAN | |
      6. 7.3.6 Rest of Asia-Pacific |
    4. 7.4 South America | |
      1. 7.4.1 Brazil | |
      2. 7.4.2 Argentina | |
      3. 7.4.3 Rest of South America |
    5. 7.5 Middle East & Africa | |
      1. 7.5.1 Saudi Arabia | |
      2. 7.5.2 UAE | |
      3. 7.5.3 South Africa | |
      4. 7.5.4 Egypt | |
      5. 7.5.5 Rest of Middle East & Africa
  8. 8 Future Outlook (2026–2035) |
    1. 8.1 Autonomous Model Maintenance |
    2. 8.2 Platform Consolidation and Standards |
    3. 8.3 Population-Scale Replicas |
    4. 8.4 Evidence Standards and Trust Infrastructure
  9. 9 Market Segmentation Analysis |
    1. 9.1 By Component | |
      1. 9.1.1 Software Platforms | |
      2. 9.1.2 Patient Digital Twin Analytics | |
      3. 9.1.3 Organ & System Simulation Engines | |
      4. 9.1.4 Services |
    2. 9.2 By Application | |
      1. 9.2.1 Drug Discovery & Pre-Clinical Modelling | |
      2. 9.2.2 Personalized Treatment Optimisation | |
      3. 9.2.3 Surgical Planning & Simulation | |
      4. 9.2.4 Hospital Operations & Asset Management | |
      5. 9.2.5 Medical Device Design & Testing | |
      6. 9.2.6 Others |
    3. 9.3 By End User | |
      1. 9.3.1 Hospitals & Clinics | |
      2. 9.3.2 Pharmaceutical & Biotech Companies | |
      3. 9.3.3 Clinical Research Organisations | |
      4. 9.3.4 Research & Diagnostics Laboratories | |
      5. 9.3.5 Medical Device Manufacturers | |
      6. 9.3.6 Others
  10. 10 Competitive Landscape |
    1. 10.1 Market Concentration Analysis |
    2. 10.2 Competitive Benchmarking Matrix |
    3. 10.3 Company Profiles |
    4. 10.4 Industry Value Chain Analysis |
    5. 10.5 Porter's Five Forces Analysis
  11. 11 Recent News & Developments
  12. 12 Report Scope & Methodology
  13. 13 Detailed Sources & Citations
  14. 14 Frequently Asked Questions
  15. 15 LIST OF TABLES |
  16. TABLE 1 Global Healthcare Digital Twin Market Size & Forecast, by Revenue (USD Billion), 2021–2035 |
  17. TABLE 2 Global Market — Year-over-Year Growth Analysis, 2021–2035 |
  18. TABLE 3 Driver Impact Analysis Matrix, 2026–2035 |
  19. TABLE 4 Restraint Impact Analysis Matrix, 2026–2035 |
  20. TABLE 5 Global Market Size, by Region (USD Billion), 2021–2035 |
  21. TABLE 6 North America Market Size, by Country (USD Billion), 2021–2035 |
  22. TABLE 7 Europe Market Size, by Country (USD Billion), 2021–2035 |
  23. TABLE 8 Asia-Pacific Market Size, by Country (USD Billion), 2021–2035 |
  24. TABLE 9 South America Market Size, by Country (USD Billion), 2021–2035 |
  25. TABLE 10 Middle East & Africa Market Size, by Country (USD Billion), 2021–2035 |
  26. TABLE 11 Global Market Size, by Component (USD Billion), 2021–2035 |
  27. TABLE 12 Global Market Size, by Application (USD Billion), 2021–2035 |
  28. TABLE 13 Global Market Size, by End User (USD Billion), 2021–2035 |
  29. TABLE 14 North America Market Size, by Component, Application & End User, 2021–2035 |
  30. TABLE 15 Europe Market Size, by Component, Application & End User, 2021–2035 |
  31. TABLE 16 Asia-Pacific Market Size, by Component, Application & End User, 2021–2035 |
  32. TABLE 17 South America Market Size, by Component, Application & End User, 2021–2035 |
  33. TABLE 18 Middle East & Africa Market Size, by Component, Application & End User, 2021–2035 |
  34. TABLE 19 Competitive Benchmarking Matrix, 2026 |
  35. TABLE 20 Company Profiles — Key Players |
  36. TABLE 21 Recent Developments & Strategic Announcements, 2023–2025 |
  37. TABLE 22 Report Scope & Methodology Summary |
  38. TABLE 23 Detailed Sources & Citations Index |
  39. TABLE 24 Segmentation Quick Reference Matrix
  40. 16 LIST OF FIGURES |
  41. FIGURE 1 Market Dynamics — Drivers, Restraints & Opportunities Overview |
  42. FIGURE 2 Industry Value Chain Analysis |
  43. FIGURE 3 Porter's Five Forces Assessment |
  44. FIGURE 4 Global Market Size Trend Line (USD Billion), 2021–2035 |
  45. FIGURE 5 Year-over-Year Growth Curve, 2022–2035 |
  46. FIGURE 6 Market Share by Component, 2025 vs 2035 |
  47. FIGURE 7 Market Share by Application, 2025 vs 2035 |
  48. FIGURE 8 Market Share by End User, 2025 vs 2035 |
  49. FIGURE 9 Regional Market Share Distribution, 2025 |
  50. FIGURE 10 Regional CAGR Comparison, 2026–2035 |
  51. FIGURE 11 Country-Level Contribution Heat Map, 2025 |
  52. FIGURE 12 Competitive Landscape Positioning Quadrant, 2026 |
  53. FIGURE 13 Top-5 Vendor Revenue Share Concentration, 2026 |
  54. FIGURE 14 Adoption Maturity Curve by End User Category
Share::
Request Free Sample

Segmentation Quick Reference

DimensionSub-SegmentsDominant SegmentFastest Growing Segment
By ComponentSoftware Platforms; Patient Digital Twin Analytics; Organ & System Simulation Engines; ServicesSoftware PlatformsPatient Digital Twin Analytics
By ApplicationDrug Discovery & Pre-Clinical Modelling; Personalized Treatment Optimisation; Surgical Planning & Simulation; Hospital Operations & Asset Management; Medical Device Design & Testing; OthersDrug Discovery & Pre-Clinical ModellingPersonalized Treatment Optimisation
By End UserHospitals & Clinics; Pharmaceutical & Biotech Companies; Clinical Research Organisations; Research & Diagnostics Laboratories; Medical Device Manufacturers; OthersHospitals & ClinicsPharmaceutical & Biotech Companies
By GeographyNorth America; Europe; Asia-Pacific; South America; Middle East & AfricaNorth AmericaAsia-Pacific


Market Segmentation Overview

By Component

Sub-SegmentKey Trend
Software PlatformsConsolidation toward FHIR-native horizontal engines with modular clinical add-ons
Patient Digital Twin AnalyticsContinuous telemetry ingestion shifting models from episodic to always-on state
Organ & System Simulation EnginesPhysics-based fidelity gaining regulatory recognition for device submissions
ServicesValidation, terminology mapping, and managed model operations outpacing licence growth


Component economics are inverting. Licences dominated the pilot era, but production deployments now require sustained validation and integration effort, pushing services toward revenue parity well before the end of the forecast window.

By Application

Sub-SegmentKey Trend
Drug Discovery & Pre-Clinical ModellingVirtual control arms reducing enrolment burden in rare-disease programmes
Personalized Treatment OptimisationOncology and cardiometabolic pathways driving individual-level replica adoption
Surgical Planning & SimulationPre-operative rehearsal moving from academic centres into community hospitals
Hospital Operations & Asset ManagementLive capacity orchestration replacing monthly forecasting cycles
Medical Device Design & TestingEU MDR evidence requirements accelerating in-silico bench testing
OthersClinical training and pharmaceutical supply chain modelling emerging


Research applications monetise faster than clinical ones because sponsors can price avoided trial cost directly. Clinical applications carry larger long-run volume but depend on reimbursement pathways that remain unresolved in most markets.

By End User

Sub-SegmentKey Trend
Hospitals & ClinicsCapital-budget funding constraining scale despite strong operational ROI
Pharmaceutical & Biotech CompaniesFastest budget growth, driven by regulatory-grade simulation deliverables
Clinical Research OrganisationsSponsor mandates pulling simulation capability into service contracts
Research & Diagnostics LaboratoriesBiomarker and assay modelling extending replica use upstream
Medical Device ManufacturersSubmission-ready virtual cohorts becoming a competitive requirement
OthersPayers and public health agencies piloting population-scale simulation


Buyer sophistication varies sharply across these groups. Pharmaceutical and device buyers arrive with validation requirements already specified; hospital buyers more often need vendors to help define success metrics before procurement can proceed.




Share::
Request Free Sample
Download PDF ×

We do not share your information with anyone. However, we may send you emails based on your report interest from time to time. You may contact us at any time to opt-out.