Request Free Sample ×

Kindly complete the form below to receive a free sample of this Report

* Please use a valid business email

Leading companies partner with us for data-driven Insights

clients tt-cursor
Hero Background

Digital Twin Market

ID: MRFR/ICT/3089-CR
200 Pages
Aarti Dhapte
Last Updated: May 25, 2026
Digital Twin Market Size, Share & Trends Analysis Research Report By Application (Manufacturing, Healthcare, Smart Cities, Automotive, Energy Management), By Technology (IoT-Enabled Digital Twins, AI-Driven Digital Twins, Simulation-Based Digital Twins, Data-Driven Digital Twins), By End Use (B2B, B2C, Government), By Deployment Type (Cloud-Based, On-Premises) and By Regional (North America, Europe, South America, Asia Pacific, Middle East and Africa) - Forecast to 2035
Download PDF ×

We do not share your information with anyone. However, we may send you emails based on your report interest from time to time. You may contact us at any time to opt-out.

Market Summary

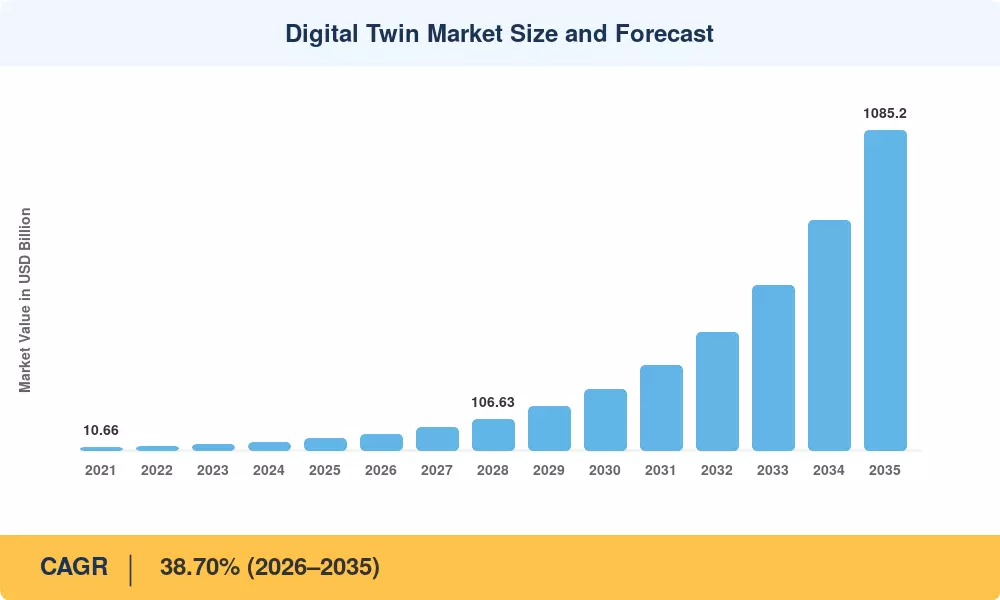
The Digital Twin Market was valued at USD 39.45 billion in 2025 and is projected to reach USD 53.60 billion in 2026 before climbing to USD 1,085.20 billion by 2035, registering a CAGR of 38.70% during the 2026–2035 forecast window. This acceleration is anchored in two converging forces: widespread industrial IoT platform maturation and a wave of government mandates requiring a real-time digital twin for energy grid management across safety-critical infrastructure in the US, EU, and China. The US Department of Energy's 2024 allocation of USD 1.2 billion toward grid modernization programs specifically earmarked digital-replica capabilities for transmission monitoring [2].

Physics-informed, cloud-native simulation environments combining sensor data, AI inference and 3D visualization replace legacy siloed SCADA and CAD-based design procedures. Global spending on enterprise IoT-based digital twin for smart manufacturing surpassed USD 8 billion in 2024, led by automotive OEMs and semiconductor fabs seeking 12–18% yield gains through virtual process optimization [3]. Industrial digital twin for predictive maintenance already underlies more than 40% of new condition monitoring contracts signed by Tier-1 equipment vendors [4].

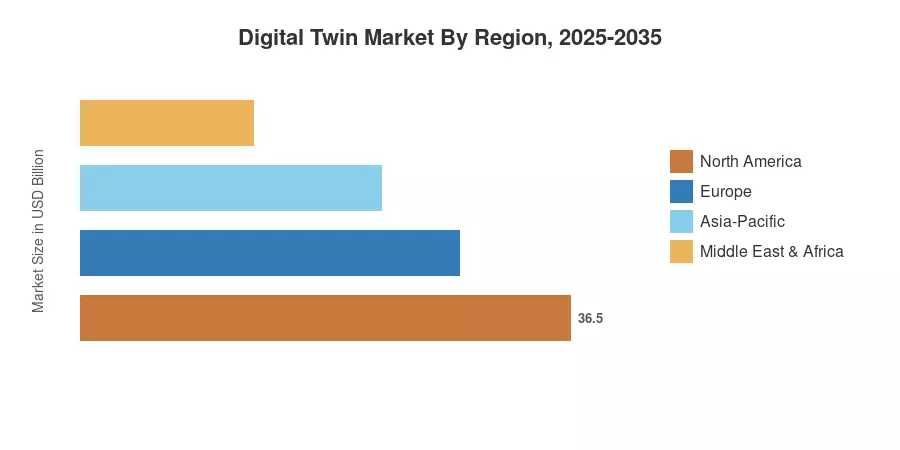
North America holds over 41.0% of the Digital Twin Market, driven by defense-sector digital-thread programs and hyperscaler cloud spending. Asia-Pacific is the fastest expanding area at an expected 28.10% CAGR, fueled by China’s “Digital China 2035” vision and India’s Smart Cities Mission. Europe has the second-highest share at around 26.5%, with Germany and France leading the way in adoption in the automotive and aerospace sectors. The Digital Twin Market will change the way enterprises develop, run and decommission physical assets of all sizes during the next decade.

Key Report Takeaways

• By Application

  • Manufacturing accounted for 37.90% of the Digital Twin Market share in 2025, reflecting entrenched smart-factory deployments across automotive, electronics, and heavy industry
  • Oil & Gas is forecast to expand at a 30.20% CAGR through 2035, as producers adopt asset-integrity digital twins to reduce unplanned downtime in offshore and refinery operations

• By Component

  • Solutions and platforms captured 67.50% revenue share in the Digital Twin Market in 2025, led by simulation-software suites and IoT middleware
  • Services are projected to grow at a 32.40% CAGR to 2035 as enterprises seek system integration and managed-twin expertise

• By Region

  • North America led with 41.0% of the Digital Twin Market in 2025
  • Asia-Pacific is set to rise at a 28.10% CAGR through 2035, driven by public digitalization programs in China, India, and Japan

MRFR’s proprietary sizing framework triangulates bottom-up vendor revenues, top-down macroeconomic variables and primary interviews with 120+ industry stakeholders to get both historical and projected estimations. All amounts are in current USD Billion and are calendar year-end values.

Market Size Chart
Our Impact
Enabled $4.3B Revenue Impact for Fortune 500 and Leading Multinationals
Partnering with 2000+ Global Organizations Each Year
30K+ Citations by Top-Tier Firms in the Industry
 

Driver Impact Analysis

Driver ~% Impact on CAGR Geographic Relevance Impact Timeline
Industrial IoT platform maturation ~18% Global Short-term (≤2 yr)
Edge-AI and on-device inference ~15% North America, Europe Medium-term (2–4 yr)
Regulatory mandates for safety-critical infrastructure ~14% US, EU, China Short-term (≤2 yr)
Cloud-native deployment & SaaS twin platforms ~13% Global Medium-term (2–4 yr)
Smart-city and digital twin for urban planning and simulation programs ~12% Asia-Pacific, Europe Long-term (≥4 yr)
Sustainability reporting & ESG compliance ~10% Europe, North America Medium-term (2–4 yr)
5G/private-network rollouts ~8% Asia-Pacific, North America Long-term (≥4 yr)


Industrial IoT Platform Maturation

In 2024, the number of installed industrial IoT sensors worldwide reached more than 18.2 billion units, as reported by IoT Analytics [3]. This density of sensors delivers the real-time data backbone required by the industrial digital twin for predictive maintenance systems to produce actionable insights. Siemens’ MindSphere and PTC’s ThingWorx both reported 35%+ YoY connected-asset subscription growth, directly driving Digital Twin Market growth.

Regulatory Mandates for Safety-Critical Infrastructure

Starting in January 2027, the updated EU Machinery Regulation (2023/1230) will oblige producers of high-risk equipment to keep a digital information passport – a regulatory digital twin, if you will – throughout the operational life of a device [2]. The Pipeline and Hazardous Materials Safety Administration (PHMSA) in the US has required all interstate gas pipelines to implement a real-time digital twin for energy grid management capabilities by 2028, including USD 950 million in compliance-support funds [2].

Edge-AI and On-Device Inference

NVIDIA's Omniverse platform, combined with its Jetson edge modules, has enabled sub-100-millisecond twin-inference loops at the factory floor, eliminating the latency penalty of cloud-round-trip architectures [5]. Qualcomm's AI Hub reported a 240% increase in edge-twin software downloads in 2024, signaling a shift in how IoT-based digital twin for smart manufacturing workloads are partitioned between cloud and edge.

Smart-City and Urban-Planning Programs

China's Ministry of Housing allocated CNY 48 billion (USD 6.6 billion) in 2024 for digital twin for urban planning and simulation pilots across 28 municipalities [6]. Singapore's

Virtual Singapore platform, now in its third phase, has become the reference architecture for city-scale twins, and the Digital Twin Market is benefiting from replication efforts in Seoul, Tokyo, and Helsinki.

Restraints Impact Analysis

Restraint ~% Drag on CAGR Geographic Relevance Impact Timeline
Cybersecurity gaps in twin-to-physical feedback loops ~−5% Global Short-term (≤2 yr)
Scarce physics-based modeling talent ~−4% Global Medium-term (2–4 yr)
Data interoperability and vendor lock-in ~−3% Europe, Asia-Pacific Medium-term (2–4 yr)
High upfront integration costs for SMEs ~−3% Emerging markets Long-term (≥4 yr)
Intellectual property and data sovereignty concerns ~−2% EU, China Short-term (≤2 yr)


Cyber-Security Gaps in Twin-to-Physical Feedback Loops

A 2024 Gartner survey found that 58% of industrial enterprises identified bidirectional digital-twin connections as their highest-priority attack surface, yet fewer than 22% had deployed twin-specific intrusion-detection systems. The Digital Twin Market faces headwinds as CISOs delay production deployments until zero-trust twin architectures reach maturity, particularly in energy and defense sectors.

Scarce Physics-Based Modeling Talent

Building a high-fidelity digital twin requires specialists who blend domain physics (thermodynamics, fluid dynamics, structural mechanics) with data-science fluency. LinkedIn Talent Insights reported only 14,000 professionals globally with "digital twin engineer" titles in 2024, against an estimated demand of 45,000 [17]. This talent bottleneck constrains how quickly enterprises can move from pilot to production-scale twins, slowing Digital Twin Market penetration in mid-market verticals.

Data Interoperability and Vendor Lock-In

Proprietary data formats across CAD, PLM and IoT technologies create costly middleware integrations for organizations. The Digital Twin Consortium’s open-standards project has gained momentum, but adoption is still below 30% among Tier-2 manufacturers [18]. Digital twin use in product lifecycle management implementations will have longer implementation times unless compatibility improves.

Opportunities

Generative-AI-Augmented Twin Creation

Large language models and diffusion-based 3D generators are cutting the time to generate simulation-ready twin models from weeks to hours. In 2024, a joint project between Autodesk and NVIDIA on AI-generated factory-floor twins reduced deployment times by 60% in pilot applications [13]. This cost-time compression opens the Digital Twin Market to mid-market manufacturers who were previously priced out of bespoke twin projects

Digital Twin as a Service (DTaaS) for SMEs

Cloud-native DTaaS systems from Azure Digital Twins, AWS IoT TwinMaker and rising SaaS businesses are lowering the entry barrier for small and medium organizations. Subscription pricing strategies lower upfront expenses by 70–80%, and the Digital Twin Market can capture large volume from this underdeveloped tier

Emerging-Market Adoption through Public Digitalization Programs

India's Production-Linked Incentive (PLI) scheme for electronics and pharma has embedded IoT-based digital twin for smart manufacturing requirements into subsidy eligibility criteria, channeling an estimated USD 1.4 billion toward twin-ready factory upgrades by 2027 [6]. Brazil's "Indústria 4.0" roadmap similarly targets 500 connected factories by 2028

Data-Monetization and Simulation-as-a-Product Business Models

Asset-heavy industries are beginning to package anonymized twin-derived insights — failure-mode libraries, optimal-maintenance schedules, energy-efficiency benchmarks — as commercial data products. BP's twin-analytics licensing program generated an estimated USD 120 million in 2024 [20]. The Digital Twin Market opportunity extends beyond operational savings into recurring revenue streams for asset owners.

Real-Time Grid Twins for Energy Transition

The global push toward 80%+ renewable penetration by 2035 demands a real-time digital twin for energy grid management to balance intermittent generation with demand. IRENA estimates that grid-twin deployments could reduce curtailment losses by 15–20%, representing USD 9 billion in annual savings across OECD grids [21]

Future Outlook

AI-Autonomous Operations and Self-Optimizing Twins

By 2030, an estimated 35% of industrial digital twins will operate in closed-loop autonomous mode, adjusting physical-asset parameters without human intervention [7]. The convergence of reinforcement learning with high-fidelity simulation environments will push the Digital Twin Market toward self-healing infrastructure — power grids that reroute loads autonomously, and factories that reconfigure production lines in minutes. The IEA projects that an autonomous real-time digital twin for energy grid management could save USD 14 billion annually in grid-balancing costs by 2032 [21].

Platform Economics and Twin Marketplaces

The next growth phase for the Digital Twin Market will hinge on interoperable twin-component marketplaces where sensor models, physics engines, and AI agents are traded as modular assets. Eclipse Digital Twin, the open-source initiative backed by Bosch, Microsoft, and SAP, aims to standardize twin-description languages by 2028, potentially unlocking a USD 12 billion middleware layer [18].

Sustainability Reporting and Carbon-Twin Mandates

The EU's Corporate Sustainability Reporting Directive (CSRD) and the SEC's climate-disclosure rules are creating regulatory demand for Scope 1–3 emissions twins. Digital twin for product lifecycle management platforms that track embodied carbon from raw material to end-of-life recycling will become compliance necessities, adding an estimated 8–10 percentage points to the Digital Twin Market CAGR in Europe between 2028 and 2033 [14].

Convergence with Spatial Computing and Extended Reality

Apple Vision Pro, Meta Quest, and industrial AR headsets from RealWear and Microsoft HoloLens are merging spatial computing with twin visualization. Technicians wearing mixed-reality devices can overlay an IoT-based digital twin for smart manufacturing data onto physical equipment in real time, reducing mean-time-to-repair by 25–40% [5]. By 2035, spatial-twin interfaces will be standard issue in field-service operations across energy, aerospace, and heavy manufacturing.


Market Segmentation

By Application

Segment Key Metric Primary Demand Driver
Manufacturing 37.90% share (2025) Smart-factory and yield-optimization programs
Energy and Power USD 5.85 Billion (2025) Grid-modernization mandates
Aerospace and Defense 30.80% CAGR Digital-thread procurement requirements
Oil and Gas 30.20% CAGR Offshore asset-integrity economics
Automotive USD 4.10 Billion (2025) EV design-to-production simulation
Others 8.5% share (2025) Healthcare, retail, construction


The Digital Twin Market is dominated by manufacturing, where IoT-based digital twins for smart manufacturing platforms have moved from pilot to production across semiconductor, automotive, and consumer-electronics plants. Foxconn's Shenzhen "Lighthouse Factory" reduced defect rates by 22% in 2024 after deploying a plant-wide twin [3]. Oil & Gas is the fastest-growing application: industrial digital twin for predictive maintenance of subsea equipment and topside rotating machinery is delivering 15–20% reductions in unplanned downtime for operators like Shell and TotalEnergies.

By Component

Segment Key Metric Primary Demand Driver
Solutions / Platforms 67.50% share (2025) Enterprise simulation software demand
Services 32.40% CAGR Integration, consulting, and managed-twin ops


Solutions and platforms anchor the Digital Twin Market today, but the services segment is catching up fast. System integrators such as Accenture, Capgemini, and TCS have each established dedicated digital-twin practices, recognizing that implementation complexity — spanning data-pipeline engineering, physics modeling, and change management — creates a durable consulting revenue stream.

By Deployment Mode

Segment Key Metric Primary Demand Driver
On-Premises 58.90% share (2025) Data-sovereignty and latency requirements
Cloud 33.60% CAGR Scalability and SaaS subscription economics


On-premises deployment still commands the majority of the Digital Twin Market, especially in defense and regulated industries. Cloud-based twins, however, are growing significantly faster as Azure Digital Twins, AWS IoT TwinMaker, and Google Cloud's Supply Chain Twin gain enterprise traction. The shift toward cloud is accelerating real-time digital twins for energy grid management use cases that require elastic compute for scenario simulation.

By Enterprise Size

Segment Key Metric Primary Demand Driver
Large Enterprises 72.30% share (2025) Established IoT infrastructure and budgets
Small and Medium Enterprises (SMEs) 29.50% CAGR DTaaS platforms are reducing entry barriers


Large enterprises dominate the Digital Twin Market, but the SME segment is gaining ground as DTaaS subscription models and pre-built twin templates lower adoption thresholds. The democratization of industrial digital twins for predictive maintenance through no-code configuration tools is expected to bring 120,000+ SME facilities online by 2030.

Regional Market Share Analysis

Region Key Metric Primary Investment Themes
North America 41.0% share (2025) Defense digital-thread, hyperscaler cloud, grid modernization
Europe 26.5% share (2025) Automotive twins, Machinery Regulation compliance, Industrie 4.0
Asia-Pacific 28.10% CAGR (2026–2035) Smart-city programs, semiconductor fabs, public infrastructure
South America USD 1.05 Billion (2025) Oil & Gas twins, agri-tech pilots
Middle East & Africa 24.80% CAGR (2026–2035) Energy-sector twins, smart-city megaprojects
Total USD 39.45 Billion (2025)

The Digital Twin Market will be characterized by a separate regional hierarchy, driven by industrial maturity, cloud infrastructure density and policy activity. North America and Europe account for two-thirds of spending combined. Asia-Pacific’s strong growth is a reflection of aggressive state-backed digitalization.


North America

Country Key Metric Key Driver
US 78.5% of regional share DOE grid-twin mandates, defense digital-thread
Canada 12.8% of regional share Oil-sands asset-integrity programs
Mexico 22.50% CAGR Nearshoring manufacturing twin demand


The United States dominates the North American Digital Twin Market through a combination of defense procurement and private-sector hyperscaler investment. The US Air Force's Digital Century Series program and GE Aerospace's engine-twin platform together represent over USD 3 billion in committed spending through 2030 [7]. Canada's oil-sands operators — Suncor, Canadian Natural — are deploying an industrial digital twin for predictive maintenance across aging extraction assets to extend operational life by 8–12 years.

Europe

Country Key Metric Key Driver
Germany 28.2% of regional share Automotive and Industry 4.0 programs
UK USD 1.95 Billion (2025) National Digital Twin Program
France 24.60% CAGR Aerospace (Airbus, Safran) twin adoption
Italy 8.5% of regional share Energy and manufacturing modernization
Spain 21.80% CAGR Renewable-energy grid twins
Nordic Countries USD 0.92 Billion (2025) Maritime and offshore-wind twins
Russia 4.1% of regional share Oil & Gas asset management
Rest of Europe 18.50% CAGR EU Horizon Europe twin funding


Germany's Plattform Industrie 4.0 and the UK's National Digital Twin Program are the twin pillars of European adoption. The Digital Twin Market in Europe benefits from stringent product-safety regulations that effectively mandate digital twins for product lifecycle management across automotive and aerospace supply chains [2].

Asia-Pacific

Country Key Metric Key Driver
China 38.5% of regional share "Digital China 2035" blueprint
India 30.20% CAGR Smart Cities Mission, PLI schemes
Japan USD 1.65 Billion (2025) Society 5.0 initiative
South Korea 14.8% of regional share Semiconductor fab twins
ASEAN 27.50% CAGR Infrastructure digitalization
Rest of Asia-Pacific 5.2% of regional share Early-stage adoption


Asia-Pacific is the fastest-growing theater for the Digital Twin Market. China's municipal-twin pilots span 28 cities, while India's Smart Cities Mission Phase 2 has allocated USD 2.1 billion for a digital twin for urban planning and simulation across 100 municipalities [6]. Japan's Society 5.0 framework integrates IoT-based digital twin for smart manufacturing into national competitiveness targets.

South America

Country Key Metric Key Driver
Brazil 58.2% of regional share Pre-salt offshore oil twins
Argentina 22.30% CAGR Mining and agriculture pilots
Rest of South America USD 0.18 Billion (2025) Early infrastructure digitalization


Brazil's Petrobras has committed USD 480 million to offshore platform digital twins through 2029, making it the region's largest single buyer in the Digital Twin Market [20]. Argentina's Vaca Muerta shale operators are piloting an industrial digital twin for predictive maintenance to optimize hydraulic-fracturing schedules.

Middle East & Africa

Country Key Metric Key Driver
Saudi Arabia 34.5% of regional share NEOM and Vision 2030
UAE 28.60% CAGR Dubai's Mandatory BIM/Twin Policy
South Africa 14.2% of regional share Mining-sector twin adoption
Egypt 20.10% CAGR New Administrative Capital twin
Rest of MEA USD 0.12 Billion (2025) Early exploration


Saudi Arabia's NEOM project alone has earmarked USD 1.8 billion for a city-scale digital twin for urban planning and simulation, positioning the kingdom as a marquee reference case for the Digital Twin Market in emerging regions [6]. Dubai's mandatory building information modeling policy, extended to require operational twins from 2026, is catalyzing UAE-wide adoption.


Regional Market Share

Competitive Benchmarking

The Digital Twin Market exhibits medium concentration, with an estimated top-five revenue share of 38–42% and a Herfindahl–Hirschman Index (HHI) in the 600–800 range. The landscape blends industrial software giants with cloud hyperscalers and specialized simulation firms, creating a layered competitive dynamic where partnerships often matter as much as organic capabilities.

Company Est. Revenue Share Range Key Offerings for the Digital Twin Market Strategic Positioning
Siemens AG ~8–11% Xcelerator, MindSphere, Simcenter End-to-end industrial twin leader
General Electric (GE) ~7–10% GE Digital Twin, Predix Aviation and energy twin specialist
Microsoft Corporation ~6–9% Azure Digital Twins, HoloLens integration Cloud platform and spatial computing play
IBM Corporation ~4–7% Maximo, Watson IoT Twin Asset-management and AI analytics
PTC Inc. ~4–6% ThingWorx, Vuforia, Creo Simulation IoT-to-CAD twin convergence
Dassault Systèmes ~4–6% 3DEXPERIENCE, SIMULIA PLM-centric twin for aero & auto
ANSYS Inc. ~3–5% Twin Builder, Fluent Physics simulation and multi-domain modeling
Robert Bosch GmbH ~2–4% Bosch IoT Suite, Eclipse Digital Twin Industrial automation and open-source advocacy
Oracle Corporation ~2–4% Oracle IoT Digital Twin, Cloud SCM Supply-chain twin and ERP integration
SAP SE ~2–3% SAP Digital Twin, Asset Intelligence Network Enterprise resource-to-twin bridge
 

Recent News & Developments


Report Scope

Parameter Detail
Market Scope Global Digital Twin Market across applications, components, deployment modes, enterprise sizes, and regions
Study Period 2021–2035
CAGR (Forecast Period) 38.70% (2026–2035)
Base-Year Market Size USD 39.45 Billion (2025)
Forecast-End Market Size USD 1,085.20 Billion (2035)
Fastest Growing Segment Oil & Gas (by application); Cloud (by deployment); SMEs (by enterprise size)
Companies Profiled 10 (Siemens, GE, Microsoft, IBM, PTC, Dassault Systèmes, ANSYS, Bosch, Oracle, SAP)
Valuation Currency USD Billion


FAQs

How does a buyer evaluate twin-platform interoperability before procurement?

Request compliance with the Digital Twin Definition Language (DTDL) and Asset Administration Shell (AAS) standards. Platforms supporting both reduce vendor lock-in and middleware costs by 30–40% [18].

What ROI timeline should manufacturers expect from a Digital Twin Market investment?

Most industrial digital twin for predictive maintenance deployments reach breakeven within 14–18 months—early adopters in automotive report 3.2× ROI by year three through reduced warranty claims [4].

Which cybersecurity frameworks apply specifically to digital-twin deployments?

IEC 62443 and NIST SP 800-82 cover OT-network security relevant to twin-to-asset communication. The Digital Twin Market increasingly demands zero-trust segmentation between simulation and control layers.

How do cloud and on-premises digital twins differ in total cost of ownership?

Cloud twins lower upfront capital expenditure by 60–70% but incur higher five-year data-egress costs. On-premises twins favor regulated industries where data-sovereignty mandates restrict external hosting [9].

Can SMEs adopt digital twins without a dedicated data-science team?

Yes — DTaaS platforms from Azure and AWS offer no-code twin builders with pre-trained models. The Digital Twin Market is seeing SME onboarding times drop by 90 days for standard use cases [12].

What role do open-source frameworks play in the Digital Twin Market?

Eclipse Ditto and FIWARE provide foundational twin-management layers at zero licensing cost. Open-source adoption cuts integration spend by 25–35% but requires in-house DevOps maturity [18].

How will generative AI change the economics of digital-twin creation?

AI-generated 3D models and auto-configured physics engines are reducing twin-build costs by 50–60%. The Digital Twin Market expects generative-AI-assisted twins to represent 40% of new deployments by 2030 [13].


Author
Author
Author Profile
Aarti Dhapte LinkedIn
AVP - Research
A consulting professional focused on helping businesses navigate complex markets through structured research and strategic insights. I partner with clients to solve high-impact business problems across market entry strategy, competitive intelligence, and opportunity assessment. Over the course of my experience, I have led and contributed to 100+ market research and consulting engagements, delivering insights across multiple industries and geographies, and supporting strategic decisions linked to $500M+ market opportunities. My core expertise lies in building robust market sizing, forecasting, and commercial models (top-down and bottom-up), alongside deep-dive competitive and industry analysis. I have played a key role in shaping go-to-market strategies, investment cases, and growth roadmaps, enabling clients to make confident, data-backed decisions in dynamic markets.

Research Approach


Secondary Research

The secondary research process involved comprehensive analysis of technical standards databases, peer-reviewed engineering journals, industrial IoT publications, and authoritative technology organizations. Key sources included the National Institute of Standards and Technology (NIST), International Organization for Standardization (ISO/TC 184), International Electrotechnical Commission (IEC), Institute of Electrical and Electronics Engineers (IEEE), Industrial Digital Twins Association (IDTA), Digital Twin Consortium (DTC), Industrial Internet Consortium (IIC), Plattform Industrie 4.0, World Economic Forum Centre for the Fourth Industrial Revolution, OECD Digital Economy Outlook, U.S. Patent and Trademark Office (USPTO), European Patent Office (EPO), International Trade Administration (ITA), U.S. Bureau of Labor Statistics, Eurostat Digital Economy and Society Statistics, and national digital transformation agency reports from key markets.

These sources were employed to accumulate standardization frameworks (ISO 23247, IEC 62832, IEEE P2806), patent landscape analysis, industrial IoT adoption metrics, regulatory compliance data for cyber-physical systems, and interoperability protocol documentation for digital twin applications in manufacturing, automotive, aerospace, energy, and healthcare.


Primary Research

Qualitative and quantitative insights were obtained by interviewing supply-side and demand-side stakeholders during the primary research process. The supply-side sources consisted of CEOs, CTOs, Heads of Digital Engineering, IoT solution architects, and commercial directors from industrial software providers, cloud infrastructure providers (PaaS/SaaS), system integrators, and digital twin platform vendors. Automotive OEMs, aerospace manufacturers, energy utilities, smart city planning authorities, and healthcare systems comprised demand-side sources, including Chief Digital Officers, VP of Operations, plant managers, manufacturing engineers, and IT/OT integration specialists. The primary research validated market segmentation across asset twins, process twins, and system twins, confirmed product roadmap timelines, and garnered insights on edge computing integration, digital thread implementation, and data governance frameworks.

Primary Respondent Breakdown:

• By Designation: C-level Executives (42%), Director/VP Level (30%), Others (28%)

• By Region: North America (36%), Europe (28%), Asia-Pacific (30%), Rest of World (6%)


Market Size Estimation

Revenue mapping and deployment volume analysis were implemented to determine global market valuation. The methodology comprised the following:

• The identification of over 50 key technology providers in North America, Europe, Asia-Pacific, and the Middle East

• Product mapping across asset digital twins, process digital twins, system digital twins, and the Digital Twin of an Organization (DTO)

• Examination of annual revenues that are either reported or modeled and are specifically related to digital twin software platforms, IoT integration services, and simulation technologies

• In 2024, the coverage of providers will account for 75-80% of the global market share.

• Segment-specific valuations for predictive maintenance, product design and development, performance monitoring, and business optimization applications are derived through extrapolation using bottom-up (deployment volume × ASP by industry vertical and deployment type [cloud vs. on-premise]) and top-down (vendor revenue validation) approaches.

Download Free Sample

Kindly complete the form below to receive a free sample of this Report