Segmentation Quick Reference
| Dimension | Sub-Segments | Dominant Segment | Fastest Growing Segment |
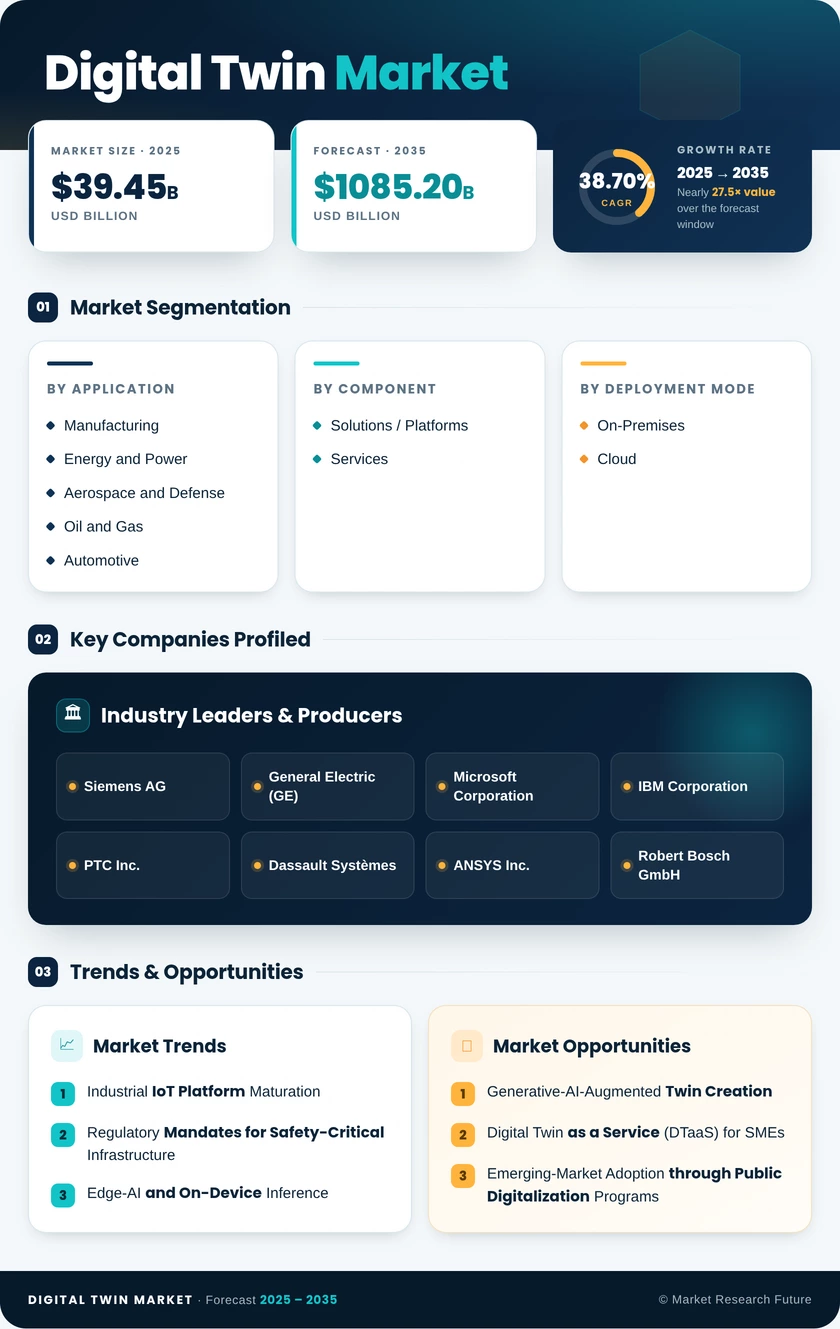
| By Application | Manufacturing, Energy and Power, Aerospace and Defense, Oil and Gas, Automotive, Others | Manufacturing | Oil and Gas |
| By Component | Solutions / Platforms, Services | Solutions / Platforms | Services |
| By Deployment Mode | On-Premises, Cloud | On-Premises | Cloud |
| By Enterprise Size | Large Enterprises, Small and Medium Enterprises (SMEs) | Large Enterprises | SMEs |
Market Segmentation Overview
By Application
| Sub-Segment | Key Trend |
| Manufacturing | Smart-factory deployments driving yield optimization and defect reduction |
| Energy and Power | Grid modernization mandates fueling real-time twin adoption. |
| Aerospace and Defense | Digital-thread procurement embedding twins into product lifecycles |
| Oil and Gas | Offshore asset-integrity programs accelerating predictive-maintenance twins. |
| Automotive | EV platform simulation and virtual crash-testing replacing physical prototyping |
| Others | Digital Twin Market (surgical twins), retail (store-layout optimization), construction (BIM-to-twin) |
Manufacturing holds the largest share of the digital twin application landscape, supported by over a decade of smart-factory investment and mature IoT infrastructure. Oil & Gas is emerging as the fastest-growing vertical, driven by harsh-environment asset monitoring and regulatory pressure to reduce flaring and emissions through continuous simulation.
By Component
| Sub-Segment | Key Trend |
| Solutions / Platforms | Enterprise simulation suites and IoT middleware platforms dominate spending. |
| Services | System-integration consulting and managed-twin-operations contracts are scaling rapidly. |
Solutions and platforms account for the majority of current spending as enterprises build foundational twin capabilities. Services are accelerating as organizations recognize the complexity of multi-domain integration and seek external expertise to bridge physics modeling, data engineering, and change management.
By Deployment Mode
| Sub-Segment | Key Trend |
| On-Premises | Preferred by defense, regulated energy, and data-sovereign industries |
| Cloud | SaaS twin platforms and elastic compute are driving rapid adoption. |
On-premises deployment retains the larger installed base due to latency and data-sovereignty requirements in critical sectors. Cloud deployment is the fastest-growing mode as hyperscaler platforms reduce infrastructure costs and enable global-scale scenario simulation.
By Enterprise Size
| Sub-Segment | Key Trend |
| Large Enterprises | Established IoT estates and dedicated budgets enabling comprehensive twin programs |
| Small and Medium Enterprises (SMEs) | DTaaS subscriptions and no-code builders are lowering the adoption threshold. |
Large enterprises dominate current market revenue, but SMEs represent the highest-growth opportunity as digital-twin-as-a-service platforms democratize access through subscription pricing and pre-configured industry templates.