Home Security Camera Market (2026 - 2035)

Smart Security Camera Market Size, Share and Research Report By Product Type (Bullet, Dome, PTZ (Pan-Tilt-Zoom), Doorbell), By Connectivity (Wired, Wireless), By Power Source (AC-Powered, Battery/Solar-Powered), By Resolution (HD (≤1080p), Full-HD (1080p), 4K and Above), By Application (Indoor, Outdoor, Doorbell) and By Regional (North America, Europe, South America, Asia Pacific, Middle East and Africa) - Industry Forecast to 2035.
ID: MRFR/ICT/2511-CR
100 Pages
Ankit Gupta
Last Updated: July 13, 2026
Home Security Camera Market
Market Size
Forecast Period2026-2035
CAGR (2026-2035)13.90%
2025 Market SizeUSD 25.40 Billion
2035 Market SizeUSD 93.34 Billion
Key Players
Ring
Arlo Technologies
Google Nest
Hikvision
Dahua Technology
Eufy
Opportunities
  • Edge-AI Subscription Platforms
  • Emerging-Market Affordable Camera Tiers
  • Solar-Powered Off-Grid Deployments

Home Security Camera Market Summary

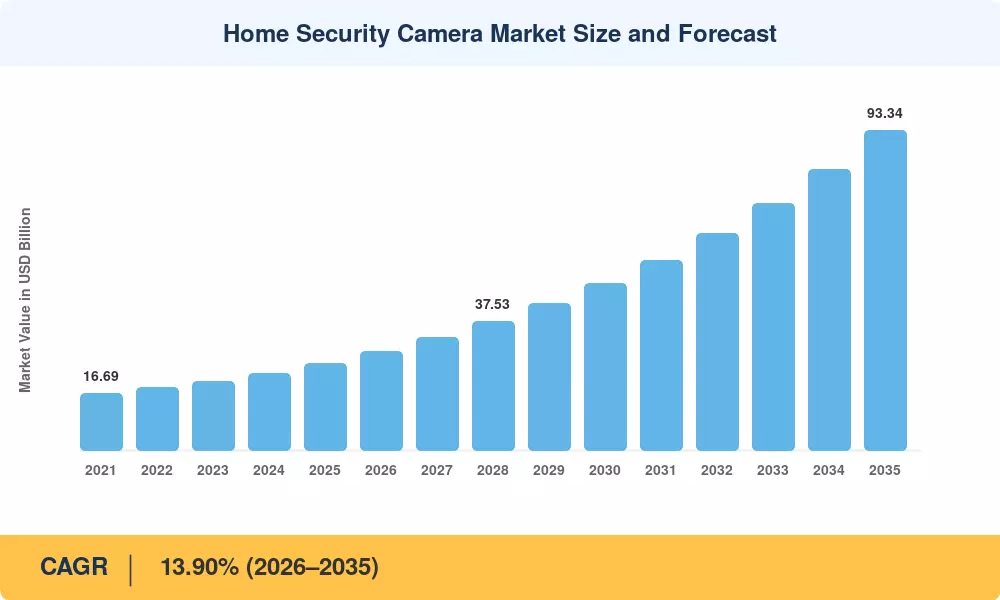
The Home Security Camera Market reached USD 25.40 billion in 2025 and is projected to grow from USD 28.93 billion in 2026 to USD 93.34 billion by 2035, registering a CAGR of 13.90% during the forecast period. Two catalysts anchor this trajectory: insurance carriers in the United States now offer 5–15% premium discounts for verified camera installations [2], and municipal governments across Asia-Pacific have committed over USD 4.2 billion to urban safety digitization programs between 2024 and 2028 [3].

A technology shift is redefining the Home Security Camera Market. Legacy analog CCTV setups — once the residential standard — are giving way to IP-connected cameras with on-device AI inference chips capable of distinguishing between a delivery driver and an intruder in under 200 milliseconds [4]. The U.S. Department of Energy's push for interoperable smart-home ecosystems under the Matter protocol has accelerated integration of cameras with locks, sensors, and voice assistants, turning standalone devices into nodes within a unified home intelligence layer [5].

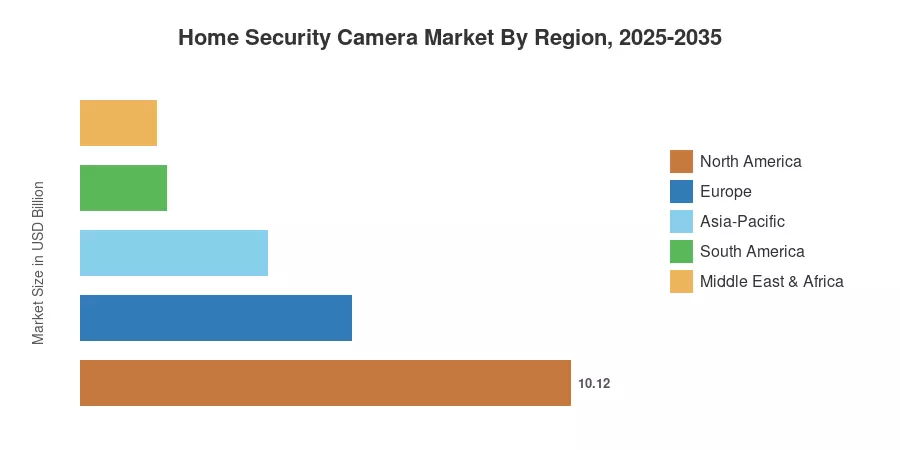
North America commands a 39.85% share of the Home Security Camera Market, driven by the installed base of Ring and Nest ecosystems. Asia-Pacific is the fastest-growing region at a 15.20% CAGR, propelled by urbanization in India and smart-city investments in China and South Korea. Europe holds the second-largest position, accounting for roughly 22.00% of global revenue, where GDPR-compliant local storage options are becoming a competitive differentiator. The next decade will see the Home Security Camera Market evolve from a hardware play into a recurring-revenue platform business.


Key Report Takeaways

• By Product Type

  • Bullet cameras captured 34.90% share of the Home Security Camera Market in 2025, favored for their weather-resistant housings and long-range night vision.
  • Doorbell cameras are forecast to expand at a 14.60% CAGR through 2035, fueled by package-theft prevention and contactless delivery verification.

• By Connectivity & Power Source

  • Wireless systems accounted for 64.70% of the Home Security Camera Market in 2025, reflecting consumer preference for tool-free DIY installation.
  • Battery and solar-powered models are poised to register a 16.35% CAGR, the fastest growth among power-source segments.

• By Region

  • North America remains the largest contributor to the Home Security Camera Market, underpinned by high broadband penetration and smart-home adoption.
  • Asia-Pacific's 15.20% CAGR leads all regions, with India and China driving volume through affordable sub-USD 50 camera SKUs.


Home Security Camera Market Size and Forecast (2021–2035)

Market Research Future's estimates combine bottom-up revenue modeling from 14 product subcategories with top-down validation using import/export trade data and semiconductor shipment volumes for image-sensor SoCs [6].
Home Security Camera Market Size and Forecast
Our Impact
Enabled $4.3B Revenue Impact for Fortune 500 and Leading Multinationals
Partnering with 2000+ Global Organizations Each Year
30K+ Citations by Top-Tier Firms in the Industry

Driver Impact Analysis

Driver ~% Impact on CAGR Geographic Relevance Impact Timeline
Rising urban property crime rates 20–25% Global Short-term (≤2 yr)
AI-powered on-device analytics 18–22% North America, Europe Medium-term (2–4 yr)
Insurance premium discount programs 12–15% North America Short-term (≤2 yr)
Smart-home ecosystem integration 10–14% Global Medium-term (2–4 yr)
Falling image-sensor and SoC costs 10–12% Asia-Pacific Long-term (≥4 yr)
5G and Wi-Fi 6E rollout 8–10% Asia-Pacific, North America Medium-term (2–4 yr)
Municipal smart-city funding programs 6–8% Asia-Pacific, MEA Long-term (≥4 yr)


Rising Urban Property Crime Rates

Property crime reported across the 75 largest U.S. metropolitan areas increased 7.2% between 2022 and 2024, according to the FBI's Uniform Crime Reporting data [2]. Porch-piracy incidents alone cost American consumers an estimated USD 12 billion annually, creating a tangible return-on-investment narrative for doorbell and outdoor cameras. This driver is particularly potent in the short term because it converts latent consumer interest into immediate purchase decisions, often bypassing the longer evaluation cycles typical of smart-home electronics.

AI-Powered On-Device Analytics

Camera vendors have migrated inference workloads from cloud servers to edge neural processing units, reducing latency from seconds to under 200 milliseconds while cutting recurring cloud-compute costs by up to 40% [4]. Qualcomm's QCS8550 and Ambarella's CV72S chipsets — both launched in 2024 — deliver person, vehicle, and animal classification at under 2 watts, making advanced analytics viable even in battery-powered cameras. This shift transforms the Home Security Camera Market from a notification-heavy model prone to false alerts into a context-aware system that ranks and filters events autonomously.

Insurance Premium Discount Programs

State Farm, Allstate, and Liberty Mutual collectively cover over 45 million U.S. homeowner policies and now offer verified-camera discounts averaging 8% on annual premiums [7]. The U.K.'s Association of British Insurers published similar guidelines in 2024, encouraging premium adjustments for homes with smart-monitoring devices. These programs effectively subsidize adoption, lowering the perceived payback period for a USD 200–400 camera system to under 18 months.

Smart-Home Ecosystem Integration

The Connectivity Standards Alliance certified over 2,800 Matter-compatible devices by mid-2025, and security cameras are among the fastest-growing product categories within the protocol [5]. When a camera can trigger a smart lock, activate floodlights, and send a clip to a voice assistant simultaneously, the value proposition extends well beyond surveillance. This ecosystem lock-in deepens consumer switching costs and drives recurring-service attachment rates above 35% for leading brands.


Restraints Impact Analysis

Restraint ~% Impact on CAGR Geographic Relevance Impact Timeline
Data-privacy regulations and compliance costs –3 to –5% Europe, North America Long-term (≥4 yr)
Subscription fatigue and cloud-storage costs –2 to –4% Global Medium-term (2–4 yr)
Cybersecurity vulnerabilities in IoT cameras –2 to –3% Global Short-term (≤2 yr)
Geopolitical restrictions on Chinese brands –1 to –3% North America, Europe Medium-term (2–4 yr)
Bandwidth limitations in rural areas –1 to –2% South America, MEA Long-term (≥4 yr)


Data-Privacy Regulations and Compliance Costs

The European Data Protection Board’s revised Guidelines 3/2019 place tight limits on the residential video capturing of public locations, mandating data-protection impact evaluations and limiting retention periods [9]. Compliance costs manufacturers selling into the EU an estimated USD 1.50-3.00 per gadget per year in engineering and legal overhead. California’s CCPA changes and comparable state-level measures in Illinois and Virginia mean additional fees for vendors doing business in several U.S. jurisdictions.


Subscription Fatigue and Cloud-Storage Costs

In the Home Security Camera Market, the monthly charges for cloud storage range from USD 2.99 to USD 14.99 per camera, presenting a cumulative cost for homes with three or more devices [10]. Consumer research shows that 28% of camera owners cancel premium plans within 12 months, reverting to limited local storage and decreasing lifetime customer value. Vendors who don't offer attractive free tiers risk driving turnover to competitors with substantial on-device recording possibilities.


Cybersecurity Vulnerabilities

In 2024, Bitdefender discovered more than 3.6 million IP cameras globally still operating with default passwords, leaving them open to botnet recruiting and illicit video access [11]. High-profile breaches, such as the 20213 Verkada event that affected 150,000 cameras, damage consumer trust and hinder adoption among privacy-sensitive groups, especially in Europe and Japan.


Home Security Camera Market Opportunities

Edge-AI Subscription Platforms

Camera OEMs are moving from selling hardware once to providing subscription-based analytics tiers with features such as package detection, familiar-face alerts and vehicle-plate monitoring for USD 5–10 a month. This recurring-revenue model can push the gross margins from the hardware-typical range of 28–32% to beyond 55% on a blended basis, altering the economics of the Home Security Camera Market.


Emerging-Market Affordable Camera Tiers

India's residential camera penetration stands below 4%, compared with 18% in the United States. Sub-USD 30 Wi-Fi cameras from brands like Realme and Xiaomi are entering India's Tier-2 and Tier-3 cities, supported by Jio's 4G/5G backhaul. This white-space opportunity could add over USD 3 billion to the Home Security Camera Market by 2032.

Solar-Powered Off-Grid Deployments

Battery and solar-powered cameras are the fastest-growing power-source segment in the Home Security Camera Market, removing the need for AC wiring and expanding addressable locations to barns, gates, and vacation properties. Integrated solar panels now deliver 365-day operation in most U.S. latitudes, eliminating the primary maintenance pain point of battery replacement.

Insurance and PropTech Data Monetization

Anonymized camera-derived data — such as neighborhood activity heatmaps and parcel-delivery frequency indices — hold commercial value for insurance underwriters and last-mile logistics companies. Vendors that build compliant data-exchange frameworks could unlock a secondary revenue stream estimated at USD 800 million annually by 2030.

Professional Property-Management Integration

Multi-dwelling units and vacation-rental platforms like Airbnb require centralized camera management dashboards with role-based access, tamper alerts, and automated privacy masking for guest areas. This B2B2C channel is expanding the Home Security Camera Market into commercial-grade use cases without the overhead of enterprise sales cycles.


Home Security Camera Market Future Outlook

Autonomous AI-Driven Monitoring

By 2030, on-device large vision models will enable cameras to generate natural-language event summaries, shifting the user interaction from reviewing footage to reading concise incident reports. Qualcomm's roadmap targets 30 TOPS (trillion operations per second) in sub-3-watt camera SoCs by 2028, sufficient to run multi-modal models locally [15]. The Home Security Camera Market will increasingly compete on software intelligence rather than lens specifications.

Platform Economics and Recurring Revenue

Hardware margins in the Home Security Camera Market are compressing toward 20% as component commoditization accelerates. The strategic response is platform lock-in: Amazon, Google, and Apple each operate closed ecosystems where cameras, locks, and sensors share a unified subscription. By 2032, Market Research Future estimates that subscription and cloud-services revenue will surpass hardware revenue for the first time, mirroring the SaaS transition that reshaped enterprise software a decade ago [16].

Energy-Autonomous and Off-Grid Systems

Solar panel efficiency improvements — now exceeding 24% for monocrystalline cells embedded in camera housings — are enabling truly wireless, maintenance-free deployments [17]. For the Home Security Camera Market, this unlocks rural, agricultural, and secondary-property applications previously impractical due to wiring constraints. The International Energy Agency projects that distributed solar costs will decline an additional 30% by 2030, further accelerating this segment [18].

Privacy-by-Design and On-Device Processing

Regulatory pressure and consumer backlash against cloud-dependent models are driving a structural shift toward on-device processing and federated learning. Apple's HomeKit Secure Video — which performs all facial classification on the HomePod or Apple TV rather than cloud servers — has set consumer expectations that the Home Security Camera Market's remaining players must now match. This trend favors vendors with strong silicon partnerships and will disadvantage smaller brands reliant on third-party cloud inference APIs.


Home Security Camera Market Segmentation

By Product Type

Segment Key Metric Primary Demand Driver
Bullet 34.90% share (2025) Long-range outdoor surveillance
Dome USD 4.88 Billion (2025) Aesthetic indoor/commercial appeal
PTZ (Pan-Tilt-Zoom) 12.40% CAGR Large-property perimeter coverage
Doorbell 14.60% CAGR Package-theft prevention


Bullet cameras remain the volume leader in the Home Security Camera Market, chosen for their visible deterrent effect and superior infrared range extending beyond 30 meters. Their cylindrical housing accommodates larger lens assemblies, making them the default choice for outdoor perimeter monitoring in both suburban and rural properties.

Doorbell cameras represent the fastest-growing product type, driven by e-commerce delivery volumes that exceeded 21 billion parcels in the United States alone during 2024 [19]. Two-way audio, pre-roll video capture, and integration with smart locks have transformed the doorbell camera from a novelty into a primary point-of-entry security device.

By Connectivity

Segment Key Metric Primary Demand Driver
Wireless 64.70% share (2025) DIY installation, flexible placement
Wired 35.30% share (2025) Reliable power, zero-latency PoE feeds


Wireless systems dominate the Home Security Camera Market because they eliminate professional installation fees averaging USD 150–300 per camera. Wi-Fi 6E adoption is reducing bandwidth congestion in multi-camera households, while mesh-network routers from Eero and TP-Link provide dedicated IoT bands that improve video stream stability.

By Resolution

Segment Key Metric Primary Demand Driver
HD (≤1080p) 41.80% share (2025) Cost-sensitive buyers, sufficient for most use cases
Full-HD (1080p) USD 7.05 Billion (2025) Mainstream sweet spot
4K and above 16.75% CAGR License-plate capture, facial detail at distance


HD cameras still serve the largest installed base in the Home Security Camera Market, particularly in price-driven markets across Southeast Asia and South America. The 4K segment, however, is growing fastest as storage costs decline and AI analytics benefit from higher-resolution input frames for accurate object classification.

By Application

Segment Key Metric Primary Demand Driver
Outdoor 49.85% share (2025) Perimeter security, driveway monitoring
Indoor USD 7.90 Billion (2025) Child, pet, and elderly monitoring
Doorbell 14.90% CAGR Package delivery, visitor verification


Outdoor cameras hold the largest application share in the Home Security Camera Market, reflecting the primary consumer motivation of deterring trespass and property crime. Indoor cameras, meanwhile, are increasingly marketed for caregiving applications — baby monitoring, pet supervision, and remote check-ins on elderly family members — which broadens the addressable demographic beyond security-focused buyers.

By Power Source

Segment Key Metric Primary Demand Driver
AC-Powered 66.90% share (2025) Continuous operation, no battery changes
Battery/Solar-Powered 16.35% CAGR Off-grid locations, rental-friendly install


AC-powered devices remain the majority choice within the Home Security Camera Market for consumers prioritizing 24/7 recording without maintenance. Battery and solar-powered alternatives are gaining share rapidly among renters — who cannot modify wiring — and owners of secondary or vacation properties where electrical access is limited.


Regional Market Share Analysis

Region Key Metric Primary Investment Themes
North America 39.85% share (2025) Insurance incentives, smart-home ecosystems
Europe 22.00% share (2025) GDPR-compliant local storage, retrofit demand
Asia-Pacific 15.20% CAGR Smart-city programs, affordable camera tiers
South America USD 1.78 Billion (2025) Urban security concerns, broadband expansion
Middle East & Africa 6.15% share (2025) Mega-project surveillance, hospitality sector
Total USD 25.40 Billion (2025)

The Home Security Camera Market exhibits a clear geographic hierarchy, with North America and Asia-Pacific together accounting for nearly two-thirds of global revenue.


North America

Country Key Metric Key Driver
United States 81.50% of regional share Insurance discounts, Ring/Nest installed base
Canada 11.20% of regional share Cold-climate smart-home adoption
Mexico 7.30% of regional share Urban security concerns in metro areas


The United States drives North American demand through a combination of high broadband penetration (92% of households), established smart-speaker ecosystems, and aggressive insurance-incentive programs. Amazon's Ring ecosystem alone holds an estimated 25–30 million active camera subscriptions. Canada mirrors many U.S. trends but lags slightly in doorbell-camera adoption due to colder climates reducing porch-piracy exposure. Mexico's growth is concentrated in Monterrey, Guadalajara, and Mexico City, where rising middle-class incomes coincide with heightened personal-safety awareness.

Europe

Country Key Metric Key Driver
Germany 14.80% CAGR Energy-efficient smart-home bundles
United Kingdom 26.50% of regional share Post-pandemic home-improvement spending
France USD 1.10 Billion (2025) Insurance and home-automation subsidies
Italy 9.80% of regional share Villa and rural-property security
Spain 7.20% of regional share Tourism property monitoring
Nordic Countries 10.50% of regional share High digital literacy, early tech adoption
Russia 5.40% of regional share Domestic-brand substitution
Rest of Europe 14.60% of regional share Mixed regulatory landscape


Europe's Home Security Camera Market is shaped by the dual forces of privacy regulation and renovation spending. The U.K. accounts for the largest national share, buoyed by a cultural acceptance of CCTV that predates the smart-camera era. German consumers increasingly bundle cameras with solar-panel and heat-pump installations, leveraging integrated smart-home platforms from Bosch and Deutsche Telekom. GDPR requirements have pushed vendors to offer local SD-card and NAS storage options, creating a differentiation axis absent in the North American market.

Asia-Pacific

Country Key Metric Key Driver
China 38.20% of regional share Domestic manufacturing, Xiaomi/Hikvision scale
India 17.40% CAGR Affordable sub-USD 30 cameras, Jio connectivity
Japan 14.90% of regional share Aging-population remote monitoring
South Korea 11.30% of regional share 5G infrastructure, Samsung ecosystem
ASEAN 10.80% of regional share Urbanization, gated-community demand
Rest of Asia-Pacific 8.40% of regional share Emerging broadband access


Asia-Pacific represents the growth engine of the Home Security Camera Market. China's dominance stems from vertically integrated manufacturers like Hikvision and Dahua, which control sensor fabrication through final assembly. India is the region's breakout story — Reliance Jio's affordable data plans have brought 450 million households online, and local brands are pairing cameras with vernacular-language apps to penetrate non-metro markets. Japan's adoption skews toward indoor cameras used for elderly-parent monitoring, a use case that resonates across the country's aging demographic profile.

South America

Country Key Metric Key Driver
Brazil 62.30% of regional share Urban security, e-commerce parcel protection
Argentina 18.50% of regional share Residential gated-community growth
Rest of South America 19.20% of regional share Gradual broadband expansion


Brazil anchors South America's Home Security Camera Market, where high urban crime rates in São Paulo and Rio de Janeiro create a strong baseline demand. Mercado Libre's logistics expansion has increased porch-delivery volumes, spurring doorbell-camera interest among middle-income consumers. Argentina's market is concentrated in Buenos Aires metropolitan area gated communities, where HOA-managed camera networks are becoming standard infrastructure.

Middle East & Africa

Country Key Metric Key Driver
Saudi Arabia 28.40% of regional share Vision 2030 smart-city construction
UAE 25.60% of regional share Luxury residential and hospitality sector
South Africa 19.70% of regional share Private security integration
Egypt 12.30% of regional share New Administrative Capital development
Rest of MEA 14.00% of regional share Nascent infrastructure buildout


The Middle East & Africa region's Home Security Camera Market is bifurcated between Gulf Cooperation Council states investing in premium smart-home ecosystems and Sub-Saharan African markets where solar-powered, cellular-connected cameras address areas with unreliable grid electricity. Saudi Arabia's NEOM and The Line projects specify integrated camera networks across residential zones, while South Africa's private security sector — one of the world's largest per capita — is migrating from manned patrols to remote video-verification models.


Home Security Camera Market By Region, 2025-2035

Competitive Benchmarking

The Home Security Camera Market exhibits medium concentration, with the top five vendors estimated to hold approximately 48–55% of global revenue. The Herfindahl-Hirschman Index sits in the 800–1,200 range, indicating a moderately fragmented competitive structure where brand ecosystem loyalty and subscription attach rates create meaningful but not insurmountable barriers to entry.

Company Est. Revenue Share Range Key Offerings Strategic Positioning
Ring (Amazon) ~12–16% Ring Stick Up Cam, Video Doorbell, Floodlight Cam Ecosystem lock-in via Alexa; neighborhood-alert network
Arlo Technologies ~8–11% Arlo Ultra 2, Pro 5S, Essential cameras Premium wire-free positioning; AI-subscription tiers
Google Nest ~7–10% Nest Cam (battery/wired), Nest Doorbell Google Home integration; on-device ML processing
Hikvision ~6–9% EZVIZ C6/C3 series Vertical integration from sensor to cloud
Dahua Technology ~4–7% Imou Ranger/Bullet series Cost leadership in APAC and emerging markets
Eufy (Anker) ~4–6% SoloCam, Video Doorbell Dual Privacy-first local storage; no subscription fees
Wyze Labs ~3–5% Wyze Cam v4, Doorbell Pro Ultra-affordable entry point; freemium cloud model
TP-Link (Tapo) ~3–5% Tapo C520WS, C225 Budget-friendly smart-home bundles
Reolink ~2–4% Argus 4 Pro, TrackMix series Dual-lens and 4K specialization
SimpliSafe ~2–3% SimpliCam, Video Doorbell Pro Integrated alarm-system bundling


Recent News & Developments

  • Ring (Amazon) (July 2021 ): Launched end-to-end encryption for all Ring camera models globally, addressing years of privacy criticism and reinforcing trust in the Home Security Camera Market [20].


  • Eufy (Anker) (September 2023): Released the SoloCam S340 with 360-degree pan and 8× zoom, positioning against higher-priced PTZ competitors in the Home Security Camera Market [23].


  • Wyze Labs (2024 ): Launched Wyze Cam v4 with color night vision at a USD 35.99 price point, intensifying price competition across the Home Security Camera Market [24].


Home Security Camera Market Report Scope

Parameter Detail
Market Scope Global Home Security Camera Market covering hardware, software, and subscription services
Study Period 2021–2035
CAGR 13.90% (2026–2035)
Base Year Market Size USD 25.40 Billion (2025)
Forecast Endpoint USD 93.34 Billion (2035)
Fastest Growing Segment Battery/Solar-Powered (by power source); Doorbell (by product type)
Companies Profiled 10+ (Ring, Arlo, Google Nest, Hikvision, Dahua, Eufy, Wyze, TP-Link, Reolink, SimpliSafe)
Valuation Currency USD Billion


FAQs

How do camera subscription costs affect long-term total cost of ownership?
A household running four cameras on premium cloud plans spends USD 480–720 annually, often exceeding the original hardware cost within two years. Buyers should compare lifetime subscription pricing alongside upfront device cost [10].
Which wireless protocol delivers the most reliable multi-camera performance?
Wi-Fi 6E on the 6 GHz band offers the lowest latency and least interference for homes with four or more cameras. Mesh routers with dedicated IoT bands further reduce dropout rates [8].
How does the Home Security Camera Market address rental-property installation constraints?
Battery-powered magnetic-mount cameras require no drilling or wiring, making them fully removable at lease end. Brands like Arlo and Eufy specifically market renter-friendly designs [21].
What cybersecurity certifications should buyers prioritize when selecting a camera?
Look for devices certified under ETSI EN 303 645 or the upcoming U.S. Cyber Trust Mark, which verify that firmware updates, encrypted streams, and unique credentials meet baseline security standards [11].
How does the Home Security Camera Market serve multi-dwelling property managers?
Centralized dashboards allow managers to oversee dozens of units with role-based access, automated privacy masking, and integrated maintenance alerts. Several vendors now offer volume-licensing tiers for 50+ camera deployments [16].
What trade-offs exist between local storage and cloud-based recording?
Local NAS or SD-card storage eliminates subscription fees and keeps footage on-premises, but lacks remote access during router outages. Cloud plans offer redundancy and off-site backup at recurring cost [10].
How does the Home Security Camera Market integrate with professional monitoring services?
Select vendors partner with central-station monitoring firms to escalate verified camera alerts to emergency dispatch within 30 seconds. This hybrid model combines DIY cameras with professional response [7].    
Author
Author
Author Profile
Ankit Gupta LinkedIn
Team Lead - Research
Ankit Gupta is a seasoned market intelligence and strategic research professional with over six plus years of experience in the ICT and Semiconductor industries. With academic roots in Telecom, Marketing, and Electronics, he blends technical insight with business strategy. Ankit has led 200+ projects, including work for Fortune 500 clients like Microsoft and Rio Tinto, covering market sizing, tech forecasting, and go-to-market strategies. Known for bridging engineering and enterprise decision-making, his insights support growth, innovation, and investment planning across diverse technology markets.

Research Approach


Secondary Research

The secondary research process involved comprehensive analysis of regulatory databases, industry associations, technology publications, consumer electronics databases, and authoritative security organizations. Key sources included the U.S. Federal Trade Commission (FTC), European Union Agency for Cybersecurity (ENISA), National Institute of Standards and Technology (NIST) Cybersecurity Framework, Consumer Technology Association (CTA), Security Industry Association (SIA), Electronic Security Association (ESA), International Security Industry Organization, FBI Uniform Crime Reporting (UCR) Program, Bureau of Justice Statistics, Eurostat Crime and Criminal Justice Statistics, UN Office on Drugs and Crime (UNODC), Consumer Product Safety Commission (CPSC), IEEE Standards Association for video surveillance protocols, IPVM (Video Surveillance Research), and national telecommunications regulatory authorities (FCC, Ofcom, Anatel).

These sources were employed to gather data on the shipment of IoT devices, the penetration of smart homes, cybersecurity incidents, crime rate correlations, regulatory compliance standards (GDPR, CCPA for video surveillance), patent filings, and competitive intelligence for wired, wireless, and cellular-connected camera systems.


Primary Research

Qualitative and quantitative insights were obtained by interviewing supply-side and demand-side stakeholders during the primary research process. The supply-side sources consisted of CEOs, CTOs, VPs of Hardware Engineering, AI/Computer Vision leads, and directors of Channel Strategy from home security camera manufacturers, chipset suppliers (video processing SoCs), and cloud service providers. Demand-side sources included procurement leads from retail electronics chains, e-commerce platforms, and telecommunications carriers that bundle security services, as well as smart home integrators, residential security installers, home automation consultants, property management firms, and insurance risk assessment professionals. The market segmentation was validated across dome, bullet, and IP camera form factors through primary research. AI feature roadmaps (facial recognition, package detection) were confirmed, and insights on pricing elasticity, subscription attachment rates, and competitive displacement dynamics between DIY and professionally installed segments were gathered.

Primary Respondent Breakdown:

By Designation: C-level Primaries (28%), Director Level (35%), Others (37%)

By Region: North America (38%), Europe (25%), Asia-Pacific (32%), Rest of World (5%)


Market Size Estimation

Unit shipment tracking and revenue mapping across hardware and recurring services were employed to determine the global market valuation. The methodology comprised the following:

Identification of over 50 key manufacturers and OEMs in North America, Europe, Asia-Pacific, and Latin America

Product mapping for dome cameras, bullet cameras, IP/network cameras, and analog-to-IP migration pathways

Examination of the annual revenues that have been reported and modeled with respect to the hardware and cloud storage/monitoring subscriptions of home security cameras.

Manufacturers that account for 75-80% of the global market share in 2024 are included in the coverage.

Derive segment-specific valuations for indoor/outdoor, HD/non-HD, and professional/managed service categories through extrapolation using bottom-up (unit shipments × blended ASP by channel and region) and top-down (component supply chain validation, foundry capacity allocation for image sensors) approaches.

Download Free Sample

Kindly complete the form below to receive a free sample of this Report

Download PDF ×

We do not share your information with anyone. However, we may send you emails based on your report interest from time to time. You may contact us at any time to opt-out.
















