Segmentation Quick Reference
| Dimension | Sub-Segments | Dominant Segment | Fastest Growing Segment |
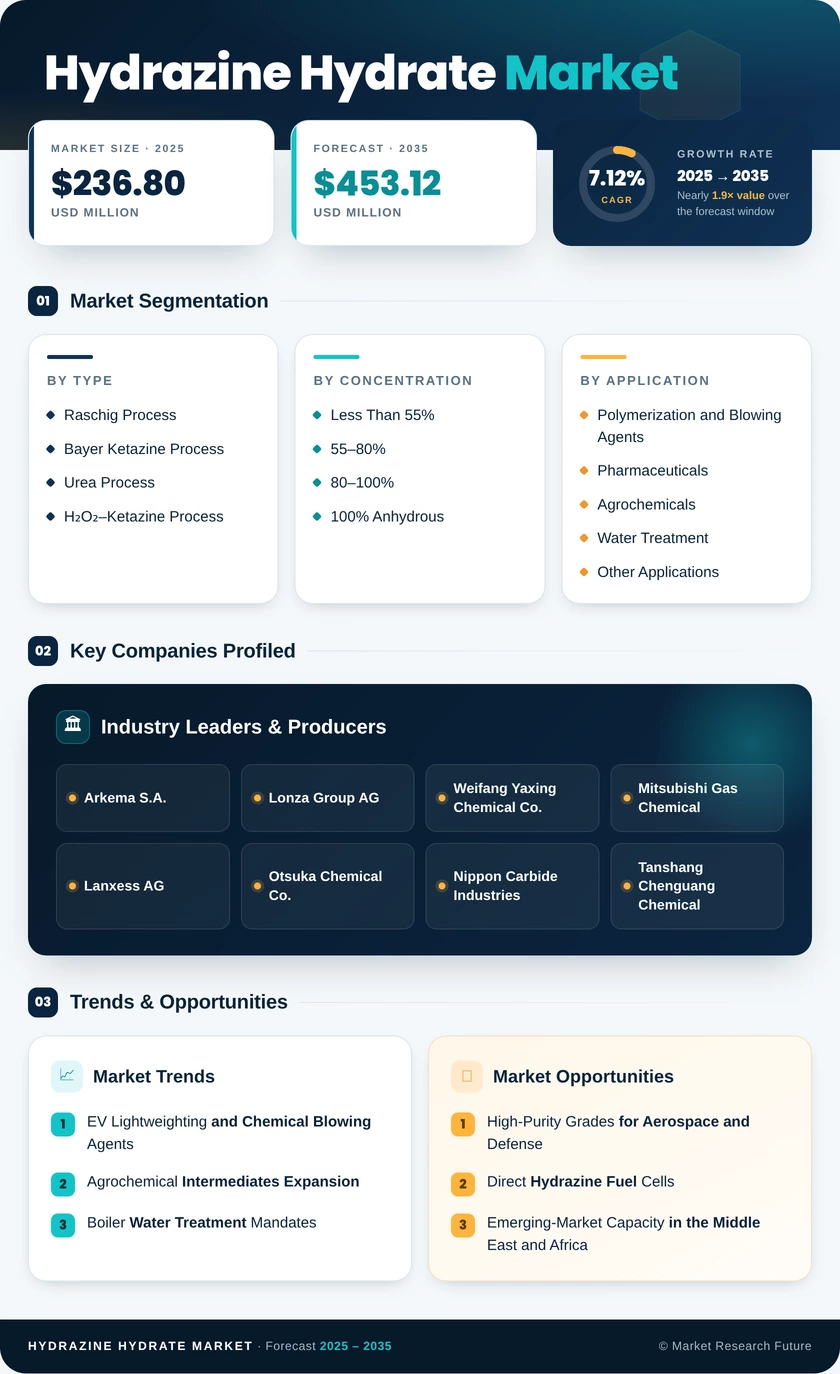
| Production Process | Raschig Process, Bayer Ketazine Process, Urea Process, H₂O₂–Ketazine Process | Bayer Ketazine Process (47.90% share, 2025) | H₂O₂–Ketazine Process (7.85% CAGR) |
| Concentration | Less Than 55%, 55–80%, 80–100%, 100% Anhydrous | 80–100% (55.20% share, 2025) | 100% Anhydrous (7.92% CAGR) |
| Application | Polymerization and Blowing Agents, Hydrazine Hydrate Markets, Agrochemicals, Water Treatment, Other Applications | Polymerization and Blowing Agents (44.80% share, 2025) | Other Applications (8.25% CAGR) |
| Geography | Asia-Pacific, North America, Europe, South America, the Middle East & Africa | Asia-Pacific (56.10% share, 2025) | Asia-Pacific (7.72% CAGR) |
Market Segmentation Overview
By Production Process
| Sub-Segment | Key Trend |
| Raschig Process | Declining share as chlorinated-waste regulations tighten globally |
| Bayer Ketazine Process | Stable workhorse technology with the largest installed base |
| Urea Process | Niche adoption for small-scale fine chemical synthesis applications |
| H₂O₂–Ketazine Process | Fastest-growing route driven by green-chemistry mandates and lower energy intensity |
The production-process landscape is undergoing a generational transition. While the Bayer Ketazine Process retains its dominant installed base, every major capacity announcement since 2023 has specified the H₂O₂–Ketazine route, reflecting tightening environmental regulations and buyer preference for chloride-free product.
By Concentration
| Sub-Segment | Key Trend |
| Less Than 55% | Primarily consumed in water treatment and dilute industrial applications |
| 55–80% | Growing demand from agrochemical and polymer intermediate producers |
| 80–100% | Commercial workhorse grade serving pharmaceutical and blowing-agent sectors |
| 100% Anhydrous | Premium-priced segment driven by aerospace, defense, and fuel-cell applications |
Concentration segmentation reflects end-use purity requirements. The 80–100% grade dominates volume, but the 100% Anhydrous category commands the highest margins and the fastest growth trajectory as defense and aerospace applications expand.
By Application
| Sub-Segment | Key Trend |
| Polymerization and Blowing Agents | Driven by EV lightweighting and construction insulation foam demand |
| Hydrazine Hydrate Markets | Isoniazid and pyrazole-class API production sustains steady procurement. |
| Agrochemicals | Herbicide and fungicide synthesis drives bulk-volume consumption in Asia. |
| Water Treatment | Boiler oxygen scavengers remain essential in high-pressure thermal power systems. |
| Other Applications | Rocket propellants and fuel-cell R&D create high-margin, fast-growing niches. |
Application diversity is a defining characteristic of the hydrazine hydrate value chain. Polymerization and blowing agents anchor volume, while the "Other Applications" category—spanning defense propellants and emerging energy systems—offers the strongest growth and margin profile through 2035.
By Geography
| Sub-Segment | Key Trend |
| Asia-Pacific | Production and consumption hub led by China and India |
| Europe | High-value specialty demand in aerospace and power generation |
| North America | Defense-driven procurement and stringent water treatment standards |
| South America | Agricultural-sector growth supports the demand for agrochemical intermediates. |
| Middle East & Africa | Import substitution and new capacity development under Vision 2030 |
Asia-Pacific's dominance reflects both supply-side concentration (China's production clusters) and demand-side pull from the world's largest agrochemical and pharmaceutical manufacturing bases. Europe and North America are characterized by higher unit values driven by specialty and defense-grade applications.