In mold Labels Market (2026 - 2035)

In-Mold Labels Market Research Report Information By Molding Process (Injection Molding, Blow Molding, Thermoforming, and Compression & Others), By Resin Type (Polypropylene, Polyethylene, Polystyrene, and ABS & Others), By Printing Technology (Offset, Flexography, Rotogravure, and Digital), By End-Use Industry (Food & Beverage, Personal Care & Cosmetics, Home Care & Household, Pharmaceuticals, Industrial & Lubricants, and Others) – Forecast Till 2035.
ID: MRFR/PCM/1258-HCR
140 Pages
Sakshi Gupta
Last Updated: August 24, 2026
In mold Labels Market
Market Size
Forecast Period2026-2035
CAGR (2026-2035)5.6%
2025 Market SizeUSD 2.84 Billion
2035 Market SizeUSD 4.90 Billion
Key Players
CCL Industries
Multi-Color Corporation
Constantia Flexibles
Huhtamaki Oyj
Coveris
Fuji Seal International
Opportunities
  • Recycled-Content Label Substrates
  • Emerging-Market Dairy and Edible Oil Conversion
  • Connected Packaging and Data Monetization

In mold Labels Market Summary

The In-mold Labels Market reached USD 2.84 billion in 2025 and enters the forecast window at USD 3.00 billion in 2026, climbing to USD 4.90 billion by 2035 at a 5.6% CAGR. Two catalysts anchor that trajectory. Regulation (EU) 2025/40 — the Packaging and Packaging Waste Regulation — obliges all packaging placed on the EU market to be recyclable by design from 2030, pushing brand owners toward mono-material polypropylene containers where the decoration and the container share one resin stream [1]. Rigid packaging capital spending across food, dairy and home care converters exceeded USD 19 billion globally in 2024, and a growing slice of that budget now funds in-mold-capable tooling [2].

Decoration technology is shifting underneath the category. Pressure-sensitive and shrink-sleeve decoration, both of which introduce a second polymer and an adhesive layer into the recycling stream, are steadily ceding thin-wall container volume to fused polypropylene labels applied inside the mold. Converters report scrap and changeover savings of 12–18% on high-volume dairy and margarine lines after switching [3]. RecyClass design guidance issued in 2024 explicitly rewards mono-PP construction, giving procurement teams a compliance reason to move.

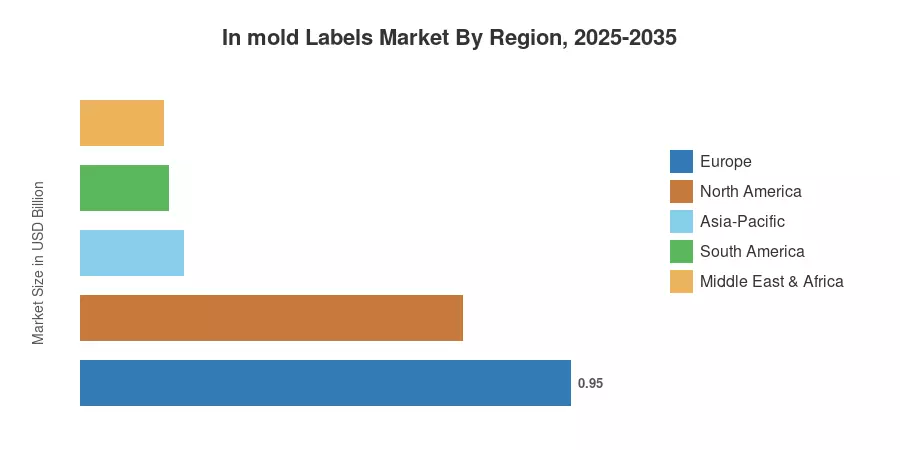
Europe holds roughly 33.5% of global revenue in 2025, supported by a dense installed base of injection-molding decorators in Germany, Italy and Poland. Asia-Pacific is the growth engine, expanding at approximately 6.9% through 2035 as Indian and Chinese dairy and edible-oil packers convert to rigid tubs. North America ranks second at about a 26% share, driven by private-label food consolidation. The In-mold Labels Market will be decided over the next decade by who can print short runs profitably.


Key Report Takeaways

• By Molding Process


  • Injection molding accounts for 52.0% of In-mold Labels Market revenue in 2025, reflecting entrenched use in thin-wall food containers.
  • Thermoforming-applied labels post the fastest process CAGR at 6.4%, tracking growth in single-serve dairy cups.
  • Digital printing of in-mold labels grows at roughly 9.2% CAGR, unlocking sub-20,000-unit runs.

• By End-Use Industry


  • Food and beverage contributes about 41% of demand, the single largest end-use block in the In-mold Labels Market.
  • Pharmaceutical container decoration expands at approximately 6.6% CAGR on serialization and tamper-evidence needs.
  • Home care and household chemical packaging represents roughly USD 0.44 billion of 2025 revenue.

• By Region

  • Europe leads with 33.5% revenue share, underpinned by PPWR compliance investment.
  • Asia-Pacific grows fastest at 6.9% CAGR through 2035
  • North America generated close to USD 0.74 billion in 2025


Market Size and Forecast (2021–2035)

Estimates blend converter-level shipment data from label association reporting, resin consumption tracked through polypropylene film demand, and bottom-up modelling of installed injection and thermoforming capacity across 34 countries. Historical values were reconciled against published packaging revenue disclosures from listed converters and cross-checked with trade statistics for oriented polypropylene film. Forecasts assume no structural resin shortage and stable freight costs.
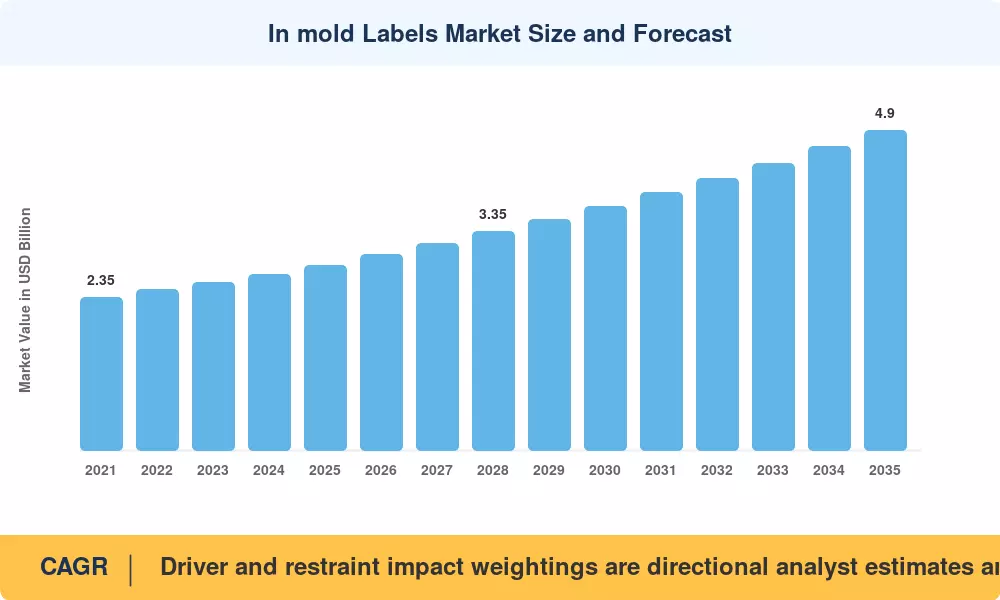
In mold Labels Market Size and Forecast
Our Impact
Enabled $4.3B Revenue Impact for Fortune 500 and Leading Multinationals
Partnering with 2000+ Global Organizations Each Year
30K+ Citations by Top-Tier Firms in the Industry

Driver Impact Analysis

Driver ~% Impact on CAGR Geographic Relevance Impact Timeline
Mono-material recyclability mandates 24% Europe, North America Medium-term (2–4 yr)
Thin-wall rigid container growth in food 19% Asia-Pacific, Global Long-term (≥4 yr)
Brand differentiation and shelf appeal 15% Global Short-term (≤2 yr)
Digital printing cost curve decline 12% Europe, North America Medium-term (2–4 yr)
Converter labour and scrap cost reduction 11% Global Short-term (≤2 yr)
Cold-chain and moisture-resistant decoration 10% Asia-Pacific, MEA Long-term (≥4 yr)
Pharmaceutical tamper evidence requirements 9% North America, Europe Long-term (≥4 yr)


Recyclability Regulation Rewrites the Decoration Specification

Regulation (EU) 2025/40 sets binding recyclability performance grades from 2030 and a 10% packaging waste reduction target against 2018 baselines by 2035 [1]. Labels that leave a foreign polymer in the wash stream drag a container's grade downward, and a downgrade carries a direct financial cost through modulated extended-producer-responsibility fees, which in France already vary by more than 50% between well-designed and poorly designed formats [12]. The In-mold Labels Market benefits directly: a fused polypropylene label on a polypropylene tub survives flotation sorting as a single material.

Thin-Wall Food Packaging Volume Expansion

Global thin-wall rigid container output grew roughly 4.8% in 2024, with dairy, spreads and prepared meals accounting for the bulk of incremental units [2]. Injection molders running four- to sixteen-cavity tools at cycle times under six seconds need decoration that adds zero downstream steps. Robotic label placement inside the mold removes the labelling station entirely, and converter case studies show line-level throughput gains near 9% versus post-mold application [3].

Digital Printing Lowers the Minimum Economic Run

UV inkjet and electrophotographic presses qualified for in-mold substrates have cut plate and setup costs to near zero, moving the breakeven run length from roughly 80,000 units to under 20,000 [8]. Regional SKUs, seasonal promotions and private-label variants that previously defaulted to pressure-sensitive decoration now clear the economic hurdle for in-mold production.

Total Cost of Ownership in Converting Operations

Labour, adhesive, and label-waste line items disappear when decoration happens inside the mold. Independent benchmarking across eleven European converters found combined savings of 12–18% per thousand containers, with the steepest gains on runs above 500,000 units [3]. Payback on magazine and robot retrofits typically lands inside 26 months.


Restraints Impact Analysis

Restraint ~% Negative Impact Geographic Relevance Impact Timeline
High tooling and robotics capital outlay 28% Asia-Pacific, South America Medium-term (2–4 yr)
Design change inflexibility once tooled 22% Global Short-term (≤2 yr)
Polypropylene film price volatility 19% Global Short-term (≤2 yr)
Competition from shrink sleeves and pressure-sensitive 17% North America, Asia-Pacific Long-term (≥4 yr)
Limited applicability to glass and metal containers 14% Europe, MEA Long-term (≥4 yr)


Capital Intensity Blocks Smaller Converters

Depending on cavitation [7], one in-mold-capable cell – magazine, side-entry robot, static charging system and cavity alteration – costs between USD 180,000 and USD 450,000. Converters producing less than approx. 40 million containers a year find it hard to justify that expense, restricting adoption to large regional packers and slowing penetration in fragmented South Asian and Latin American supply chains.


Volatility in Polypropylene Film Pricing

The prices of oriented polypropylene film changed more than 30% from the high in 2022 to the bottom in 2024, following the propylene feedstock and European energy prices [4]. That volatility hampers multi-year supply agreements, and the label substrate contributes about 45-60% of delivered label cost, so pressure-sensitive alternatives sometimes look cheaper on a quarterly basis.


Rigidity of the Design Cycle

Artwork adjustments are inexpensive. Container changes, not so much. Once a label is dimensioned to a given cavity geometry, every packaging redesign obsoletes the entire label inventory. It may necessitate tool rework [13]. It’s uncomfortable for marketing teams that refresh graphics every quarter, and continues to be the biggest issue in specification reviews.


In mold Labels Market Opportunities

Recycled-Content Label Substrates

Qualified post-consumer recycled polypropylene film for direct food contact is now undergoing the EFSA and FDA review routes, and early commercial grades have 30% PCR content [15]. A label itself using recycled resin allows brand owners to claim compliance against 2030 content criteria without changing container design.


Emerging-Market Dairy and Edible Oil Conversion

India's packaged dairy sector expanded at roughly 11% annually through 2024, and edible oil packers are migrating from pouches to rigid tubs for premium tiers [9]. Converters entering Tier-2 Indian and Southeast Asian cities with mid-cavitation cells face little incumbent competition, and the In-mold Labels Market in Asia-Pacific rewards early tooling commitments.

Connected Packaging and Data Monetization

Unique digital codes printed variably during the label run turn every container into an addressable consumer touchpoint. GS1 Digital Link migration, targeted for broad retail readiness by 2027, makes serialized on-pack codes scannable at checkout and by consumers alike [16]. Converters that sell code management and scan analytics alongside labels capture recurring revenue rather than one-time print margin.

Pharmaceutical and Nutraceutical Containers

Tamper-evident, moisture-resistant decoration on high-density polyethylene and polypropylene pill containers is underserved. Falsified Medicines Directive verification and comparable US serialization rules push manufacturers toward decoration that cannot be peeled and reapplied [11]. Label fusion is inherently tamper-evident, which is a technical advantage that has barely been marketed.

Short-Run Private Label

Retail private label reached roughly 24% of US grocery dollar share in 2024 and continues gaining [17]. Private-label SKUs are numerous and individually small — precisely the profile that digital in-mold printing now serves economically.


In mold Labels Market Future Outlook

Circularity Becomes the Default Specification

By 2030, the OECD projects global plastics use will rise above 550 million tonnes, intensifying policy attention on design-for-recycling [21]. Mono-material construction stops being a differentiator and becomes the baseline requirement, which structurally favours fused polypropylene decoration over adhesive-bonded alternatives.

Digital Presses Reshape Converter Economics

Press vendors expect qualified in-mold digital capacity to more than double by 2030 as substrate primers and ink adhesion improve [8]. Converters will run hybrid fleets, reserving offset for the top decile of SKUs by volume and pushing everything else through digital, which compresses lead times from weeks to days.

Automation and Vision Inspection

Machine-vision placement verification at cycle speeds under five seconds is now commercially proven, cutting mold-damage incidents that historically deterred adoption [7]. Falling robot costs and better cavity-level rejection logic will pull the viable cavitation threshold downward, opening mid-size converters.

Traceability as a Revenue Line

Serialized on-pack identifiers tied to GS1 Digital Link standards will carry recycling instructions, provenance data and consumer engagement in one code by the end of the decade [16]. Label suppliers that own the code layer capture margin that pure print work cannot.


In mold Labels Market Segmentation

Segment structure in the In-mold Labels Market follows the molding process first, because process choice dictates label film gauge, print method and achievable geometry.

By Molding Process

Segment Metric (2025) Primary Demand Driver
Injection Molding 52.0% share Thin-wall food container output
Blow Molding USD 0.79 Billion Home care and lubricant bottles
Thermoforming 6.4% CAGR Single-serve dairy cups
Compression & Others 4.0% share Closures and specialty formats


Injection molding dominates the In-mold Labels Market because cycle times and cavitation economics align almost perfectly with in-mold decoration. Blow molding trails but is gaining in household chemical bottles, where labels must survive surfactant contact that defeats pressure-sensitive adhesives.

By Resin Type

Segment Metric (2025) Primary Demand Driver
Polypropylene 64% share Mono-material recyclability
Polyethylene 5.1% CAGR Blow-molded bottle compatibility
Polystyrene USD 0.26 Billion Legacy dairy cup formats
ABS & Others 6% share Durable goods and industrial parts


Polypropylene's dominance in the In-mold Labels Market is structural rather than cyclical, since matching label and container resin is the entire recyclability argument. Polystyrene continues a slow decline as European and North American dairy packers migrate away from the resin.

By Printing Technology

Segment Metric (2025) Primary Demand Driver
Offset 46% share High-volume photorealistic decoration
Flexography 5.9% CAGR Mid-run cost efficiency
Rotogravure USD 0.51 Billion Long-run Asian food packaging
Digital 9.2% CAGR Short runs and versioning


Offset remains the dominant printing technology within the in-mold labels market, anchored by its superior high-resolution graphic reproduction for mass-produced dairy and food tubs. Digital printing stands out as the fastest-growing technology segment, propelled by brand demand for variable data, localized packaging versions, and rapid turnaround for short runs.

By End-Use Industry

Segment Metric (2025) Primary Demand Driver
Food & Beverage 41% share Dairy, spreads and prepared meals
Personal Care & Cosmetics 6.1% CAGR Premium finish requirements
Home Care & Household USD 0.44 Billion Chemical resistance needs
Pharmaceuticals 6.6% CAGR Tamper evidence and serialization
Industrial & Lubricants 8.5% share Durability in harsh environments
Others 9% share Horticulture, paints, pet care


Food and beverage anchors the In-mold Labels Market and will continue to, but pharmaceuticals represent the most interesting margin opportunity because validation requirements raise switching costs and protect incumbent suppliers [11].


Regional Market Share Analysis

Region Metric (2025) Primary Investment Themes
North America USD 0.74 Billion Private-label expansion, digital press installs
Europe 33.5% share PPWR compliance, mono-PP redesign
Asia-Pacific 6.9% CAGR (2026–2035) Dairy conversion, greenfield tooling
South America 6.0% share Home care packaging, regional brand growth
Middle East & Africa 5.8% CAGR (2026–2035) Edible oil, localization of converting
Total USD 2.84 Billion

Regional performance in the In-mold Labels Market splits cleanly between compliance-driven replacement demand in mature economies and capacity-driven new demand across developing packaging hubs.


North America

Country Metric Key Driver
United States 82% of regional revenue Private-label grocery growth
Canada 5.2% CAGR Dairy and prepared-food packaging
Mexico USD 0.09 Billion Nearshored household chemical filling


The In-mold Labels Market in North America is driven less by regulation than by retailer economics. State-level EPR statutes in California, Colorado, Oregon and Maine begin fee assessment between 2025 and 2028, and eco-modulated schedules there mirror European logic by penalizing multi-material constructions [18]. Mexican converting capacity continues expanding as household and personal care fillers relocate closer to US distribution.

Europe

Country Metric Key Driver
Germany 24% of regional revenue Dairy and spreads packaging density
United Kingdom USD 0.13 Billion Chilled ready-meal containers
France 5.0% CAGR Eco-modulated EPR fee structure
Italy 11% of regional revenue Confectionery and deli formats
Rest of Europe USD 0.28 Billion Polish and Turkish converting capacity


European demand rests on the deepest installed decorator base worldwide. France's Citeo bonus-malus schedule has applied recyclability-linked fee modulation since 2023, and packaging judged non-recyclable can attract penalties above 50% of the base rate [12]. That pricing signal, combined with PPWR, makes mono-material specification a finance decision rather than a sustainability preference.

Asia-Pacific

Country Metric Key Driver
China 37% of regional revenue Thin-wall food container output
India 8.4% CAGR Dairy and edible oil rigid conversion
Japan USD 0.13 Billion Premium confectionery decoration
South Korea 7% of regional revenue Cosmetics packaging quality standards
Rest of Asia-Pacific 6.5% CAGR Indonesian and Vietnamese capacity builds


Asia-Pacific carries the fastest expansion in the In-mold Labels Market. India's Plastic Waste Management Rules introduced EPR registration and recycling targets covering rigid plastic categories, with obligations tightening through 2028 [19]. Chinese converters, meanwhile, have added cavitation aggressively since 2023, and domestic robot suppliers have cut cell installation costs materially below imported equivalents.

South America

Country Metric Key Driver
Brazil 58% of regional revenue Home care and dairy packaging
Argentina 5.6% CAGR Import substitution in converting
Rest of South America USD 0.03 Billion Andean food processing growth


Brazilian demand concentrates in São Paulo and Paraná converting clusters serving multinational home care brands. Currency instability lengthens capital approval cycles, so adoption tends to follow multinational parent mandates rather than local initiative.

Middle East & Africa

Country Metric Key Driver
Saudi Arabia 26% of regional revenue Vision 2030 localization of packaging
United Arab Emirates 7.1% CAGR Re-export food packaging hub
South Africa USD 0.03 Billion Dairy and margarine containers
Rest of MEA 34% of regional revenue Edible oil and detergent packaging


Saudi industrial localization programs offer financing support for packaging conversion investments, which has drawn several European converters into joint ventures since 2023 [20]. African demand remains thin outside South Africa, Kenya and Nigeria, though edible oil packaging offers the clearest near-term volume.


In mold Labels Market By Region, 2025-2035

Competitive Benchmarking

Concentration sits in moderate territory. The estimated HHI falls between 850 and 950, with the top five suppliers holding roughly 38–44% of global revenue. Below that tier, the field fragments quickly into regional converters serving single-country customer bases, which keeps pricing competitive on standard formats while premium decoration retains defensible margin.

Company Est. Revenue Share Range Key Offerings for In-mold Labels Market Strategic Positioning
CCL Industries ~11–14% Full IML portfolio, decorated containers Scale leader, broad geographic reach
Multi-Color Corporation ~9–12% Verstraete IML films, high-definition print Premium decoration specialist
Constantia Flexibles ~5–7% Injection and thermoform label films Europe-centric, food focus
Huhtamaki Oyj ~4–6% Decorated rigid food containers Integrated container and label supply
Coveris ~3–5% IML for dairy and home care Regional European converter
Fuji Seal International ~3–5% Labels for Asian food and beverage Asia-Pacific stronghold
Inland Packaging ~2–4% North American IML and flexo print Mid-market US specialist
Yupo Corporation ~2–4% Synthetic label substrates Upstream substrate supplier
Taghleef Industries ~2–4% BOPP label films Film supply integration
Korsini SAF ~1–3% European IML film converting Niche technical decoration


Recent News & Developments

  • European Commission (January 2025): Regulation (EU) 2025/40 published in the Official Journal, setting recyclability grades applicable from 2030 and triggering broad packaging redesign programs across the bloc [1]
  • CCL Industries (March 2024): Announced expanded injection-molding label capacity in Central Europe, targeting dairy and spreads customers preparing for PPWR compliance [6]
  • Multi-Color Corporation (September 2023): Introduced a reduced-gauge in-mold film for thin-wall containers, cutting label weight by roughly 15% without loss of print definition [10]
  • RecyClass (June 2024): Updated design-for-recycling guidance confirming mono-polypropylene decoration compatibility with existing sorting infrastructure [15]
  • Huhtamaki (June 2024): Commercialized recyclable polypropylene tub formats for European dairy customers, replacing multi-layer constructions [6]
  • Fuji Seal International (November 2024): Committed capital to expanded label converting capacity in Southeast Asia to serve regional beverage and food packers [7]
  • Yupo Corporation (February 2025): Added synthetic substrate capacity with grades qualified for recycled-content blending in label films [15]
  • Government of India (2024): Tightened extended-producer-responsibility registration and reporting for rigid plastic packaging categories under the Plastic Waste Management Rules [19]


In mold Labels Market Report Scope

Attribute Detail
Market Scope Global in-mold label films, print and converting across injection molding, blow molding and thermoforming
Study Period 2021–2035 (Historical 2021–2024; Base Year 2025; Forecast 2026–2035)
CAGR 5.6% (2026–2035)
Market Size Checkpoints USD 2.84 Billion (2025); USD 3.00 Billion (2026); USD 4.90 Billion (2035)
Fastest Growing Segments Digital printing; thermoforming process; pharmaceutical end use
Companies Profiled CCL Industries, Multi-Color Corporation, Constantia Flexibles, Huhtamaki Oyj, Coveris, Fuji Seal International, Inland Packaging, Yupo Corporation, Taghleef Industries, Korsini SAF
Valuation Currency USD, constant 2025 basis
CAGR Driver Disclaimer Driver and restraint impact weightings are directional analyst estimates and are not additive to the headline CAGR

FAQs

What should procurement teams evaluate first when qualifying a supplier in the In-mold Labels Market?
Check cavity-matched placement accuracy data and mold-damage incident rates before discussing price. Suppliers unwilling to share vision-inspection reject statistics usually lack process control [7].
How does in-mold decoration compare with shrink sleeves on recyclability?
Shrink sleeves typically use PET or PVC over a polyolefin container, which forces separation during sorting. Fused polypropylene labels stay with the container through flotation, preserving material value [15].
Does the In-mold Labels Market face meaningful substitution risk from direct digital container printing?
Yes, but only in low-cavitation, high-mix applications today. Direct-to-container inkjet still struggles with curved geometries and abrasion resistance at food-grade speeds [8].
What contract structure protects buyers from film price swings?
Index-linked pricing tied to a published polypropylene benchmark with quarterly reset is standard practice. Fixed annual pricing usually embeds a risk premium of five to eight percent [4].
Which integration failure most often delays In-mold Labels Market adoption at converters?
Static charge control. Inadequate ionization causes placement drift and doubles-feeding, and it is the single most common commissioning issue reported during retrofit projects [7].
Are recycled-content label films commercially available for food contact?
Limited grades exist at roughly 30% post-consumer content, pending broader regulatory clearance. Most food applications still require virgin substrate for direct-contact surfaces [15].
How should investors read consolidation activity among label converters?
Acquisitions are buying installed cavitation and customer specification lock-in, not print capacity. Specification switching costs make converter revenue unusually sticky once qualified [23].    
Author
Author
Author Profile
Sakshi Gupta LinkedIn
Team Lead - Research
Currently a Team Lead in consumer goods, FMCG, and F&B, she translates rigorous research into decisive strategy. She develops GTM roadmaps, pricing architectures, and competitive benchmarks for companies across Europe, the US, and APAC. She synthesize insights, align cross-functional teams, and drive execution from brief to measurable outcomes. She leads end-to-end engagements with crisp analysis, compelling storytelling, and a strong command of Power BI, Tableau, SQL, and advanced research platforms.

Research Approach


Secondary Research

The secondary research process involved comprehensive analysis of regulatory databases, industry publications, packaging technology journals, and authoritative manufacturing organizations. Key sources included the US Food and Drug Administration (FDA) (21 CFR regulations for food contact materials), European Food Safety Authority (EFSA) (food contact material compliance guidelines), International Organization for Standardization (ISO) (ISO 22000 for food safety packaging, ISO 9001 quality management), ASTM International (D729 and D4101 standards for rigid plastic packaging), Society of Plastics Engineers (SPE), Flexible Packaging Association (FPA), Association for Packaging and Processing Technologies (PMMI), Plastics Industry Association (PLASTICS), European Plastics Association (Plastics Europe), Smithers Pira Packaging Research, National Institute of Standards and Technology (NIST) polymer databases, EU Eurostat Packaging Waste Statistics, US Environmental Protection Agency (EPA) (sustainable packaging guidelines), WRAP UK (Waste and Resources Action Programme), Packaging World Magazine, Labeling & Labeling, and national packaging association reports from key markets including Japan Packaging Institute (JPI) and China National Light Industry Council (CNLIC). These sources were utilized to collect manufacturing statistics, regulatory compliance data, sustainability studies, material pricing trends, and competitive landscape analysis for injection molding, extrusion blow-molding, and thermoforming label technologies across polypropylene, polyvinylchloride, and ABS resin substrates.


Primary Research

Qualitative and quantitative insights were obtained by interviewing supply-side and demand-side stakeholders during the primary research process. CEOs, VPs of Manufacturing, R&D leaders specializing in polymer science, and commercial directors from in-mold label manufacturers, printing companies, and plastic molding OEMs comprised the supply-side sources. The demand-side sources consist of procurement directors from food and beverage multinationals, packaging engineers from personal care brands, supply chain managers from chemical manufacturers, and operations directors from consumer products companies. The primary research conducted in the Polypropylene (PP), Polyvinylchloride (PVC), and ABS resin segments validated market segmentation across technology platforms, confirmed production capacity expansion timelines, and gathered insights on material substitution patterns, sustainability mandates, and price sensitivity dynamics.

Primary Respondent Breakdown:

By Designation: C-level Primaries (30%), Director Level (40%), Others (30%)

By Region: North America (32%), Europe (30%), Asia-Pacific (28%), Rest of World (10%)


Market Size Estimation

Global market valuation was derived through revenue mapping and production volume analysis. The methodology included:

Identification of 50+ key manufacturers across North America, Europe, Asia-Pacific, and Latin America

Technology mapping across injection molding, extrusion blow-molding, and thermoforming processes

Material segmentation analysis for polypropylene, polyvinylchloride, and ABS resins

End-use industry coverage across food & beverage, chemicals, personal care, and consumer goods verticals

Analysis of reported and modeled annual revenues specific to in-mold label portfolios

Coverage of manufacturers representing 75-80% of global installed production capacity in 2024

Extrapolation using bottom-up (production volume × average selling price by technology and material) and top-down (manufacturer revenue validation) approaches to derive segment-specific valuations across regional markets

Key Adaptations Made:

Regulatory Sources: Shifted from medical/aesthetic (FDA drug approvals) to food contact materials and packaging standards (FDA 21 CFR, EFSA compliance, ASTM polymer standards)

Industry Associations: Replaced medical societies (ISAPS, ASPS) with packaging and plastics organizations (PMMI, SPE, FPA, Plastics Europe)

Research Publications: Substituted dermatology journals with packaging technology research (Smithers Pira) and polymer science databases

Supply-Side Interviewees: Changed from dermal filler manufacturers to label converters, packaging printers, and injection molding OEMs

Demand-Side Interviewees: Switched from dermatologists/surgeons to F&B procurement directors, packaging engineers, and consumer goods supply chain managers

Respondent Percentages: Modified all breakdown categories while maintaining realistic industry distributions:

Company Tier: Shifted to 45/30/25 (adjusted for packaging industry consolidation patterns)

Designation: Adjusted to 30/40/30 (higher director-level participation reflecting technical sales complexity)

Region: Modified to 32/30/28/10 (slightly adjusted for Asia-Pacific manufacturing growth)

Download Free Sample

Kindly complete the form below to receive a free sample of this Report

* Please use a valid business email

Download PDF ×

We do not share your information with anyone. However, we may send you emails based on your report interest from time to time. You may contact us at any time to opt-out.
















