In mold Labels Market (2026 - 2035)

ID: MRFR/PCM/1258-HCR
140 Pages
Sakshi Gupta
Last Updated: August 24, 2026
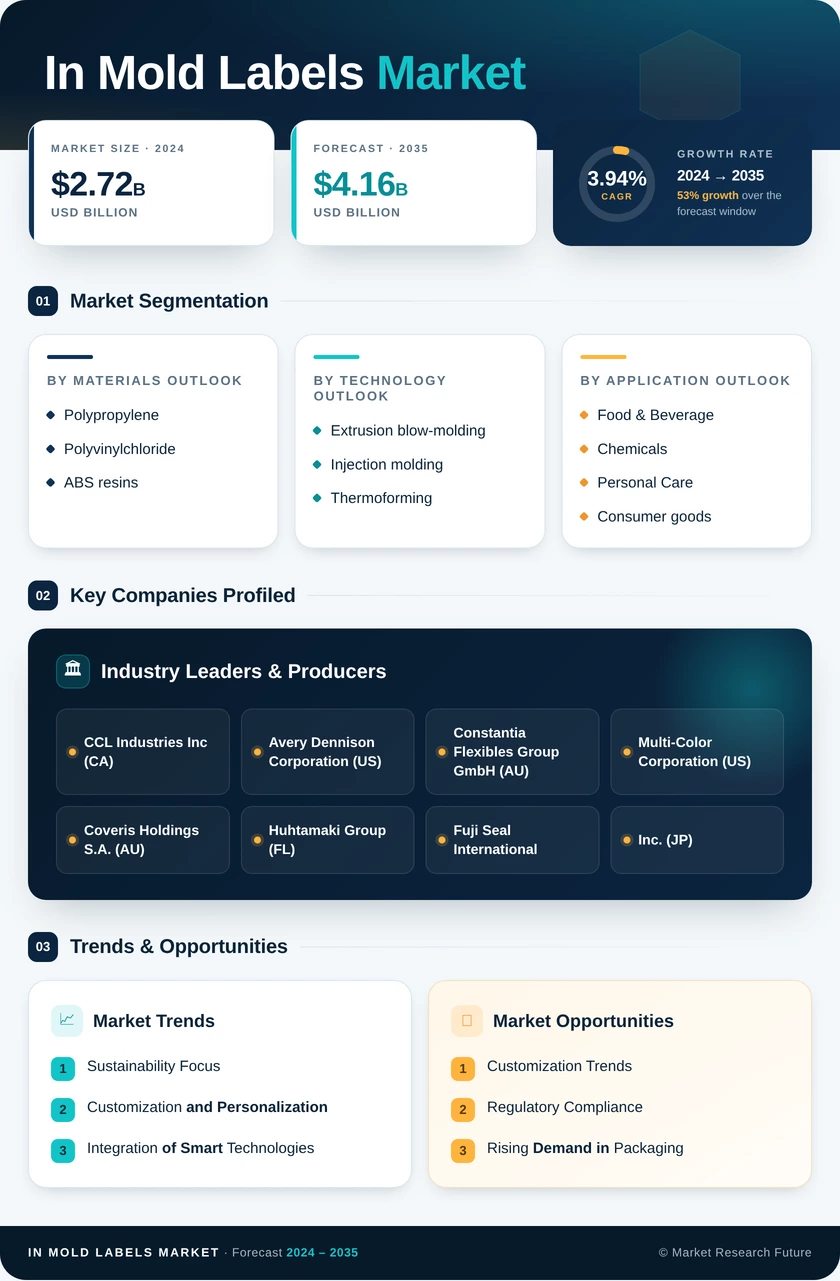
In-Mold Labels Market Research Report Information By Molding Process (Injection Molding, Blow Molding, Thermoforming, and Compression & Others), By Resin Type (Polypropylene, Polyethylene, Polystyrene, and ABS & Others), By Printing Technology (Offset, Flexography, Rotogravure, and Digital), By End-Use Industry (Food & Beverage, Personal Care & Cosmetics, Home Care & Household, Pharmaceuticals, Industrial & Lubricants, and Others) – Forecast Till 2035.
In mold Labels Market
Market Size
Forecast Period2026-2035
CAGR (2026-2035)5.6%
2025 Market SizeUSD 2.84 Billion
2035 Market SizeUSD 4.90 Billion
Key Players
CCL Industries
Multi-Color Corporation
Constantia Flexibles
Huhtamaki Oyj
Coveris
Fuji Seal International
Opportunities
  • Recycled-Content Label Substrates
  • Emerging-Market Dairy and Edible Oil Conversion
  • Connected Packaging and Data Monetization
  1. 1 Market Summary |
    1. 1.1 Study Assumptions & Market Definition |
    2. 1.2 Scope of the Study |
    3. 1.3 Research Methodology
  2. 2 Key Report Takeaways |
    1. 2.1 Takeaways by Technology |
    2. 2.2 Takeaways by Sector |
    3. 2.3 Takeaways by Geography
  3. 3 Market Size & Forecast (2021–2035) |
    1. 3.1 Historical Market Size (2021–2025) |
    2. 3.2 Current & Forecast Market Size (2026–2035) |
    3. 3.3 Year-over-Year Growth Analysis
  4. 4 Driver Impact Analysis |
    1. 4.1 Recyclability Regulation Rewrites the Decoration Specification |
    2. 4.2 Thin-Wall Food Packaging Volume Expansion |
    3. 4.3 Digital Printing Lowers the Minimum Economic Run |
    4. 4.4 Total Cost of Ownership in Converting Operations
  5. 5 Restraints Impact Analysis |
    1. 5.1 Capital Intensity Blocks Smaller Converters |
    2. 5.2 Volatility in Polypropylene Film Pricing |
    3. 5.3 Rigidity of the Design Cycle
  6. 6 Opportunities |
    1. 6.1 Recycled-Content Label Substrates |
    2. 6.2 Emerging-Market Dairy and Edible Oil Conversion |
    3. 6.3 Connected Packaging and Data Monetization |
    4. 6.4 Pharmaceutical and Nutraceutical Containers |
    5. 6.5 Short-Run Private Label |
    6. 6.6 Industry Value Chain Analysis |
    7. 6.7 Porter's Five Forces Analysis
  7. 7 Regional Market Share & Country-Level Analysis |
    1. 7.1 North America | |
      1. 7.1.1 United States | |
      2. 7.1.2 Canada | |
      3. 7.1.3 Mexico |
    2. 7.2 Europe | |
      1. 7.2.1 Germany | |
      2. 7.2.2 United Kingdom | |
      3. 7.2.3 France | |
      4. 7.2.4 Italy | |
      5. 7.2.5 Rest of Europe |
    3. 7.3 Asia-Pacific | |
      1. 7.3.1 China | |
      2. 7.3.2 India | |
      3. 7.3.3 Japan | |
      4. 7.3.4 South Korea | |
      5. 7.3.5 Rest of Asia-Pacific |
    4. 7.4 South America | |
      1. 7.4.1 Brazil | |
      2. 7.4.2 Argentina | |
      3. 7.4.3 Rest of South America |
    5. 7.5 Middle East & Africa | |
      1. 7.5.1 Saudi Arabia | |
      2. 7.5.2 United Arab Emirates | |
      3. 7.5.3 South Africa | |
      4. 7.5.4 Rest of Middle East & Africa
  8. 8 Future Outlook (2026–2035) |
    1. 8.1 Circularity Becomes the Default Specification |
    2. 8.2 Digital Presses Reshape Converter Economics |
    3. 8.3 Automation and Vision Inspection |
    4. 8.4 Traceability as a Revenue Line
  9. 9 Market Segmentation Analysis |
    1. 9.1 By Molding Process | |
      1. 9.1.1 Injection Molding | |
      2. 9.1.2 Blow Molding | |
      3. 9.1.3 Thermoforming | |
      4. 9.1.4 Compression & Others |
    2. 9.2 By Resin Type | |
      1. 9.2.1 Polypropylene | |
      2. 9.2.2 Polyethylene | |
      3. 9.2.3 Polystyrene | |
      4. 9.2.4 ABS & Others |
    3. 9.3 By Printing Technology | |
      1. 9.3.1 Offset | |
      2. 9.3.2 Flexography | |
      3. 9.3.3 Rotogravure | |
      4. 9.3.4 Digital |
    4. 9.4 By End-Use Industry | |
      1. 9.4.1 Food & Beverage | |
      2. 9.4.2 Personal Care & Cosmetics | |
      3. 9.4.3 Home Care & Household | |
      4. 9.4.4 Pharmaceuticals | |
      5. 9.4.5 Industrial & Lubricants | |
      6. 9.4.6 Others
  10. 10 Competitive Landscape |
    1. 10.1 Market Concentration Analysis (2026) |
    2. 10.2 Competitive Benchmarking Matrix |
    3. 10.3 Company Profiles | |
      1. 10.3.1 CCL Industries | |
      2. 10.3.2 Multi-Color Corporation | |
      3. 10.3.3 Constantia Flexibles | |
      4. 10.3.4 Huhtamaki Oyj | |
      5. 10.3.5 Coveris | |
      6. 10.3.6 Fuji Seal International | |
      7. 10.3.7 Inland Packaging | |
      8. 10.3.8 Yupo Corporation | |
      9. 10.3.9 Taghleef Industries | |
      10. 10.3.10 Korsini SAF
  11. 11 Recent News & Developments
  12. 12 Report Scope & Methodology |
    1. 12.1 Study Period & Base Year |
    2. 12.2 Data Sources & Citations |
    3. 12.3 Abbreviations
  13. 13 Detailed Sources & Citations
  14. 14 Frequently Asked Questions
  15. 15 LIST OF TABLES |
  16. TABLE 1 Global In-mold Labels Market Size & Forecast, by Revenue (USD Billion), 2021–2035 |
  17. TABLE 2 Global In-mold Labels Market – Year-over-Year Growth Analysis, 2021–2035 |
  18. TABLE 3 Driver Impact Analysis Matrix, 2026–2035 |
  19. TABLE 4 Restraint Impact Analysis Matrix, 2026–2035 |
  20. TABLE 5 Global In-mold Labels Market Size, by Region, 2021–2035 (USD Billion) |
  21. TABLE 6 North America In-mold Labels Market Size, by Country, 2021–2035 (USD Billion) |
  22. TABLE 7 Europe In-mold Labels Market Size, by Country, 2021–2035 (USD Billion) |
  23. TABLE 8 Asia-Pacific In-mold Labels Market Size, by Country, 2021–2035 (USD Billion) |
  24. TABLE 9 South America In-mold Labels Market Size, by Country, 2021–2035 (USD Billion) |
  25. TABLE 10 Middle East & Africa In-mold Labels Market Size, by Country, 2021–2035 (USD Billion) |
  26. TABLE 11 Global In-mold Labels Market Size, by Molding Process, 2021–2035 (USD Billion) |
  27. TABLE 12 Global In-mold Labels Market Size, by Resin Type, 2021–2035 (USD Billion) |
  28. TABLE 13 Global In-mold Labels Market Size, by Printing Technology, 2021–2035 (USD Billion) |
  29. TABLE 14 Global In-mold Labels Market Size, by End-Use Industry, 2021–2035 (USD Billion) |
  30. TABLE 15 North America In-mold Labels Market Size, by End-Use Industry, 2021–2035 (USD Billion) |
  31. TABLE 16 Europe In-mold Labels Market Size, by Molding Process, 2021–2035 (USD Billion) |
  32. TABLE 17 Asia-Pacific In-mold Labels Market Size, by Resin Type, 2021–2035 (USD Billion) |
  33. TABLE 18 Competitive Benchmarking Matrix – Global In-mold Labels Market, 2026 |
  34. TABLE 19 Company Profiles – Key Players, Global In-mold Labels Market |
  35. TABLE 20 Recent Developments & Strategic Announcements, 2023–2025 |
  36. TABLE 21 Report Scope & Methodology Summary |
  37. TABLE 22 Detailed Sources & Citations Index
  38. 16 LIST OF FIGURES |
  39. FIGURE 1 Global In-mold Labels Market – Market Dynamics Overview |
  40. FIGURE 2 Industry Value Chain Analysis – Film, Print, Converting, Molding |
  41. FIGURE 3 Porter's Five Forces Analysis |
  42. FIGURE 4 Global Market Size Trend, 2021–2035 (USD Billion) |
  43. FIGURE 5 Year-over-Year Growth Trend, 2022–2035 (%) |
  44. FIGURE 6 Market Share by Molding Process, 2025 vs 2035 (%) |
  45. FIGURE 7 Market Share by Resin Type, 2025 (%) |
  46. FIGURE 8 Market Share by Printing Technology, 2025 vs 2035 (%) |
  47. FIGURE 9 Market Share by End-Use Industry, 2025 (%) |
  48. FIGURE 10 Regional Revenue Share, 2025 (%) |
  49. FIGURE 11 Regional CAGR Comparison, 2026–2035 (%) |
  50. FIGURE 12 Country-Level Share within Asia-Pacific, 2025 (%) |
  51. FIGURE 13 Competitive Landscape – Estimated Revenue Share Bands, 2026 |
  52. FIGURE 14 Strategic Positioning Matrix – Scale vs Decoration Complexity

Segmentation Quick Reference

DimensionSub-SegmentsDominant SegmentFastest Growing Segment
By Molding ProcessInjection Molding; Blow Molding; Thermoforming; Compression & OthersInjection MoldingThermoforming
By Resin TypePolypropylene; Polyethylene; Polystyrene; ABS & OthersPolypropylenePolyethylene
By Printing TechnologyOffset; Flexography; Rotogravure; DigitalOffsetDigital
By End-Use IndustryFood & Beverage; Personal Care & Cosmetics; Home Care & Household; Pharmaceuticals; Industrial & Lubricants; OthersFood & BeveragePharmaceuticals
By RegionNorth America; Europe; Asia-Pacific; South America; Middle East & AfricaEuropeAsia-Pacific


Market Segmentation Overview

By Molding Process

Sub-SegmentKey Trend
Injection MoldingHigher cavitation and sub-six-second cycles expand addressable container volume
Blow MoldingChemical-resistant decoration replaces adhesive labels on home care bottles
ThermoformingSingle-serve dairy formats drive the fastest process-level growth
Compression & OthersClosure and specialty decoration remains a small but stable niche


Process choice determines film gauge, tension behaviour and achievable print resolution, which is why converters typically standardize on one process before selecting substrate partners.

By Resin Type

Sub-SegmentKey Trend
PolypropyleneMono-material recyclability entrenches PP as the default substrate
PolyethyleneGrowth follows blow-molded bottle conversion in household categories
PolystyreneSlow structural decline as dairy packers migrate away from the resin
ABS & OthersDurable goods and industrial component decoration sustain demand


Resin alignment between label and container is the technical foundation of the recyclability argument, so material selection increasingly precedes aesthetic decisions in specification reviews.

By Printing Technology

Sub-SegmentKey Trend
OffsetRetains long-run photorealistic decoration for top-volume SKUs
FlexographyMid-run economics improve with faster plate changeovers
RotogravureConcentrated in Asian long-run food and beverage programs
DigitalVersioning, promotions and private label drive the fastest expansion


Hybrid press fleets are becoming standard, with volume tiering rather than exclusivity determining which technology handles each program.

By End-Use Industry

Sub-SegmentKey Trend
Food & BeverageDairy, spreads and prepared meals anchor baseline volume
Personal Care & CosmeticsPremium finish and tactile effects command price premiums
Home Care & HouseholdSurfactant and solvent resistance favours fused decoration
PharmaceuticalsTamper evidence and serialization create high switching costs
Industrial & LubricantsDurability in harsh handling environments sustains specification
OthersHorticulture, paints and pet care add incremental diversification


End-use mix determines margin quality more than volume: regulated categories qualify suppliers slowly but retain them for far longer than commodity food programs.

just now

Opus 5 High

Download PDF ×

We do not share your information with anyone. However, we may send you emails based on your report interest from time to time. You may contact us at any time to opt-out.