Industrial Alcohol Market (2026 - 2035)

Industrial Alcohol Market Research Report Information By Source (Sugar & Molasses, Corn, Grains, Fossil Fuels), By Type (Ethyl Alcohol, Methyl Alcohol, Isopropyl Alcohol), By Application (Fuel, Pharmaceuticals, Personal Care Products, Chemical Intermediate & Solvent) And By Region (North America, Europe, Asia-Pacific, And Rest Of The World) –Market Forecast Till 2035
ID: MRFR/CnM/4331-HCR
100 Pages
Chitranshi Jaiswal
Last Updated: June 22, 2026
Industrial Alcohol Market

Market Size

Forecast Period2026-2035
CAGR (2026-2035)5.71%
2025 Market SizeUSD 137.28 Billion
2035 Market SizeUSD 228.61 Billion

Key Players

Archer Daniels Midland
POET LLC
Cargill, Inc.
Green Plains Inc.
Raízen S.A.
Tereos
Opportunities
  • Sustainable Aviation Fuel Alcohol-to-Jet Pathway
  • Bio-Based Personal Care Ingredient Expansion
  • Emerging-Market Fuel Ethanol Programs

Industrial Alcohol Market Summary

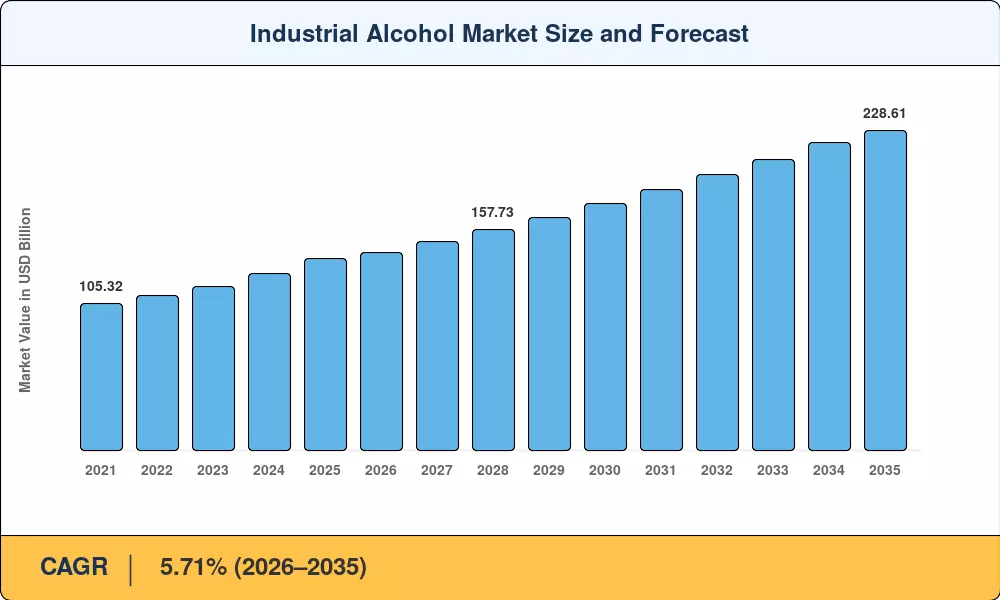
The Industrial Alcohol Market stood at USD 137.28 billion in 2025 and is projected to reach USD 141.15 billion in 2026 before climbing to USD 228.61 billion by 2035, registering a CAGR of 5.71% across the forecast period (2026–2035). Two structural forces are converging to power this trajectory: tightening low-carbon fuel standards across the Americas and the European Union's revised Renewable Energy Directive (RED III), which mandates a 42.5% renewable share in transport energy by 2030 [2]. The US 45Z Clean Fuel Production Tax Credit, worth up to USD 1.00 per gallon for qualifying ethanol production facilities, is accelerating capacity investments among producers capable of driving life-cycle emissions below 50 g CO₂e/MJ [3].

A pronounced shift in feedstock processing technology is reshaping the Industrial Alcohol Market. Legacy dry-mill ethanol production plants are being retrofitted with carbon-capture units and corn-kernel fiber cellulosic bolt-on systems, unlocking higher-value co-products and additional D3 RIN credits worth approximately USD 2.50–3.00 per gallon [4]. Brazil's RenovaBio program has channeled over USD 4.8 billion into sugarcane-based bioethanol chemicals expansion since 2020, positioning the country as the world's lowest-cost fermentation alcohol products hub [5]. Pharmaceutical alcohol purity standards are simultaneously tightening under ICH Q3D guidelines, creating a premium-pricing corridor for chemical grade alcohol suppliers.

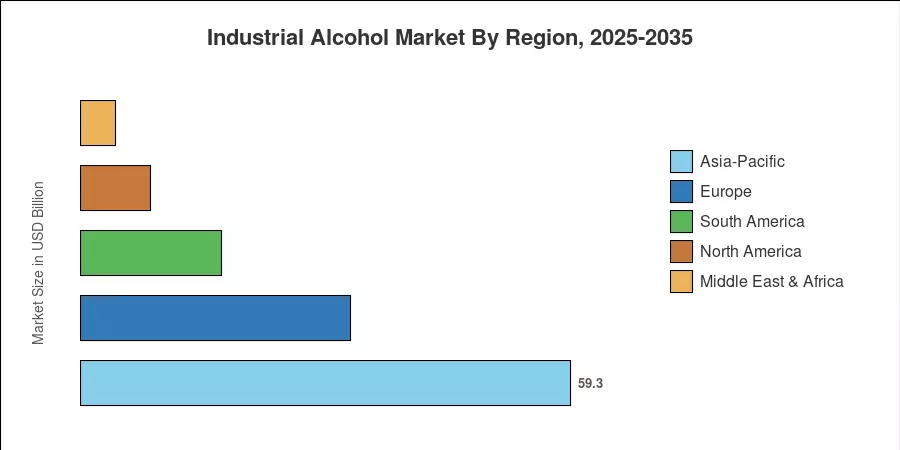
Asia-Pacific commands the largest share of the Industrial Alcohol Market at approximately 43.2% of 2025 revenue, driven by India's molasses-based industrial ethanol market and China's corn-to-ethanol buildout North America is the fastest-growing region, posting a projected CAGR of 6.14%, propelled by fuel ethanol blending mandates and expanding denatured alcohol demand in hand-hygiene applications Europe holds the second-largest position at roughly 23.8% share, anchored by German chemical grade alcohol production and France's advanced bioethanol chemicals capacity. The decade ahead will be defined by feedstock diversification, carbon-intensity scoring, and the convergence of industrial solvents with green-chemistry platforms.


Key Report Takeaways

• By Type

  • Ethyl alcohol accounted for a 5.89% CAGR through 2035, reflecting surging demand for fuel ethanol blending and pharmaceutical alcohol across regulated economies
  • Isopropyl alcohol is projected to reach USD 28.4 billion by 2035, underpinned by its role as a high-purity industrial solvent in semiconductor fabrication

• By Source

  • Sugar and molasses feedstocks captured 39.6% of the Industrial Alcohol Market in 2025, led by Brazil and India's established fermentation alcohol products infrastructure
  • Grains are forecast to register a 6.53% CAGR through 2035, driven by US corn-based ethanol production expansion

• By Application

  • The fuel and energy segment dominated with USD 56.7 billion in 2025, supported by national blending mandates and carbon-capture credit economics
  • Cosmetics and personal care applications are poised for a 7.24% CAGR, the fastest among application segments, as bio-based preservatives displace synthetic alternatives

• By Geography

  • Asia-Pacific contributed 43.2% of the 2025 Industrial Alcohol Market, with China and India accounting for the bulk of fermentation alcohol products output
  • North America is on track for the quickest regional growth at a 6.14% CAGR, boosted by the 45Z tax credit and expanding denatured alcohol applications


Industrial Alcohol Market Size and Forecast (2021–2035)

MRFR's market sizing integrates a bottom-up production-capacity model with top-down trade-flow analysis. Historical figures (2021–2024) draw on national alcohol excise records, customs data, and audited producer financials. Forecast-period estimates (2026–2035) incorporate regulatory-pipeline modeling, feedstock-cost projections, and demand elasticity curves calibrated against ethanol production capacity announcements through Q1 2026[6].

Industrial Alcohol Market Size and Forecast
Our Impact
Enabled $4.3B Revenue Impact for Fortune 500 and Leading Multinationals
Partnering with 2000+ Global Organizations Each Year
30K+ Citations by Top-Tier Firms in the Industry

Driver Impact Analysis

Driver ~% Impact on CAGR Geographic Relevance Impact Timeline
Low-carbon fuel mandates (RFS, RED III, RenovaBio) 1.4% North America, EU, Brazil Medium-term (2–4 yr)
Pharmaceutical alcohol purity upgrades 0.9% Global Short-term (≤2 yr)
Carbon-capture credit economics (45Z) 0.8% US Short-term (≤2 yr)
Bio-based cosmetics preservative shift 0.7% EU, Asia-Pacific Medium-term (2–4 yr)
Second-generation cellulosic ethanol production scale-up 0.6% US, China Long-term (≥4 yr)
E20–E25 blending expansion in India 0.5% India Medium-term (2–4 yr)
SAF (sustainable aviation fuel) pathway integration 0.4% US, EU Long-term (≥4 yr)


Low-Carbon Fuel Mandates Reshaping Ethanol Production

The US Renewable Fuel Standard (RFS) requires blending of 15 billion gallons of conventional biofuel annually, while RED III pushes EU member states toward a 42.5% renewable transport energy share by 2030 [2]. Brazil's RenovaBio decarbonization credits (CBIOs) traded at BRL 95–110 per tonne of CO₂ avoided in 2024, directly rewarding sugarcane-based fermentation alcohol products producers who lower carbon intensity scores [5]. These mandates create a regulatory floor under demand for the Industrial Alcohol Market, insulating producers from discretionary-demand cycles.

Carbon-Capture Credit Economics Boosting Denatured Alcohol Margins

The 45Z Clean Fuel Production Tax Credit offers up to USD 1.00 per gallon for ethanol production facilities achieving life-cycle carbon intensities below 50 g CO₂e/MJ [3]. Over 40 US ethanol plants had carbon-capture pipeline agreements in place by mid-2025, representing roughly 30% of national denatured alcohol output capacity [12]. This credit structure fundamentally alters plant-level economics, making chemical grade alcohol production viable at corn prices exceeding USD 5.50 per bushel.

Pharmaceutical Alcohol Purity Standardization

Revised ICH Q3D elemental-impurity guidelines and updated USP monographs for pharmaceutical alcohol now mandate sub-10 ppb limits on heavy-metal content, forcing mid-tier distillers to invest USD 2–5 million per facility in multi-column distillation upgrades [8]. The tighter specifications are concentrating supply among large-scale producers capable of delivering GMP-certified chemical grade alcohol, widening price premiums from 12% to 18% over commodity-grade industrial solvents.

India's E20 Blending Ambition

India advanced its E20 blending target to April 2025, requiring all fuel ethanol sold at pumps nationwide to contain 20% ethanol by volume [10]. The program has catalyzed 1.8 billion liters of incremental ethanol production capacity from sugar mills and standalone distilleries, with the government extending interest subventions of up to 6% for grain-based industrial ethanol market expansions in underserved states [10].


Restraints Impact Analysis

Feedstock Price Volatility

Corn futures averaged USD 4.65 per bushel in 2024 but spiked to USD 6.20 during the June–August drought corridor, compressing ethanol production margins by 15–20 cents per gallon [13]. For fermentation alcohol products derived from molasses, Indian sugar mills face a structural dilemma: diverting molasses to industrial ethanol market applications reduces sugar output, triggering government intervention through minimum sugar-release orders. This feedstock tug-of-war injects margin uncertainty across the Industrial Alcohol Market supply chain.

Methanol Toxicity Regulation

The EU's REACH revision proposes reclassifying methanol as a Substance of Very High Concern (SVHC), which would impose authorization requirements on downstream users of industrial solvents containing methanol above 3% concentration [14]. Compliance costs for reformulating denatured alcohol blends and updating safety data sheets are estimated at EUR 120–180 million across the European chemical grade alcohol value chain through 2028.

Water Consumption Sustainability Pressure

Producing one liter of fermentation alcohol products requires 3–5 liters of process water at efficient facilities, but older plants in India consume up to 12 liters per liter of output [15]. NGO campaigns and state-level water-withdrawal permits are restricting expansion in water-stressed districts of Maharashtra and Uttar Pradesh, slowing the pace of new industrial ethanol market capacity additions.


Industrial Alcohol Market Opportunities

Sustainable Aviation Fuel Alcohol-to-Jet Pathway

The ASTM-approved alcohol-to-jet (AtJ) pathway converts ethanol production output into drop-in SAF at conversion efficiencies approaching 60% [11]. With SAF mandates in the EU (6% by 2030) and proposed US blender's credits at USD 1.25–1.75 per gallon, Industrial Alcohol Market producers with AtJ-ready capacity can capture a premium fuel-grade channel LanzaJet's Freedom Pines facility in Georgia is scaling to 10 million gallons annually, demonstrating commercial viability.

Bio-Based Personal Care Ingredient Expansion

Corporate sustainability pledges from L'Oréal, Unilever, and Estée Lauder mandate 100% bio-derived ingredients in premium skincare lines by 2030 [9]. This creates a pull-through for pharmaceutical alcohol and high-purity bioethanol chemicals in solubilizers, emulsifiers, and bio-preservatives. The Industrial Alcohol Market opportunity in personal care alone could reach USD 12 billion by 2035

Emerging-Market Fuel Ethanol Programs

Sub-Saharan African nations including Kenya, Tanzania, and Nigeria are piloting E10 blending mandates to reduce petroleum import bills averaging USD 8–15 billion annually [18]. With abundant sugarcane and cassava feedstocks, these markets represent a greenfield opportunity for fermentation alcohol products infrastructure investment and technology transfer

Carbon-Intensity Data Monetization

Real-time carbon-intensity verification platforms, such as those powered by blockchain-enabled lifecycle analysis, allow ethanol production facilities to certify and trade CI scores as digital assets [12]. The Industrial Alcohol Market stands to benefit from a new data-monetization layer where producers with sub-40 g CO₂e/MJ scores command 8–12% price premiums on spot markets.

Second-Generation Cellulosic Bolt-On Economics

Adding corn-kernel fiber processing units to existing dry-mill plants costs USD 30–50 million per facility but generates D3 cellulosic RINs valued at approximately USD 2.50–3.00 per gallon [4]. This bolt-on model enables Industrial Alcohol Market incumbents to diversify revenue without greenfield capital expenditure


Industrial Alcohol Market Future Outlook

AI-Driven Process Optimization in Ethanol Production

Machine-learning fermentation control systems are reducing batch-cycle times by 8–12% and improving yield per bushel by 2.5–3.0% at early-adopter plants [19]. By 2030, AI-driven predictive maintenance and real-time enzyme dosing will become standard across the Industrial Alcohol Market, compressing operating costs by an estimated USD 0.04–0.06 per gallon. The US Department of Energy's Bioenergy Technologies Office allocated USD 118 million in 2025 for advanced bioprocessing R&D [4].

Platform Economics and Carbon-as-a-Service

The convergence of carbon-capture infrastructure, renewable natural gas co-production, and corn-oil extraction is transforming ethanol production plants into integrated biorefinery platforms [12]. Industrial Alcohol Market leaders are monetizing multiple revenue streams — fuel ethanol, carbon credits, high-protein animal feed, and industrial solvents — from a single feedstock input. This platform model could lift plant-level EBITDA margins from 12% to 22% by 2032.

Electrification of Distillation and Green Hydrogen Integration

The IEA estimates that electrifying distillation columns with heat pumps reduces on-site emissions by 40–55% while cutting energy costs by 15–20% at current European electricity prices [20]. Pilot projects in Sweden and the Netherlands are coupling green hydrogen with fermentation alcohol products facilities to produce e-methanol — a carbon-neutral chemical grade alcohol variant for marine fuels and industrial solvents.

ESG Reporting and Scope 3 Traceability

The EU Corporate Sustainability Reporting Directive (CSRD) and the SEC's proposed climate-disclosure rules will require downstream buyers of denatured alcohol and pharmaceutical alcohol to report Scope 3 supply-chain emissions by 2027 [21]. This regulatory push is accelerating digital traceability adoption across the Industrial Alcohol Market, with blockchain-based provenance systems expected to cover 35% of traded bioethanol chemicals volumes by 2030.


Industrial Alcohol Market Segmentation

By Type

Segment Key Metric Primary Demand Driver
Ethyl Alcohol 5.89% CAGR (2026–2035) Fuel ethanol blending mandates, pharmaceutical alcohol demand
Methyl Alcohol USD 29.8 Billion (2025) Chemical feedstock for formaldehyde, industrial solvents
Isopropyl Alcohol 18.1% share (2025) Electronics cleaning, denatured alcohol formulations
Isobutyl Alcohol 4.72% CAGR (2026–2035) Coatings, plasticizers, specialty chemical grade alcohol
Others USD 5.6 Billion (2025) Butanol, propanol niche industrial solvents


Ethyl alcohol remains the backbone of the Industrial Alcohol Market, accounting for the fastest growth among type segments through 2035. Its dominance stems from a dual demand base: fuel ethanol applications in the energy sector and high-purity pharmaceutical alcohol for active ingredient synthesis and excipient formulation. The US alone consumed over 15 billion gallons of fuel ethanol in 2024, with E15 retail penetration exceeding 30% of stations nationwide [3]. Methyl alcohol retains the second-largest value position, driven by its use as a chemical feedstock for formaldehyde and acetic acid production across China's industrial belt.

Isopropyl alcohol carved out a significant niche during the pandemic-era hand-sanitizer surge and has retained elevated demand as a precision cleaning agent in semiconductor fabrication and as a core ingredient in denatured alcohol blends. Isobutyl alcohol is gaining traction in eco-friendly coatings formulations where low-VOC industrial solvents are preferred.

By Source

Segment Key Metric Primary Demand Driver
Corn 31.2% share (2025) US dry-mill ethanol production dominance
Sugar and Molasses USD 54.3 Billion (2025) Brazilian sugarcane, Indian molasses fermentation alcohol products
Grains 6.53% CAGR (2026–2035) Wheat and sorghum diversification, Canadian ethanol production
Others 4.21% CAGR (2026–2035) Cellulosic, cassava, and waste-derived bioethanol chemicals


Sugar and molasses feedstocks command the largest value share in the Industrial Alcohol Market, reflecting Brazil's enormous sugarcane processing infrastructure and India's 330+ molasses-based distilleries [5][10]. Corn dominates by volume in the US, where 94 million acres were planted in 2024, dedicating approximately 37% of the harvest to ethanol production [13]. Grains are the fastest-growing source segment as Canadian and European producers diversify into wheat-based and sorghum-based chemical grade alcohol for non-fuel applications.

By Application

Segment Key Metric Primary Demand Driver
Fuel and Energy 41.8% share (2025) National blending mandates, fuel ethanol economics
Pharmaceuticals USD 22.4 Billion (2025) GMP-grade pharmaceutical alcohol, solvent extraction
Cosmetics and Personal Care 7.24% CAGR (2026–2035) Bio-based preservatives, bioethanol chemicals in formulations
Food and Beverages 13.6% share (2025) Food-grade industrial solvents, flavor extraction
Others 4.38% CAGR (2026–2035) Paints, coatings, chemical intermediates


Fuel and energy is the largest application segment in the Industrial Alcohol Market, underpinned by mandatory blending programs in the US (RFS), Brazil (RenovaBio), and India (E20) The pharmaceutical application captures high-value demand, with GMP-certified pharmaceutical alcohol commanding 15–20% premiums over commodity-grade denatured alcohol. Cosmetics and personal care is emerging as the fastest-growing application, as global beauty brands reformulate product lines to incorporate bio-derived fermentation alcohol products and eliminate petrochemical-origin industrial solvents [9].


Regional Market Share Analysis

Region Key Metric Primary Investment Themes
Asia-Pacific 43.2% share (2025) Molasses-based ethanol production, E20 blending, pharmaceutical alcohol
North America 6.14% CAGR (2026–2035) 45Z credits, carbon capture, denatured alcohol innovation
Europe USD 32.69 Billion (2025) RED III compliance, bioethanol chemicals, green chemistry
South America 12.4% share (2025) RenovaBio, sugarcane fermentation alcohol products
Middle East & Africa 3.1% share (2025) Emerging blending mandates, petrochemical diversification
**Total** **USD 137.28 Billion (2025)**

The Industrial Alcohol Market exhibits distinct regional production-consumption dynamics shaped by feedstock availability, blending mandates, and industrial solvents demand intensity. Asia-Pacific leads in volume, while North America's carbon-credit architecture positions it for the fastest value growth.


North America

Country Key Metric Key Driver
US 78.3% of regional revenue 45Z tax credit, corn-based ethanol production
Canada 5.48% CAGR Clean Fuel Regulations, wheat-based industrial solvents
Mexico USD 1.92 Billion (2025) PEMEX biofuel diversification, sugarcane feedstock


The US Industrial Alcohol Market is anchored by 210+ operating ethanol plants with combined capacity exceeding 17.5 billion gallons annually [3]. The 45Z Clean Fuel Production Tax Credit is catalyzing a wave of carbon-capture pipeline connections, with Navigator CO₂ Ventures and Summit Carbon Solutions targeting 30+ plant tie-ins by 2027. Canada's Clean Fuel Regulations impose a declining carbon-intensity benchmark on liquid fuels, stimulating domestic chemical grade alcohol production from prairie grains. Mexico's nascent biofuels policy framework remains dependent on PEMEX's strategic direction, but private-sector sugarcane-based denatured alcohol projects in Veracruz are advancing.

Europe

Country Key Metric Key Driver
Germany 22.1% of regional revenue Chemical-grade industrial solvents for pharma
UK 5.32% CAGR RTFO expansion, bioethanol chemicals blending
France USD 5.18 Billion (2025) Beet-based ethanol production, CropEnergies capacity
Italy 8.9% of regional revenue Oleochemical-grade pharmaceutical alcohol
Spain 4.87% CAGR Wine-industry co-product distillation
Nordic Countries USD 2.14 Billion (2025) Cellulosic ethanol R&D, Neste partnerships
Russia 6.2% of regional revenue Grain-based denatured alcohol, industrial solvents
Rest of Europe 4.51% CAGR Regional blending mandate harmonization


Europe's Industrial Alcohol Market is shaped by RED III transposition timelines and the EU Emissions Trading System's extension to transport fuels under ETS2, scheduled for 2027 [2]. Germany's BASF and Evonik anchor demand for high-purity chemical grade alcohol in active pharmaceutical ingredient synthesis. France's CropEnergies and Tereos operate among the continent's largest beet-based fermentation alcohol products facilities, collectively producing over 1.5 billion liters annually.

Asia-Pacific

Country Key Metric Key Driver
China 32.8% of regional revenue Corn-to-ethanol buildout, industrial solvents for electronics
India 6.72% CAGR E20 blending, molasses-based industrial ethanol market
Japan USD 6.41 Billion (2025) Pharmaceutical alcohol, bioethanol chemicals for cosmetics
South Korea 4.93% CAGR Green-chemistry mandates, denatured alcohol imports
ASEAN 11.4% of regional revenue Palm-based fermentation alcohol products, Thai E20
Rest of Asia-Pacific 4.65% CAGR Emerging fuel ethanol programs


Asia-Pacific dominates the Industrial Alcohol Market through sheer production scale. China's COFCO and Jilin Fuel Ethanol operate facilities exceeding 3.5 billion liters of combined capacity, although Beijing's on-again-off-again E10 mandate has created policy uncertainty [17]. India has emerged as the world's fastest-growing ethanol production hub, with 1,400+ operational and under-construction distilleries targeting 1,500 crore liters of annual output to satisfy the E20 program [10].

South America

Country Key Metric Key Driver
Brazil 81.5% of regional revenue RenovaBio, sugarcane bioethanol chemicals
Argentina 5.38% CAGR Corn-based fuel ethanol, export orientation
Rest of South America USD 0.87 Billion (2025) Nascent blending mandates


Brazil's Industrial Alcohol Market is the most feedstock-efficient globally, with sugarcane-to-ethanol production costs averaging USD 0.90–1.10 per gallon compared to USD 1.30–1.55 for US corn-based output [5]. The RenovaBio CBIO credit system has incentivized over 120 mill expansions since 2020, consolidating Brazil's position as a net exporter of fermentation alcohol products and denatured alcohol.

Middle East & Africa

Country Key Metric Key Driver
Saudi Arabia 28.3% of regional revenue Petrochemical-to-biochemical diversification
UAE 5.61% CAGR Industrial solvents for construction chemicals
South Africa USD 0.62 Billion (2025) Sugarcane-based fuel ethanol pilot
Egypt 4.12% CAGR Pharmaceutical alcohol imports, local bottling
Rest of MEA 31.7% of regional revenue Emerging cassava ethanol production programs


The Middle East & Africa Industrial Alcohol Market remains nascent but is gaining momentum as petrochemical-exporting nations pursue diversification under Vision 2030 and similar programs. South Africa's draft biofuels regulatory framework proposes an E2–E10 mandatory blend, which could unlock 400 million liters of annual demand for fuel ethanol from sugarcane and sorghum feedstocks [18].


Industrial Alcohol Market By Region, 2025-2035

Competitive Benchmarking

The Industrial Alcohol Market exhibits moderate concentration, with the top five producers controlling an estimated 40–48% of global capacity. The Herfindahl-Hirschman Index for the US ethanol production segment sits near 850–1,000, indicating a moderately competitive structure where scale advantages in feedstock procurement and carbon-capture access differentiate leaders from mid-tier operators.

Company Est. Revenue Share Range Key Offerings for Industrial Alcohol Market Strategic Positioning
Archer Daniels Midland (ADM) ~8–11% Fuel ethanol, industrial solvents, corn processing Vertically integrated grain-to-ethanol production
POET LLC ~6–9% Bioethanol chemicals, cellulosic bolt-ons Largest US dry-mill ethanol producer
Cargill, Inc. ~5–8% Chemical grade alcohol, denatured alcohol Global grain trading and fermentation alcohol products
Green Plains Inc. ~4–6% Fuel ethanol, high-protein feed, carbon capture Platform-model biorefinery transformation
Raízen S.A. ~5–8% Sugarcane ethanol, bioethanol chemicals Brazil's largest integrated sugar-energy company
Tereos ~3–5% Beet-based pharmaceutical alcohol, industrial solvents European fermentation alcohol products leader
Flint Hills Resources ~3–5% Fuel ethanol, denatured alcohol blending Koch Industries subsidiary, US refining integration
CropEnergies AG ~2–4% Bioethanol chemicals, chemical grade alcohol Leading European producer, Südzucker Group
Jilin Fuel Ethanol Co. ~2–4% Corn-based industrial ethanol market China's state-backed ethanol production champion
MGP Ingredients ~2–3% Pharmaceutical alcohol, specialty chemical grade alcohol Premium distilled spirits and GMP-grade alcohol


Recent News & Developments

  • POET LLC (September 2025): Completed the first commercial-scale corn-kernel fiber cellulosic ethanol production line at its Emmetsburg, Iowa facility, adding 25 million gallons of D3-RIN-eligible bioethanol chemicals capacity [4].
  • Green Plains Inc. (July 2025): Signed a CO₂ offtake agreement with Summit Carbon Solutions for five ethanol plants, securing access to the Midwest Carbon Express pipeline and unlocking 45Z tax credits for denatured alcohol production [12].
  • Raízen S.A. (May 2025): Inaugurated its second cellulosic ethanol production plant in Piracicaba, Brazil, with 30 million liters of annual capacity from sugarcane bagasse, reinforcing its position in the Industrial Alcohol Market [5].
  • Indian Oil Corporation (March 2025): Commissioned a 100 KLPD grain-based fuel ethanol distillery in Panipat, Haryana, contributing to India's E20 blending target and expanding the industrial ethanol market [10].
  • CropEnergies AG (January 2025): Received EU Innovation Fund co-financing of EUR 40 million for a green hydrogen–coupled bioethanol chemicals facility in Zeitz, Germany [2].
  • US EPA (November 2024): Finalized the 2025 Renewable Volume Obligations under the RFS, maintaining conventional biofuel mandates at 15 billion gallons and expanding the cellulosic carve-out to 720 million gallons [3].
  • ADM (August 2024): Announced a USD 350 million investment in carbon-capture and sequestration infrastructure at its Decatur, Illinois ethanol production complex, targeting sub-30 g CO₂e/MJ carbon-intensity scores [12].


Industrial Alcohol Market Report Scope

Parameter Details
Market Scope Global Industrial Alcohol Market — production, trade, and consumption of ethyl, methyl, isopropyl, and isobutyl alcohol for industrial end-uses
Study Period 2021–2035
CAGR 5.71% (2026–2035)
Market Size (2025) USD 137.28 Billion
Market Size (2035) USD 228.61 Billion
Fastest Growing Segment Cosmetics and Personal Care (by Application); Grains (by Source)
Companies Profiled ADM, POET, Cargill, Green Plains, Raízen, Tereos, Flint Hills Resources, CropEnergies, Jilin Fuel Ethanol, MGP Ingredients
Valuation Currency USD Billion


FAQs

How does the 45Z tax credit specifically alter ethanol plant investment return timelines?

The 45Z credit shortens payback periods on carbon-capture retrofits from 7–8 years to 3–4 years by adding up to USD 1.00 per gallon in production subsidies. Plants with CI scores below 40 g CO₂e/MJ see the greatest acceleration [3].

What quality certifications should buyers require when sourcing pharmaceutical-grade ethanol?

Buyers should verify USP/NF monograph compliance, GMP site certification, and ICH Q3D elemental-impurity test results below 10 ppb for heavy metals. Certificate-of-analysis lot traceability is essential [8].

How does the Industrial Alcohol Market respond during periods of crude oil price collapse?

When crude drops below USD 50 per barrel, fuel ethanol's cost-competitiveness erodes, shifting producer focus toward higher-margin pharmaceutical alcohol and chemical grade alcohol channels [6].

What differentiates corn-based ethanol production economics from sugarcane-based pathways?

Sugarcane yields roughly 1,700 gallons per acre versus 480 for corn, giving Brazilian producers a 30–40% cost advantage per liter. Corn systems offset this through co-product revenues from DDGS and corn oil [13].

How are carbon-intensity scoring frameworks reshaping procurement in the Industrial Alcohol Market?

California's LCFS and Oregon's CFP assign tradeable credits based on verified CI scores, allowing buyers to select suppliers whose fermentation alcohol products deliver measurable decarbonization across Scope 3 inventories [12].

What is the outlook for methanol-to-olefins displacing ethanol in chemical feedstock roles?

Methanol-to-olefins technology competes primarily in propylene production, not in ethanol's core solvents or fuel applications. Cross-substitution remains limited to below 5% of total chemical grade alcohol demand.

How should procurement teams evaluate denatured alcohol supplier resilience against feedstock disruptions?

Assess supplier feedstock diversification across corn, sugarcane, and grain sources, verify multi-site production capability, and confirm forward-contract coverage spanning at least two crop cycles. -- --
Author
Author
Author Profile
Chitranshi Jaiswal LinkedIn
Team Lead - Research
Chitranshi is a Team Leader in the Chemicals & Materials (CnM) and Energy & Power (EnP) domains, with 6+ years of experience in market research. She leads and mentors teams to deliver cross-domain projects that equip clients with actionable insights and growth strategies. She is skilled in market estimation, forecasting, competitive benchmarking, and both primary & secondary research, enabling her to turn complex data into decision-ready insights. An engineer and MBA professional, she combines technical expertise with strategic acumen to solve dynamic market challenges. Chitranshi has successfully managed projects that support market entry, investment planning, and competitive positioning, while building strong client relationships. Certified in Advanced Excel & Power BI she leverages data-driven approaches to ensure accuracy, clarity, and impactful outcomes.

Research Approach


Secondary Research

The secondary research process involved comprehensive analysis of regulatory databases, industry publications, agricultural and energy statistics, and authoritative government organizations. Key sources included the US Environmental Protection Agency (EPA), US Department of Energy (DOE), US Department of Agriculture (USDA), US Food and Drug Administration (FDA), European Chemicals Agency (ECHA), European Commission Directorate-General for Energy (DG ENER), International Energy Agency (IEA), Renewable Fuels Association (RFA), International Renewable Energy Agency (IRENA), National Institute of Standards and Technology (NIST), Organisation for Economic Co-operation and Development (OECD), World Trade Organization (WTO) Trade Statistics, UN Comtrade Database, US Energy Information Administration (EIA), Brazilian National Petroleum Agency (ANP), Indian Ministry of Petroleum and Natural Gas, China National Bureau of Statistics, and national agricultural and energy ministry reports from key markets. These sources were used to collect ethanol production statistics, biofuel blending mandates, regulatory compliance data, feedstock availability trends, pricing benchmarks, and market landscape analysis for ethyl alcohol, methyl alcohol, isopropyl alcohol, and other industrial alcohol categories derived from corn, sugar & molasses, grains, and fossil fuel sources.


Primary Research

Qualitative and quantitative insights were obtained by interviewing supply-side and demand-side stakeholders during the primary research process. CEOs, VPs of Manufacturing, regulatory compliance leaders, and commercial directors from industrial alcohol producers, biofuel refiners, and chemical manufacturers comprised supply-side sources. Procurement heads from pharmaceutical companies, fuel blenders, personal care product manufacturers, chemical intermediates buyers, and sustainability officers from fuel and chemical end-use industries constituted demand-side sources. The primary research validated market segmentation, confirmed production capacity expansion timelines, and collected insights on the dynamics of sustainability certification dynamics, pricing volatility, feedstock sourcing strategies, and blending mandate compliance.

Primary Respondent Breakdown:

By Designation: C-level Primaries (42%), Director Level (25%), Others (33%)

By Region: North America (32%), Europe (30%), Asia-Pacific (28%), Rest of World (10%)


Market Size Estimation

Global market valuation was derived through production volume analysis and revenue mapping across the value chain. The methodology included:

The identification of over 50 key manufacturers in North America, Europe, Asia-Pacific, and Latin America

Product mapping across ethyl alcohol, methyl alcohol, isopropyl alcohol, and specialty alcohol categories

Feedstock analysis covering corn, sugar & molasses, grains, and fossil fuel derivatives

Analysis of reported and modeled annual revenues specific to industrial alcohol portfolios

Coverage of manufacturers representing 75-80% of global market share in 2024

Extrapolation using bottom-up (production volume × ASP by source and application) and top-down (manufacturer revenue validation) approaches to derive segment-specific valuations for fuel, pharmaceutical, personal care, and chemical intermediates applications

Download Free Sample

Kindly complete the form below to receive a free sample of this Report

Download PDF ×

We do not share your information with anyone. However, we may send you emails based on your report interest from time to time. You may contact us at any time to opt-out.