Segmentation Quick Reference
| Dimension | Sub-Segments | Dominant Segment | Fastest Growing Segment |
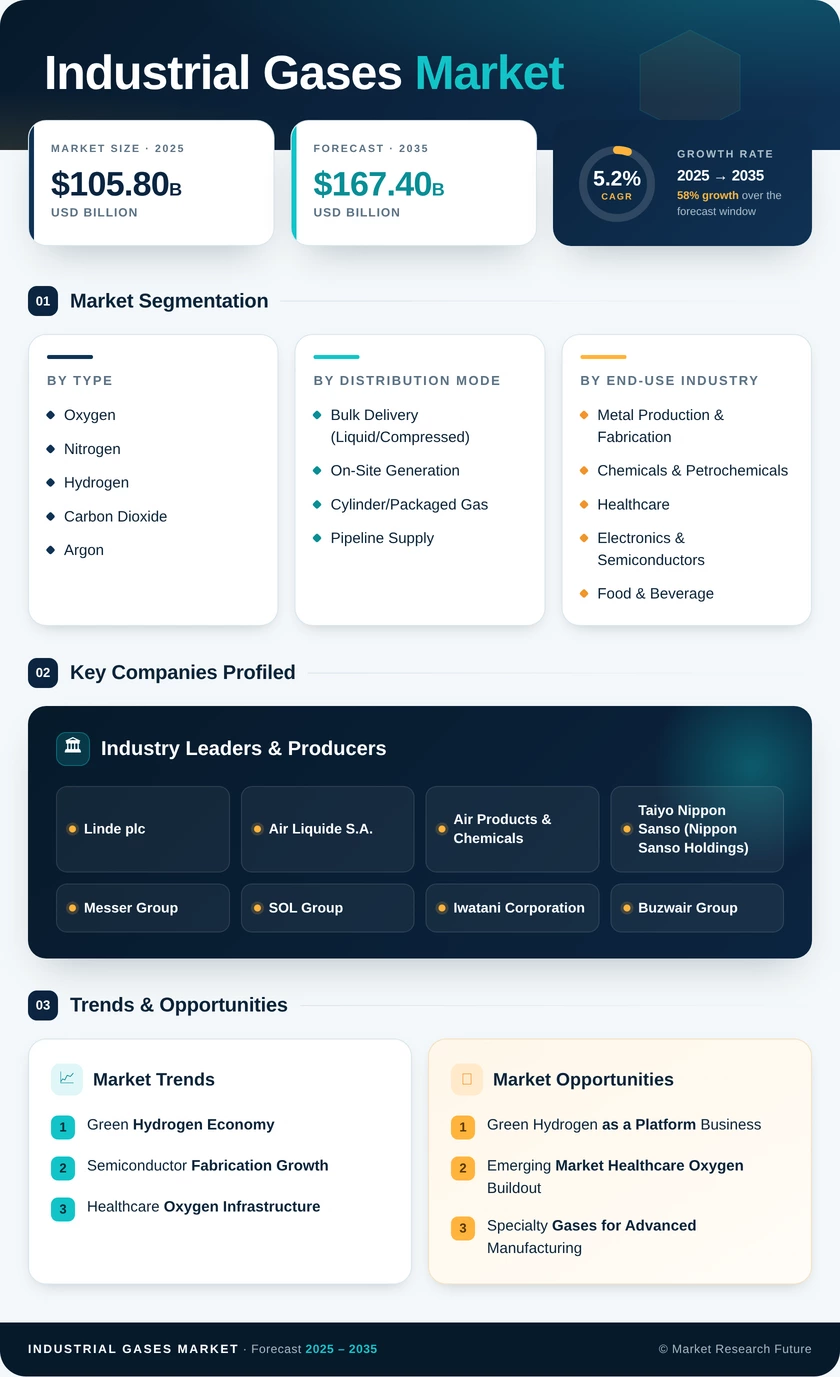
| By Gas Type | Oxygen, Nitrogen, Hydrogen, Carbon Dioxide, Argon, Acetylene, Others (Helium, Neon, Krypton, Xenon) | Oxygen (28% share) | Hydrogen (highest CAGR) |
| By Distribution Mode | Bulk Delivery, On-Site Generation, Cylinder/Packaged Gas, Pipeline Supply | Bulk Delivery (42% share) | On-Site Generation (6.1% CAGR) |
| By End-Use Industry | Metal Production & Fabrication, Chemicals & Petrochemicals, Industrial Gases Market, Electronics & Semiconductors, Food & Beverage, Energy & Utilities, Others | Metal Production & Fabrication (31% share) | Industrial Gases Market (6.8% CAGR) |
Market Segmentation Overview
By Gas Type
| Sub-Segment | Key Trend |
| Oxygen | DRI steelmaking increases per-tonne oxygen intensity; healthcare baseline demand permanently elevated post-pandemic |
| Nitrogen | Electronics fab proliferation and food-preservation cold chains drive high-purity nitrogen demand growth |
| Hydrogen | Green electrolysis cost declines and government hydrogen hub funding accelerate transition from grey to green production |
| Carbon Dioxide | CCUS mandates and food-grade MAP adoption expand both technical and food-grade CO₂ addressable markets |
| Argon | Welding shielding and semiconductor crystal-growing applications sustain steady demand; supply tied to oxygen ASU output |
| Acetylene | Remains essential for high-temperature metal cutting and brazing despite competition from propylene alternatives |
| Others (Helium, Neon, Krypton, Xenon) | Helium supply volatility and neon criticality for lithography create strategic procurement challenges for end users |
Gas type segmentation reflects the fundamental product mix of the Industrial Gases Market. Oxygen and nitrogen — both derived from air separation — account for the majority of production volume, while hydrogen and specialty gases drive the highest revenue growth and margin expansion.
By Distribution Mode
| Sub-Segment | Key Trend |
| Bulk Delivery (Liquid/Compressed) | Long-term take-or-pay contracts with energy-index escalators remain the dominant commercial model |
| On-Site Generation | PSA and membrane systems increasingly displace merchant delivery for large-volume consumers above 50 t/day |
| Cylinder/Packaged Gas | Small-scale users in welding, laboratories, and medical clinics sustain cylinder demand; digital ordering platforms modernize fulfillment |
| Pipeline Supply | Dedicated pipeline networks serve petrochemical clusters; new hydrogen pipeline corridors under development in EU and Gulf Coast |
Distribution mode segmentation captures how gases reach end users. The shift from merchant bulk delivery toward on-site generation is the most significant structural change, driven by supply security concerns and total-cost-of-ownership optimization.
By End-Use Industry
| Sub-Segment | Key Trend |
| Metal Production & Fabrication | EAF adoption raises oxygen intensity; welding gas demand tracks construction and infrastructure cycles |
| Chemicals & Petrochemicals | Hydrogen as feedstock and nitrogen for inerting remain core demand anchors in refining and chemical processing |
| Industrial Gases Market | Post-pandemic oxygen infrastructure investment creates permanent demand floor; home healthcare gases growing |
| Electronics & Semiconductors | Advanced node fabs require ultra-high-purity specialty gases; qualification barriers create supplier lock-in |
| Food & Beverage | MAP, quick-freeze, and carbonation applications drive food-grade gas demand; regulatory standards tightening |
| Energy & Utilities | CCUS projects, gasification, and oxy-fuel combustion expand gas consumption in power and energy sectors |
| Others (Aerospace, Glass, Pulp & Paper) | Space launch propellants and float glass production are niche but high-value consumption categories |
End-use industry segmentation reflects the breadth of the Industrial Gases Market's customer base. Metal production dominates volume, while healthcare and electronics deliver the highest growth rates and margins.