Industrial Gases Market

Key Players: Linde plc, Air Liquide S.A., Air Products & Chemicals, Taiyo Nippon Sanso (Nippon Sanso Holdings), Messer Group, SOL Group, Iwatani Corporation, Buzwair Group

Industrial Gases Market

Industrial Gases Market Size, Share & Growth Analysis Report By Gas Type (Oxygen, Nitrogen, Hydrogen, Carbon Dioxide, Argon, Acetylene, Others (Helium, Neon, Krypton, Xenon)), By Distribution Mode (Bulk Delivery (Liquid/Compressed), On-Site Generation, Cylinder/Packaged Gas, Pipeline Supply), By End-Use Industry (Metal Production & Fabrication, Chemicals & Petrochemicals, Healthcare, Electronics & Semiconductors, Food & Beverage, Energy & Utilities, Others (Aerospace, Glass, Pulp & Paper)), and By Country - Trends & Industry Forecast to 2035
ID: MRFR/EnP/5046-CR
100 Pages
Chitranshi Jaiswal
Last Updated: June 16, 2026
 

Industrial Gases Market Summary

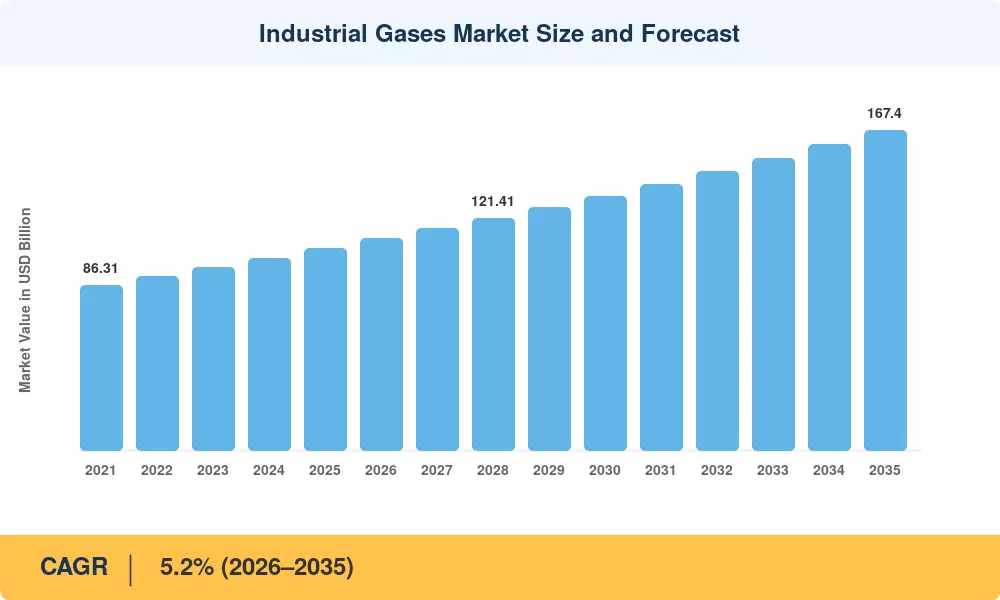
The Industrial Gases Market reached an estimated USD 105.8 billion in 2025 and is projected to grow from USD 111.3 billion in 2026 to USD 167.4 billion by 2035, registering a CAGR of 5.2% during the forecast period (2026–2035). Two forces are accelerating this trajectory: the global push toward green hydrogen production — backed by over USD 280 billion in announced electrolyzer and hydrogen hub investments worldwide [1] — and the rapid expansion of semiconductor fabrication, which demands ultra-high-purity nitrogen, argon, and specialty gas blends at unprecedented volumes. The Industrial Gases Market is no longer a commodity story; it is becoming a technology-intensive growth sector.

On-site industrial gas generator installations and pipeline supply networks are replacing legacy merchant distribution arrangements where liquid nitrogen oxygen industrial gas was trucked from centralized air separation units (ASUs) to end customers. This is reflected in Linde's announcement of a USD 2 billion investment cycle in on-site hydrogen industrial gas supply installations across the US Gulf Coast in 2024 [2]. Meanwhile, carbon capture, utilization, and storage (CCUS) operations under the U.S. 45Q tax credit are establishing completely new demand pools for the industrial food-grade and technical grade streams of carbon dioxide CO2.


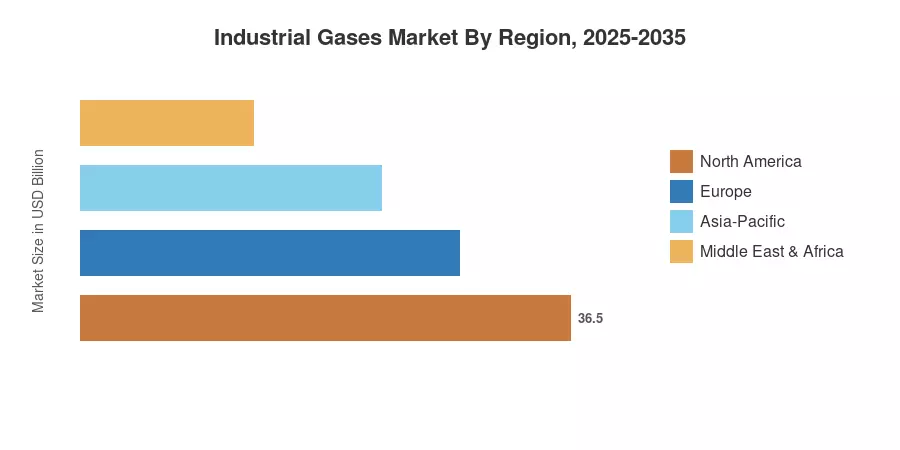
North America is the largest market for industrial gases, with a share of ~33% in worldwide revenues, driven by petrochemical refining hubs and the hydrogen economy buildout. With a CAGR of 6.4%, Asia-Pacific is the fastest-growing market, driven by China’s steel decarbonization standards and India’s burgeoning healthcare oxygen infrastructure. Europe accounts for the second greatest part of over 27%, with the EU Hydrogen Strategy allocating EUR 470 billion for clean hydrogen until 2050 [3]. Industrial Gases Market – Structural Demand Growth Expected in All Major Geographies Over the Next Decade

.

Key Report Takeaways

• By Gas Type

  • Oxygen holds the largest revenue share at approximately 28% of the Industrial Gases Market, driven by steelmaking, healthcare, and wastewater treatment demand
  • Nitrogen is growing at a CAGR of 5.5%, reflecting surging electronics fab and food-preservation applications where liquid nitrogen oxygen industrial gas is critical
  • Hydrogen industrial gas supply is projected to reach USD 32.6 billion by 2035, as green electrolysis capacity scales globally

• By Distribution Mode

  • Bulk industrial gas supply contract arrangements account for roughly 42% of total delivery revenue in the Industrial Gases Market
  • On-site industrial gas generator deployments are expanding at a CAGR of 6.1%, especially in refinery and semiconductor clusters

• By Geography

  • North America leads the Industrial Gases Market with a 33% revenue share anchored in petrochemicals and hydrogen hubs
  • Asia-Pacific registers the highest CAGR at 6.4%, with China and India as primary demand engines
  • Europe contributes approximately USD 28.6 billion in 2025, underpinned by decarbonization policy


Industrial Gases Market Size and Forecast (2021–2035)

Market Research Future (MRFR) uses a market-sizing methodology that blends bottom-up revenue estimation from company filings and trade association shipment statistics (CGA, EIGA, JIGA) with top-down macro-economic indicators. Historical data (2021-2024) are based on reported revenues and production volumes of the top 10 suppliers, and prospective values (2026-2035) are based on segment-specific growth assumptions confirmed against IEA and World Bank industrial output predictions.

Industrial Gases Market Size and Forecast
Our Impact
Enabled $4.3B Revenue Impact for Fortune 500 and Leading Multinationals
Partnering with 2000+ Global Organizations Each Year
30K+ Citations by Top-Tier Firms in the Industry
 

Driver Impact Analysis

Driver ~% Impact on CAGR Geographic Relevance Impact Timeline
Green hydrogen economy scale-up +1.4% Global Long-term (≥4 yr)
Semiconductor & electronics fab expansion +0.9% North America, Asia-Pacific Medium-term (2–4 yr)
Healthcare oxygen infrastructure buildout +0.7% Asia-Pacific, MEA Short-term (≤2 yr)
Carbon capture & CCUS deployment +0.6% North America, Europe Long-term (≥4 yr)
Food & beverage modified atmosphere packaging +0.5% Global Short-term (≤2 yr)
Metal fabrication & welding gas demand +0.4% Asia-Pacific, South America Medium-term (2–4 yr)
Specialty gas demand in pharma & biotech +0.3% North America, Europe Medium-term (2–4 yr)


Green Hydrogen Economy

The hydrogen industrial gas supply chain is undergoing its most significant transformation since the Haber-Bosch era. The U.S. Department of Energy's Hydrogen Shot initiative targets USD 1/kg clean hydrogen by 2031, while seven regional hydrogen hubs received USD 7 billion under the Bipartisan Infrastructure Law [1]. Each gigawatt of electrolyzer capacity demands roughly 9,000 tonnes of oxygen as a co-product, creating a dual revenue stream for gas producers. The Industrial Gases Market stands to capture an incremental USD 18–22 billion in hydrogen-related revenue by 2035.

Semiconductor Fabrication Growth

Advanced chip fabs consume 20–30 different specialty gases — from nitrogen trifluoride and high-purity argon to acetylene specialty industrial gas welding precursors used in chemical vapor deposition. The CHIPS and Science Act allocated USD 52.7 billion to domestic semiconductor manufacturing, and TSMC, Samsung, and Intel have collectively committed over USD 200 billion in new fab construction through 2030 [7]. Each new fab generates USD 30–50 million in annual bulk industrial gas supply contract revenue for suppliers.

Healthcare Oxygen Infrastructure

The COVID-19 pandemic exposed critical oxygen supply gaps across Sub-Saharan Africa and South Asia, where medical-grade oxygen availability stood at less than 20% of WHO-recommended levels [9]. Since 2022, the World Bank's USD 4 billion Health Emergency Preparedness initiative has funded PSA on-site industrial gas generator installations across 35 developing nations. India alone added over 1,500 pressure swing adsorption plants between 2021 and 2024, permanently expanding the Industrial Gases Market footprint in emerging economies.

Carbon Capture and CCUS Deployment

The U.S. Internal Revenue Code Section 45Q now offers USD 85/tonne for geologically stored CO₂ and USD 60/tonne for enhanced oil recovery, incentivizing large-scale carbon dioxide CO2 industrial food-grade and technical-grade capture. Over 230 CCUS projects are in various development stages globally, with combined capture capacity exceeding 280 Mtpa by 2030 [8]. Air separation units co-located with capture facilities are becoming standard design practice, tying the Industrial Gases Market directly to decarbonization capital cycles.


Restraints Impact Analysis

Restraint ~% Impact on CAGR Geographic Relevance Impact Timeline
Energy-intensive production costs (ASU power consumption) –0.5% Global Ongoing
Transportation & logistics bottlenecks for cryogenic liquids –0.4% Emerging markets Short-term (≤2 yr)
Commoditization & pricing pressure in mature segments –0.3% North America, Europe Ongoing
Regulatory complexity for specialty gas handling –0.2% Global Medium-term (2–4 yr)
Supply chain concentration risk (rare specialty gas precursors) –0.2% Global Long-term (≥4 yr)


Energy-Intensive Production Costs

Air separation units consume approximately 0.4–0.5 kWh per standard cubic meter of oxygen produced, making electricity the single largest operating cost for gas producers [13]. In Europe, where industrial electricity prices surged 65% between 2021 and 2023, several merchant plants temporarily curtailed output. This energy sensitivity creates margin volatility across the Industrial Gases Market and limits expansion in regions with unreliable grid infrastructure. While on-site renewable power integration can mitigate this drag, capital requirements for solar- or wind-powered ASUs remain prohibitive for mid-tier suppliers.

Transportation and Logistics Bottlenecks

Cryogenic liquid transport — particularly for liquid nitrogen, oxygen industrial gas and liquid argon — requires specialized ISO containers, tanker trucks, and rail cars that face chronic shortages in developing markets. India's oxygen crisis during the 2021 Delta wave demonstrated how distribution bottlenecks, not production capacity, can constrain supply during demand surges. In Africa and Southeast Asia, poor road networks and limited cryogenic infrastructure continue to suppress per-capita gas consumption by 60–70% relative to OECD levels.

Commoditization in Mature Segments

In North America and Western Europe, bulk atmospheric gases (oxygen, nitrogen, argon) face persistent pricing pressure as long-term take-or-pay contracts expire and customers renegotiate terms [15]. The top three producers — Linde, Air Liquide, and Air Products — collectively control over 55% of supply, yet competition from regional distributors keeps price growth below inflation in many product categories. This commoditization dampens revenue growth in the Industrial Gases Market's largest and most mature segments.


Industrial Gases Market Opportunities

Green Hydrogen as a Platform Business

Gas producers with existing ASU infrastructure can position themselves as integrated green hydrogen developers, co-producing high-purity oxygen for industrial sale while delivering hydrogen industrial gas supply to refineries, ammonia plants, and mobility corridors. Linde, Air Products, and Air Liquide have each committed over USD 10 billion to hydrogen projects through 2030 This pivot transforms the Industrial Gases Market from a supply-side utility into a platform business with recurring infrastructure revenues.

Emerging Market Healthcare Oxygen Buildout

Significant portions of the global population in developing nations reside in regions where medical-grade oxygen remains chronically undersupplied. Initiatives such as the WHO’s Global Oxygen Alliance and World Bank funding programs have created a clear runway for on-site industrial gas generator deployments across Sub-Saharan Africa, South Asia, and Southeast Asia. Many suppliers are shifting toward equipment lease-and-service models—rather than traditional outright sales—to capture recurring revenue streams while simultaneously supporting critical public health mandates.

Specialty Gases for Advanced Manufacturing

The proliferation of EUV lithography, 3D NAND stacking, and advanced packaging technologies demands ever-higher purity levels of acetylene specialty industrial gas welding precursors, fluorinated gases, and rare gas blends Specialty gas margins run 3–5× above commodity bulk products, and customer switching costs are high due to qualification requirements. The Industrial Gases Market's specialty segment is projected to outpace overall growth by 200–300 basis points annually through 2035.

Carbon Dioxide Monetization in Food and Beverage

Rising demand for modified atmosphere packaging (MAP), carbonated beverages, and quick-freeze processing is expanding the addressable market for carbon dioxide CO2 industrial food-grade supply. The global MAP segment alone is growing at 6.8% CAGR, and food-grade CO₂ commands a 40–60% price premium over technical-grade product [10]. Suppliers investing in purification and certification infrastructure can capture this premium across both developed and emerging food-processing markets

Digital Supply Chain and Remote Monitoring

Telemetry-enabled tank monitoring, predictive demand analytics, and automated replenishment scheduling are reducing distribution costs by 12–18% for early adopters [18]. Companies like Linde's PLANTSERV platform and Air Liquide's ALMS digital ecosystem are monetizing data from thousands of on-site installations. This digital layer creates stickier customer relationships and opens new revenue streams within the Industrial Gases Market — from subscription-based monitoring to performance-based contracts


Industrial Gases Market Future Outlook

Hydrogen Economy Maturation

By 2030, global electrolyzer capacity is projected to reach 134 GW, up from under 1 GW in 2022 [1]. This exponential scale-up will transform hydrogen from a niche Industrial Gases Market product into a mainstream energy carrier, with co-produced oxygen generating additional revenue streams. Gas producers that control electrolyzer manufacturing, distribution infrastructure, and long-term offtake agreements will capture disproportionate value from this transition.

Digitalization and Autonomous Operations

Smart ASU operations — leveraging AI-driven process optimization, digital twins, and predictive maintenance — can reduce energy consumption by 8–12% and unplanned downtime by 30% [18]. The Industrial Gases Market is following the broader industrial trend toward lights-out manufacturing, where on-site industrial gas generator units operate autonomously with remote monitoring. Air Liquide's "Turbo-Brayton" digital optimization program and Linde's PLANTSERV 4.0 platform demonstrate that data monetization is becoming a competitive differentiator.

Decarbonization and ESG Integration

Carbon border adjustment mechanisms (CBAM) in the EU and similar proposals in the U.S. and UK are creating asymmetric demand for low-carbon industrial gases [3]. Steel producers switching from blast furnaces to direct reduced iron (DRI) technology require 2–3× more hydrogen per tonne of output, structurally expanding the hydrogen industrial gas supply demand. By 2035, ESG-compliant gas sourcing — verified through lifecycle carbon intensity certificates — will likely become a contractual requirement for bulk industrial gas supply contract arrangements across heavy industry.

Consolidation and Vertical Integration

The Industrial Gases Market's top three players (Linde, Air Liquide, Air Products) already control approximately 55% of global revenue, and further consolidation is expected as mid-tier players struggle to fund hydrogen and CCUS capital programs [15]. Vertical integration — from gas production through distribution to on-site management — increases customer lock-in and recurring revenue share. Strategic M&A activity is likely to target specialty gas producers, equipment OEMs, and digital monitoring platforms through 2030.


Industrial Gases Market Segmentation

By Gas Type

Gas Type Key Metric Primary Demand Driver
Oxygen 28% share Steelmaking, healthcare, wastewater treatment
Nitrogen 5.5% CAGR Electronics, food preservation, inerting
Hydrogen USD 32.6 B (2035) Refining, green energy, ammonia synthesis
Carbon Dioxide 4.8% CAGR Food & beverage, CCUS, EOR
Argon USD 4.9 B (2025) Welding shielding, semiconductor processing
Acetylene 3.9% CAGR Metal cutting, chemical synthesis
Others (Helium, Neon, Krypton) USD 5.1 B (2025) Electronics, medical imaging, aerospace


Oxygen remains the backbone of the Industrial Gases Market, serving steelmaking (basic oxygen furnaces consume ~55 kg O₂ per tonne of crude steel), medical facilities, and municipal water treatment. The pandemic-era healthcare buildout permanently raised baseline oxygen demand in developing markets, where on-site industrial gas generator PSA units now supplement traditional liquid delivery. As DRI steelmaking scales, oxygen demand per tonne of steel actually increases relative to blast furnace routes, supporting long-term volume growth.

The hydrogen industrial gas supply is the segment with the most transformative growth trajectory. Traditional grey hydrogen (steam methane reforming) still dominates production, but green hydrogen from electrolysis is the fastest-growing sub-segment within the Industrial Gases Market. Electrolyzer costs have declined 40% since 2020 and are projected to fall below USD 300/kW by 2030 [1]. Major bulk industrial gas supply contract awards — such as Air Products' 30-year offtake for the NEOM project — anchor long-term revenue visibility for producers.

By Distribution Mode

Distribution Mode Key Metric Primary Demand Driver
Bulk Delivery (Liquid/Compressed) 42% share Refineries, chemicals, metals
On-Site Generation 6.1% CAGR Semiconductor fabs, hospitals, large industrial users
Cylinder/Packaged Gas USD 18.7 B (2025) Welding, laboratories, small-scale users
Pipeline Supply 4.6% CAGR Integrated petrochemical complexes


Bulk industrial gas supply contract models dominate the Industrial Gases Market's revenue base, anchored by 10–20 year take-or-pay agreements with refineries and chemical plants. These contracts provide revenue predictability but limit pricing flexibility. On-site industrial gas generator installations are gaining share as customers seek to reduce transportation costs and supply-chain vulnerability — particularly in electronics, where acetylene specialty industrial gas welding precursors and ultra-high-purity nitrogen must meet parts-per-trillion contamination thresholds.

By End-Use Industry

End-Use Industry Key Metric Primary Demand Driver
Metal Production & Fabrication 31% share Steel, aluminum, welding operations
Chemicals & Petrochemicals USD 22.4 B (2025) Feedstock, process gas, inerting
Healthcare 6.8% CAGR Medical oxygen, anesthesia, cryotherapy
Electronics & Semiconductors USD 9.2 B (2025) Process gases, cleanroom inerting
Food & Beverage 5.6% CAGR MAP, freezing, carbonation
Energy & Utilities USD 7.8 B (2025) Power generation, gasification, CCUS
Others (Aerospace, Glass, Pulp) 4.2% CAGR Specialty applications


Metal production and fabrication is the largest consuming sector in the Industrial Gases Market, with steel plants, aluminum smelters, and welding shops requiring oxygen, argon, and acetylene specialty industrial gas welding products across every stage of production. The shift toward electric arc furnaces (EAFs) — which now account for 30% of global steel output — is actually increasing per-unit oxygen intensity and creating demand for higher-purity gas streams. Carbon dioxide CO2 industrial food-grade applications in the food and beverage sector offer attractive margins, with MAP adoption growing rapidly in convenience-food markets across Asia-Pacific and Latin America.


Regional Market Share Analysis

Region Key Metric Primary Investment Themes
North America 33% share (2025) Hydrogen hubs, semiconductor fabs, CCUS
Europe USD 28.6 B (2025) EU Hydrogen Strategy, ETS carbon pricing
Asia-Pacific 6.4% CAGR Steel decarbonization, healthcare O₂, electronics
South America USD 5.8 B (2025) Mining, oil & gas, metal fabrication
Middle East & Africa 5.9% CAGR Refinery modernization, medical oxygen access
Total USD 105.8 B (2025)

The Industrial Gases Market exhibits distinct regional demand profiles shaped by industrialization stage, energy policy, and healthcare infrastructure investment. North America and Europe dominate revenue, while Asia-Pacific leads growth rates.


North America

Country Key Metric Key Driver
United States 78% of regional share Hydrogen hubs, CHIPS Act fabs, 45Q CCUS
Canada USD 4.3 B (2025) Oil sands processing, LNG export terminals
Mexico 5.1% CAGR Nearshoring manufacturing in the automotive sector


The United States accounts for roughly 78% of the North American Industrial Gases Market revenue, underpinned by the world's largest refining complex along the Gulf Coast and seven DOE-designated hydrogen hubs [1]. Air Products' USD 4.5 billion blue hydrogen complex in Louisiana and Linde's expansion of its bulk industrial gas supply contract network across Texas illustrate the capital intensity of this region. Canada's gas market is tightly linked to its energy sector, with growing demand for nitrogen injection in enhanced oil recovery and carbon dioxide CO2 industrial food-grade streams from CCUS projects at Boundary Dam and Quest [8].

Europe

Country Key Metric Key Driver
Germany 26% of regional share Chemical industry, Energiewende hydrogen strategy
France USD 4.1 B (2025) Nuclear hydrogen production, Air Liquide HQ effect
United Kingdom 4.8% CAGR North Sea CCUS clusters, NHS oxygen contracts
Rest of Europe USD 10.2 B (2025) Nordic green steel, Eastern European industrialization


Europe's Industrial Gases Market is shaped by the EU Emissions Trading System (ETS), which prices carbon above EUR 60/tonne and incentivizes hydrogen substitution in steelmaking and chemicals [3]. Germany's National Hydrogen Strategy commits EUR 9 billion to electrolyzer deployment and hydrogen pipeline infrastructure, creating large-scale demand for on-site industrial gas generator capacity. Air Liquide's Normandy hydrogen ecosystem and HYBRIT's fossil-free steel pilot in Sweden are flagship projects demonstrating how decarbonization policy directly expands the Industrial Gases Market.

Asia-Pacific

Country Key Metric Key Driver
China 38% of regional share Steel sector O₂ demand, electronics gases
India 7.8% CAGR Healthcare oxygen, refinery modernization
Japan USD 6.2 B (2025) Semiconductor gases, hydrogen mobility
South Korea 5.9% CAGR Memory chip fabs, shipbuilding, welding gases
Australia USD 2.1 B (2025) LNG processing, mining sector


China's steelmaking complex alone consumes over 35 million tonnes of oxygen annually, making it the single largest end-use category in the Asia-Pacific Industrial Gases Market [11]. India added over 1,500 PSA oxygen plants post-pandemic, and the government's Production-Linked Incentive scheme for electronics manufacturing is generating new demand for high-purity nitrogen and specialty gases. Japan's semiconductor sector — anchored by Rapidus and TSMC's Kumamoto fab — consumes acetylene specialty industrial gas welding compounds and rare gases at premium price points.

South America

Country Key Metric Key Driver
Brazil 52% of regional share Mining, petrochemicals, food processing
Argentina USD 0.9 B (2025) Vaca Muerta shale gas, lithium extraction
Chile 6.0% CAGR Copper mining, desalination plants


Brazil's Industrial Gases Market is anchored by Petrobras's refining operations and the Vale mining complex, both of which consume significant volumes of oxygen and nitrogen for smelting and inerting applications. White Martins (a Linde subsidiary) operates the region's largest ASU network, while Air Liquide has expanded its liquid nitrogen oxygen industrial gas distribution infrastructure across São Paulo's food-processing corridor.

Middle East & Africa

Country Key Metric Key Driver
Saudi Arabia 34% of the regional share NEOM hydrogen city, petrochemical expansion
UAE USD 1.4 B (2025) Downstream processing, aluminum smelting
South Africa 5.4% CAGR Mining sector, medical oxygen access


Saudi Arabia's NEOM green hydrogen project — a USD 8.4 billion venture by Air Products, ACWA Power, and NEOM — will produce 600 tonnes/day of hydrogen for export as green ammonia [2]. This single project represents the largest committed hydrogen industrial gas supply investment in the Middle East and will reshape the region's Industrial Gases Market. Across Sub-Saharan Africa, medical oxygen access remains below WHO benchmarks, creating a substantial addressable market for PSA on-site industrial gas generator installations funded by development finance institutions [9].


Industrial Gases Market By Region, 2025-2035
 

Competitive Benchmarking

The Industrial Gases Market is relatively highly concentrated with an estimated Herfindahl-Hirschman Index (HHI) of approx. 1,800 – indicating a tight oligopoly among the top 3 firms, accounting for approx 55-60% of global revenue. Regional champions (Taiyo Nippon Sanso, Messer, SOL Group) and hundreds of individual distributors cover the remainder of the market. High barriers to entry with capital-intensive ASU infrastructure, long-term customer contracts and strict safety/quality certifications.

Company Est. Revenue Share Range Key Offerings for Industrial Gases Market Strategic Positioning
Linde plc ~22–26% Full-spectrum atmospheric & process gases, hydrogen, engineering Global integrated leader; largest hydrogen portfolio
Air Liquide S.A. ~20–24% Atmospheric gases, hydrogen, specialty gases, healthcare Strong Europe/Asia; digital services leader
Air Products & Chemicals ~10–13% Hydrogen, atmospheric gases, LNG technology Hydrogen-first strategy; mega-project focus
Taiyo Nippon Sanso (Nippon Sanso Holdings) ~4–6% Electronics gases, atmospheric gases Asia-Pacific leader; specialty gas strength
Messer Group ~3–5% Atmospheric gases, CO₂, food-grade gases European regional champion; mid-market focus
SOL Group ~2–3% Medical gases, home healthcare, technical gases Southern Europe specialist; healthcare-first
Iwatani Corporation ~2–3% Hydrogen, helium, specialty gases Japan hydrogen mobility pioneer
Buzwair Group ~1–2% Industrial & medical gases Middle East regional leader
Ellenbarrie Industrial Gases ~1–2% Atmospheric gases, cylinder distribution India distribution network
Gulf Cryo ~1–2% Industrial & medical gases, CO₂ MENA growth player


Recent News & Developments


  • Air Products (November 2024): Maintains its hydrogen-first capital allocation strategy, specifically focused on large-scale blue hydrogen production and carbon capture and sequestration (CCS) complexes in the U.S. Gulf Coast, despite ongoing regulatory and environmental oversight regarding project scale and implementation.


  • U.S. DOE (June 2024): Finalized USD 7 billion in awards to seven Regional Clean Hydrogen Hubs under the Bipartisan Infrastructure Law, creating anchored demand for bulk industrial gas supply contract volumes [1].


  • Linde plc (September 2021): Signed a 20-year on-site gas supply agreement with TSMC's Arizona fab, installing a dedicated on-site industrial gas generator complex for nitrogen and specialty gases [7].


Industrial Gases Market Report Scope

Parameter Detail
Market Scope Global Industrial Gases Market by gas type, distribution mode, end-use industry, and region
Study Period 2021–2035
CAGR 5.2% (2026–2035)
Market Size (Base Year 2025) USD 105.8 Billion
Market Size (2035 Forecast) USD 167.4 Billion
Fastest Growing Segment Hydrogen (by gas type); On-Site Generation (by distribution mode)
Companies Profiled 10 (Linde, Air Liquide, Air Products, Taiyo Nippon Sanso, Messer, SOL Group, Iwatani, Buzwair, Ellenbarrie, Gulf Cryo)
Valuation Currency USD (Billion)


FAQs

How do long-term take-or-pay contracts affect pricing flexibility for gas buyers?

Take-or-pay agreements lock in volume commitments for 10–20 years, typically with annual price escalators tied to energy indices. Buyers gain supply security but sacrifice the ability to renegotiate during price downturns. Mid-contract renegotiation clauses — increasingly common since 2022 — can restore some flexibility [15].

What purity grades matter most when selecting an on-site nitrogen generator versus a merchant supply?

On-site PSA generators typically deliver 95–99.999% nitrogen purity. Applications requiring ultra-high purity above 99.9999% — such as semiconductor fabs — still depend on cryogenic merchant liquid nitrogen oxygen industrial gas supply due to trace-contaminant limitations of membrane and PSA technologies [6].

How does the Industrial Gases Market address helium supply volatility?

Helium supply depends on a small number of natural gas processing plants in the U.S., Qatar, and Algeria, making it highly vulnerable to outages. Producers now maintain 60–90 day strategic reserves, and recycling systems at MRI facilities and semiconductor fabs recover 85–95% of used helium [17].

What role does acetylene play compared to propylene and propane in cutting applications?

Acetylene delivers the highest flame temperature (~3,100°C) among fuel gases, making it preferred for precision cutting and brazing of thick steel. Propylene and propane cost 30–40% less but produce lower-quality cuts, so acetylene specialty industrial gas welding use remains dominant in shipbuilding and heavy fabrication [11].

How are Industrial Gases Market suppliers adapting to Scope 3 emissions reporting requirements?

Leading suppliers now publish product carbon footprints per unit of gas delivered, integrating transport, production, and electricity-source data. Linde and Air Liquide offer verified low-carbon gas certificates, enabling downstream customers to meet Scope 3 disclosure under CSRD and SEC climate rules [3].

What procurement factors should buyers evaluate when choosing between bulk industrial gas supply contract models and on-site generation?

Buyers should compare the total cost of ownership over 10+ years, including electricity rates, maintenance, and backup supply needs. On-site generation breaks even above ~50 tonnes/day consumption for oxygen and ~30 tonnes/day for nitrogen, below which bulk delivery remains more economical.

How does the Industrial Gases Market serve the growing space launch and satellite manufacturing sector?

Liquid oxygen and liquid hydrogen are primary propellants for launch vehicles, while specialty gases (xenon, krypton) fuel satellite ion thrusters. SpaceX alone consumes an estimated 1,200 tonnes of liquid oxygen per launch, and the accelerating commercial launch cadence is creating a new high-growth niche [17].


Author
Author
Author Profile
Chitranshi Jaiswal LinkedIn
Team Lead - Research
Chitranshi is a Team Leader in the Chemicals & Materials (CnM) and Energy & Power (EnP) domains, with 6+ years of experience in market research. She leads and mentors teams to deliver cross-domain projects that equip clients with actionable insights and growth strategies. She is skilled in market estimation, forecasting, competitive benchmarking, and both primary & secondary research, enabling her to turn complex data into decision-ready insights. An engineer and MBA professional, she combines technical expertise with strategic acumen to solve dynamic market challenges. Chitranshi has successfully managed projects that support market entry, investment planning, and competitive positioning, while building strong client relationships. Certified in Advanced Excel & Power BI she leverages data-driven approaches to ensure accuracy, clarity, and impactful outcomes.

Research Approach


Secondary Research

The secondary research process involved comprehensive analysis of regulatory databases, industry association publications, energy sector reports, and authoritative industrial statistics. Key sources included the U.S. Department of Energy (DOE), Environmental Protection Agency (EPA), Energy Information Administration (EIA), European Commission DG Energy, European Industrial Gases Association (EIGA), Compressed Gas Association (CGA), American Society of Mechanical Engineers (ASME), Occupational Safety and Health Administration (OSHA), International Energy Agency (IEA), Eurostat Energy Database, National Institute of Standards and Technology (NIST), World Steel Association, International Council of Chemical Associations (ICCA), and national statistical offices from Romania, Hungary, Serbia, and Greece. These sources were used to collect production capacity data, plant utilization rates, regulatory compliance frameworks, safety standards, import/export trade statistics, and end-user consumption patterns for atmospheric gases, process gases, and specialty gases.


Primary Research

To gather both qualitative and quantitative insights, supply-side and demand-side stakeholders were interviewed during the primary research process. CEOs, VPs of operations, plant managers, and commercial directors from gas distribution firms, air separation unit (ASU) operators, and industrial gas makers were examples of supply-side suppliers. Procurement heads from petrochemical complexes, steel producers, healthcare facility managers, automobile production heads, electronics semiconductor fabrication plant managers, and oil and gas refinery procurement chiefs were examples of demand-side sources. Market segmentation was established, capacity development timetables were confirmed, and information on bulk delivery acceptance, on-site generating trends, merchant gas contracting models, and price dynamics related to energy costs was obtained through primary research.

Primary Respondent Breakdown:

By Designation: C-level Primaries (28%), Director Level (35%), Others (37%)

By Region: North America (28%), Europe (32%), Asia-Pacific (25%), Rest of World (15%)


Market Size Estimation

Production volume analysis and capacity mapping were used to determine the global market valuation. The following were part of the methodology:

Finding more than fifty major manufacturers and regional gas producers in Latin America, Asia-Pacific, Europe, and North America

Product mapping between process gases (hydrogen, carbon dioxide, helium), atmospheric gases (oxygen, nitrogen, and argon), and custom gas mixes

Examination of annual revenues for industrial gas portfolios, such as bulk liquid, compressed gas cylinders, and on-site generation services, both reported and projected

coverage of producers who will account for 75–80% of the world market in 2024

Segment-specific valuations for merchant, packed, and tonnage delivery models are obtained through extrapolation utilizing top-down (manufacturer revenue validation against trade data) and bottom-up (production capacity × capacity utilization × ASP per gas type and country) methodologies.

Download Free Sample

Kindly complete the form below to receive a free sample of this Report

Download PDF ×

We do not share your information with anyone. However, we may send you emails based on your report interest from time to time. You may contact us at any time to opt-out.