Industrial Valves Market (2026 - 2035)

Industrial Valves Market Research Report By Valve Type (Gate Valves, Ball Valves, Butterfly Valves, Globe Valves, Check Valves, Diaphragm Valves, Others (Plug, Pinch, Needle)), By End-User Industry (Oil & Gas, Water & Wastewater, Power Generation, Chemical & Petrochemical, Food & Beverage, Pharmaceutical & Biotech, Others (Mining, Pulp & Paper, HVAC)), By Actuation Mode (Manual, Pneumatic, Electric, Hydraulic) and By Regional (North America, Europe, South America, Asia Pacific, Middle East and Africa) - Industry Forecast to 2035
ID: MRFR/Equip/6067-CR
254 Pages
Snehal Singh
Last Updated: June 29, 2026
Industrial Valves Market
Market Size
Forecast Period2026-2035
2025 Market SizeUSD 88.5 Billion
2035 Market SizeUSD 155.5 Billion
Key Players
Emerson Electric (Fisher
Vanessa)
Flowserve Corporation
IMI plc
Schlumberger
Crane Co.
Opportunities
  • Smart Valve and Predictive Maintenance Platforms
  • Hydrogen-Ready and CCUS Valve Certification
  • Emerging-Market Water and Sanitation Infrastructure

Industrial Valve Market Summary

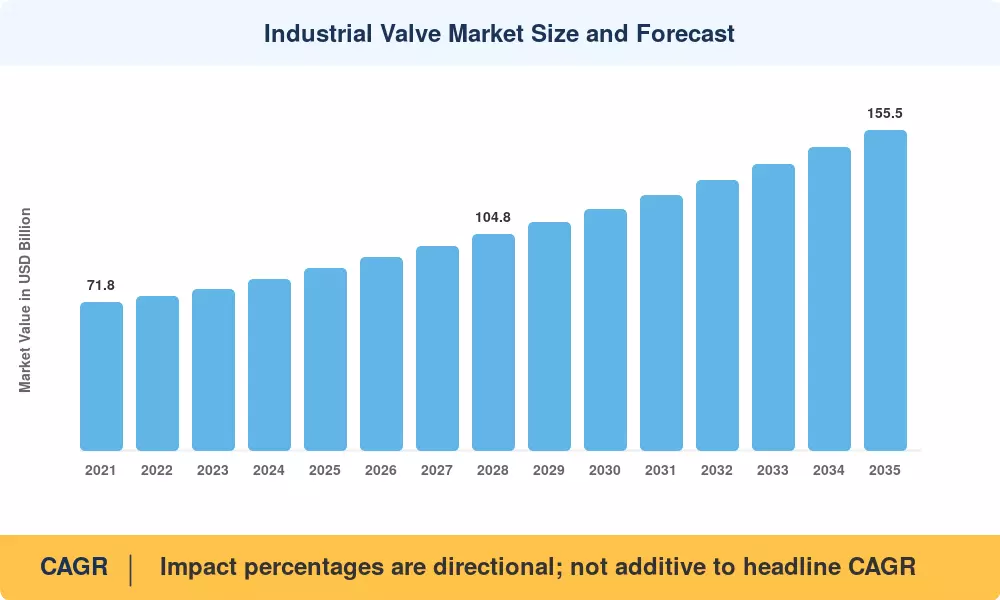
The Industrial Valve Market reached an estimated USD 88.5 billion in 2025, positioning it to grow from USD 93.6 billion in 2026 to USD 155.5 billion by 2035 at a compound annual growth rate of 5.8% during the 2026–2035 forecast window. Two catalysts anchor this trajectory: a global wave of aging infrastructure replacement — the American Society of Civil Engineers estimates USD 2.6 trillion in deferred water infrastructure investment in the U.S. alone [1] — and tightening fugitive emissions regulations across oil-producing nations that mandate upgraded sealing technologies in pipeline networks [2].

A fundamental technology shift is reshaping how valves are specified, operated, and maintained. Legacy manual actuators and analog positioners are giving way to smart valve assemblies equipped with embedded sensors, digital twins, and IIoT connectivity. The International Energy Agency projects that digitized process plants could reduce unplanned downtime by 20–30% by 2030, driving upstream and midstream operators to accelerate valve automation investments [3]. Governments in the EU and India have also introduced stricter methane abatement mandates that directly increase demand for low-emission valve designs [4].

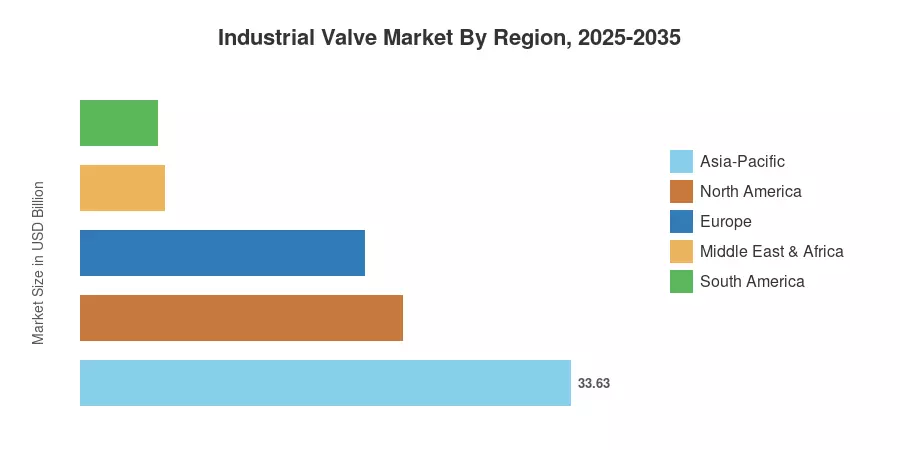
Asia-Pacific commands the largest share of the Industrial Valve Market at roughly 38% of 2025 revenue, buoyed by China's petrochemical expansion and India's Jal Jeevan Mission water infrastructure program. The region also posts the fastest forecast CAGR at approximately 7.2%. North America holds the second-largest share at 25%, driven by LNG export terminal buildouts and shale midstream investment. Europe follows at 22%, anchored by hydrogen pipeline pilot projects and decarbonization retrofits. The decade ahead will reward manufacturers who combine digital capability with regional compliance expertise.


Key Report Takeaways

• By Valve Type

  • Gate valves hold the largest revenue share at approximately 28% of the Industrial Valve Market, underpinned by ubiquitous use in isolation duty across oil, gas, and water networks.
  • Ball valves register the fastest segment CAGR at 6.4% through 2035, reflecting growing LNG and hydrogen applications that demand tight shut-off and quarter-turn actuation.
  • Butterfly valves account for an estimated USD 15.9 billion in 2025 revenue, gaining traction in large-diameter HVAC and water treatment installations.

• By End-User Industry

  • The oil and gas sector represents the single largest demand vertical in the Industrial Valve Market, contributing roughly 28% of global spend.
  • Water and wastewater utilities show a projected CAGR of 6.8%, the highest among end-user verticals, as governments prioritize clean-water access.
  • Power generation accounts for approximately USD 13.3 billion in 2025, with combined-cycle gas turbine plants and nuclear restarts sustaining replacement demand.

• By Region

  • Asia-Pacific leads the total market value at USD 33.6 billion in 2025.
  • The Middle East and Africa region posts a CAGR of 6.5%, driven by Saudi Vision 2030 megaprojects and UAE gas field expansions.
  • North America captures 25% share, anchored by U.S. LNG infrastructure and Canadian oil-sands debottlenecking.


Industrial Valve Market Size and Forecast (2021–2035)

Market sizing draws on a triangulated methodology that cross-references manufacturer revenue disclosures, trade-association shipment data (Valve Manufacturers Association of America, European Industrial Valve Manufacturers' Association), customs databases, and downstream capex budgets from publicly listed end users. Historical figures reflect actuals; forecast values apply a base CAGR adjusted for cyclical capex patterns in oil and gas, water infrastructure stimulus programs, and energy-transition policy timelines [5][6].
Industrial Valve Market Size and Forecast
Our Impact
Enabled $4.3B Revenue Impact for Fortune 500 and Leading Multinationals
Partnering with 2000+ Global Organizations Each Year
30K+ Citations by Top-Tier Firms in the Industry

Driver Impact Analysis

Driver ~% Impact on CAGR Geographic Relevance Impact Timeline
Oil & gas midstream expansion +1.4% North America, Middle East Short-term (≤2 yr)
Water infrastructure investment programs +1.1% Asia-Pacific, Africa Medium-term (2–4 yr)
LNG liquefaction and regasification buildout +0.9% Global Short-term (≤2 yr)
Fugitive emissions regulations (EPA, EU ETS) +0.7% North America, Europe Medium-term (2–4 yr)
Hydrogen economy and CCUS pipeline development +0.6% Europe, Asia-Pacific Long-term (≥4 yr)
Smart valve and IIoT integration +0.5% Global Long-term (≥4 yr)
Nuclear power restarts and new builds +0.4% Europe, Asia-Pacific Long-term (≥4 yr)


Oil and Gas Midstream Expansion

North American midstream operators committed over USD 45 billion in pipeline and processing capex between 2023 and 2025, and planned final investment decisions through 2028, adding another USD 60 billion in sanctioned projects. Each new pipeline segment requires thousands of gate, ball, and check valves rated for sour-service or high-pressure classes. The Permian Basin alone saw three major NGL fractionation expansions sanctioned in 2024, each specifying API 6D ball valves and ASME Class 600 gate valves in carbon and duplex stainless steel [11].

Global Water Infrastructure Programs

India's Jal Jeevan Mission has allocated INR 3.6 trillion (approximately USD 43 billion) to deliver piped water to every rural household by 2028, creating massive demand for ductile-iron butterfly and gate valves in distribution networks [14]. In the United States, the Bipartisan Infrastructure Law earmarks USD 55 billion for water and wastewater improvements, with a significant portion directed at lead service-line replacement and treatment-plant upgrades that require corrosion-resistant valve trim [1].

Fugitive Emissions Regulations

The U.S. EPA's Quad-Ob/OOOOc methane rules, finalized in late 2024, impose stringent leak detection and repair requirements on upstream and midstream facilities, accelerating replacements of legacy rising-stem valves with low-emission packing designs [2]. Europe's revised Industrial Emissions Directive similarly tightens fugitive-emission thresholds for refineries and chemical plants, compelling operators to retrofit or replace existing isolation and control valves with certified low-leak alternatives [4].

LNG and Hydrogen Pipeline Buildout

Global LNG liquefaction capacity is expected to grow by 45% between 2025 and 2030, according to the International Gas Union, requiring cryogenic-rated valves capable of operating at temperatures below –162 °C [11]. Simultaneously, the European Hydrogen Backbone initiative envisions 28,000 km of dedicated hydrogen pipelines by 2030, creating new demand for valves tested and certified for hydrogen embrittlement resistance [12].


Restraints Impact Analysis

Restraint impact percentages follow the same directional methodology described in Section 4. They indicate estimated downward pressure on growth but are not linearly subtractive from the CAGR.

Restraint ~% Impact on CAGR Geographic Relevance Impact Timeline
Raw-material price volatility (steel, nickel, alloys) –0.5% Global Short-term (≤2 yr)
Extended project lead times and permitting delays –0.4% North America, Europe Medium-term (2–4 yr)
Competition from low-cost manufacturers –0.3% Asia-Pacific exports globally Medium-term (2–4 yr)
Skilled labor shortages in valve fabrication –0.3% North America, Europe Long-term (≥4 yr)
Energy transition uncertainty in fossil-fuel demand –0.2% Global Long-term (≥4 yr)


Raw-Material Price Volatility

Stainless-steel and nickel-alloy prices surged over 40% between 2021 and 2023 before partially correcting, squeezing margins for valve manufacturers and prompting some end users to delay procurement cycles [6]. Duplex and super-duplex steels, critical for sour-service and offshore valves, remain subject to supply concentration risk as fewer than ten global mills produce these grades at scale.

Extended Project Permitting Timelines

Major pipeline and LNG projects in the United States and Europe now face average permitting timelines of 3–5 years, up from 18–24 months a decade ago [15]. These delays cascade into valve procurement schedules, pushing orders to the right and introducing forecast uncertainty for manufacturers planning production capacity. The Mountain Valley Pipeline, for example, experienced seven years of regulatory proceedings before completion in 2024.

Low-Cost Manufacturer Competition

Chinese and Indian valve manufacturers have expanded export capacity significantly, offering products at 30–50% discounts to Western OEMs for comparable API and ISO certifications [16]. While quality concerns persist in safety-critical applications, cost-sensitive segments such as building HVAC and municipal water distribution have shifted meaningfully toward these suppliers, compressing margins for established players.


Industrial Valve Market Opportunities

Smart Valve and Predictive Maintenance Platforms

If OEMs are ready to offer outcome-based maintenance contracts rather than just hardware, then they can generate recurring revenue streams by integrating wireless sensor networks and analytics based on AI into valve positioners and actuators. Smart valves are the foundation of that value proposition [3]. By 2030, predictive maintenance may save process industries an estimated USD 630 billion a year in unnecessary downtime expenses.


Hydrogen-Ready and CCUS Valve Certification

The hydrogen blending requirements and the scaling up of carbon-capture pipeline projects from pilot to commercial scale represent a large valve-certification gap for 100% hydrogen service and dense-phase CO₂ transport. Manufacturers who make early investments in testing, qualification and materials R&D can secure premium prices and multi-year supply contracts with national hydrogen utilities [12].


Emerging-Market Water and Sanitation Infrastructure

The Industrial Valve Market provides significant greenfield prospects in Sub-Saharan Africa and Southeast Asia, where a number of countries have urbanization rates of more than 4% each year. The World Bank promised more than USD 30 billion in water and sanitation lending through 2030. And every new treatment plant or distribution network needs considerable valve procurement [14].


Modular and Prefabricated Valve Packages

LNG and petrochemical projects are becoming more and more modular in construction processes, pushing valve specification and testing upstream into fabrication yards. By delivering valve packages pre-assembled, tested, and tagged, manufacturers can cut field installation time by 25–40%, generating a differentiated value proposition that commands greater margins [11].


Data Monetization Through Digital Twins

Valve OEMs that capture operational data from installed smart valves can build anonymized performance benchmarking databases, offering end users analytics-as-a-service products. This transforms one-time hardware sales into subscription-based digital business models with gross margins exceeding 60%, a pattern already proven in adjacent industrial segments like pump and compressor monitoring [3].


Industrial Valve Market Future Outlook

AI-Driven Autonomous Process Operations

Artificial intelligence is moving beyond predictive maintenance into closed-loop autonomous valve control. By 2030, an estimated 15% of large process plants will operate with AI-optimized control loops that dynamically adjust valve positions for throughput, energy efficiency, and emissions compliance simultaneously [3]. Valve manufacturers offering edge-computing-ready actuators will capture disproportionate aftermarket value as brownfield plants digitize.

The Hydrogen and CCUS Supercycle

Cumulative global investment in hydrogen production and transport infrastructure is projected to exceed USD 500 billion by 2035, according to the Hydrogen Council, while CCUS pipeline networks could span 30,000 km across North America and Europe by the same year [12][10]. This supercycle introduces entirely new material and testing requirements — valve OEMs must invest now in hydrogen compatibility labs and CO₂ phase-behavior test rigs to remain qualified suppliers.

Electrification and Battery-Powered Actuation

Electric actuators are steadily displacing pneumatic and hydraulic actuation in the Industrial Valve Market, driven by lower lifecycle costs, elimination of instrument air systems, and compatibility with digital control architectures. BloombergNEF estimates that electric actuator penetration in new valve installations will exceed 40% by 2032, up from roughly 22% in 2024 [18].

ESG Reporting and Supply-Chain Traceability

Scope 3 emissions reporting requirements under the EU's Corporate Sustainability Reporting Directive are pushing end users to demand material traceability and carbon-intensity data from valve suppliers. Manufacturers that invest in blockchain-based material provenance tracking and third-party-verified environmental product declarations will secure preferred-supplier status with major EPCs and national oil companies [4].


Industrial Valve Market Segmentation

By Valve Type

Segment Key Metric Primary Demand Driver
Gate Valves 28% share (2025) Pipeline isolation duty, water distribution
Ball Valves CAGR 6.4% LNG, hydrogen, quarter-turn automation
Butterfly Valves USD 15.9 B (2025) Large-diameter HVAC, water treatment
Globe Valves 12% share Throttling service in power and chemical plants
Check Valves CAGR 5.5% Pump discharge protection, non-return service
Diaphragm Valves USD 4.4 B (2025) Pharmaceutical, food, biotech
Others (Plug, Pinch, Needle) 5% share Specialty chemical, sampling


Gate valves remain the workhorse of the Industrial Valve Market because virtually every pipeline isolation application — from crude-oil trunk lines to potable-water mains — specifies a rising-stem or slab-gate design for full-bore, low-pressure-drop shut-off. Their dominance is structural: any new pipeline kilometer built anywhere in the world requires multiple gate valves at block-valve stations, pig launchers, and manifold assemblies.

Ball valves are gaining share at the fastest pace, propelled by LNG's extreme growth and the hydrogen economy's need for metal-seated, fire-safe quarter-turn valves. The emergence of fully welded ball valve designs rated for high-cycle hydrogen service positions this segment for continued outperformance as energy-transition infrastructure spending accelerates through 2035.

By End-User Industry

Segment Key Metric Primary Demand Driver
Oil & Gas 28% share (2025) Upstream, midstream, and refining capex
Water & Wastewater CAGR 6.8% Municipal infrastructure programs
Power Generation USD 13.3 B (2025) CCGT, nuclear restarts, renewables BOP
Chemical & Petrochemical 14% share Ethylene, methanol, specialty chemicals
Food & Beverage CAGR 6.2% Hygienic processing regulations
Pharmaceutical & Biotech USD 5.3 B (2025) Biomanufacturing scale-up
Others (Mining, Pulp & Paper, HVAC) 11% share Diversified industrial applications


Oil and gas remain the anchor vertical, though its relative share is gradually declining as water, food-processing, and pharmaceutical applications grow faster. The water and wastewater segment benefits from an unusual convergence of policy tailwinds — India's Jal Jeevan Mission, U.S. lead-pipe replacement mandates, and UN Sustainable Development Goal 6 targets all channel public spending into treatment plants and distribution networks that are valve-intensive by design.

The pharmaceutical and biotech segment, while smaller in absolute terms, commands premium unit pricing because valve specifications demand sanitary finishes, CIP/SIP compatibility, FDA-compliant elastomers, and full material traceability — characteristics that favor specialized manufacturers with validated quality systems.

By Actuation Mode

Segment Key Metric Primary Demand Driver
Manual 42% share (2025) Cost-sensitive isolation applications
Pneumatic USD 21.7 B (2025) Existing installed base in process plants
Electric CAGR 7.8% Digital integration, energy efficiency
Hydraulic 8% share High-force subsea and wellhead applications


Manual valves still dominate by unit count, but the growth story belongs to electric actuation. Plant operators are increasingly specifying electric actuators for new installations because they eliminate the cost and maintenance burden of compressed-air systems while offering direct integration with digital control platforms and remote-operations architectures [18].


Regional Market Share Analysis

Region Key Metric Primary Investment Themes
Asia-Pacific 38% share (2025) Petrochemical expansion, water infrastructure, nuclear
North America USD 22.1 B (2025) LNG terminals, shale midstream, water utility upgrades
Europe 22% share (2025) Hydrogen pipelines, decarbonization retrofits, nuclear restarts
Middle East & Africa CAGR 6.5% Oil & gas megaprojects, desalination, Vision 2030
South America USD 5.3 B (2025) Pre-salt offshore, mining, municipal water
Total USD 88.5 B (2025)

The Industrial Valve Market displays meaningful regional variation driven by differing energy mixes, infrastructure maturity, and regulatory regimes. Asia-Pacific's dominance reflects both the sheer scale of Chinese industrial output and accelerating greenfield investment across India and Southeast Asia, while North America's strength traces to hydrocarbon midstream expansion and stringent valve specification cultures.


Asia-Pacific

Country Key Metric Key Driver
China 48% of regional share Petrochemical self-sufficiency program
India CAGR 8.1% Jal Jeevan Mission and refinery expansion
Japan USD 3.2 B (2025) Nuclear restarts and LNG import terminals
South Korea 7% of regional share Shipbuilding and semiconductor fabs
Southeast Asia CAGR 7.5% Urbanization and gas-fired power buildout


China's ongoing USD 120 billion petrochemical capacity expansion along its eastern seaboard drives sustained demand for high-specification control and isolation valves across ethylene, PTA, and refining complexes. India's trajectory is equally compelling — beyond the Jal Jeevan Mission, India's city gas distribution network is expanding to 300+ cities, each requiring extensive pressure-regulation and safety shut-off valve systems [14].

North America

Country Key Metric Key Driver
United States 78% of regional share LNG export, shale midstream, water infrastructure
Canada USD 3.5 B (2025) Oil-sands debottlenecking, Trans Mountain
Mexico CAGR 5.2% Pemex refinery rehabilitation, nearshoring


The United States remains the single largest national market for industrial valves, with Gulf Coast LNG export terminals alone accounting for an estimated USD 1.8 billion in valve procurement between 2024 and 2028 [11]. Domestic water-utility spending is also accelerating as the EPA's Lead and Copper Rule Improvements drive widespread distribution-system valve replacements [1].

Europe

Country Key Metric Key Driver
Germany 24% of regional share Hydrogen backbone, chemical industry
United Kingdom CAGR 5.9% North Sea decommissioning, offshore wind
France USD 2.8 B (2025) Nuclear fleet life-extension program
Italy 12% of regional share Refinery conversion to biorefineries


Europe's Industrial Valve Market growth increasingly ties to energy-transition infrastructure. The European Hydrogen Backbone consortium's plan for 28,000 km of pipelines by 2030 represents a material greenfield demand pulse for valves tested against hydrogen embrittlement standards, while the EU Methane Regulation compels upstream operators to replace aging valve stock with certified low-emission designs [4][12].

Middle East and Africa

Country Key Metric Key Driver
Saudi Arabia 35% of regional share Aramco expansion, NEOM, desalination
UAE USD 2.1 B (2025) ADNOC gas processing, nuclear
Rest of MEA CAGR 7.0% Sub-Saharan water, Nigerian refinery projects


Saudi Aramco's Jafurah unconventional gas development alone is expected to require over 500,000 individual valve units across production, processing, and pipeline facilities, with first gas targeted for 2025 and full ramp-up by 2030. Desalination capacity across the GCC is set to double by 2035, sustaining demand for corrosion-resistant alloy valves in seawater service.

South America

Country Key Metric Key Driver
Brazil 62% of regional share Petrobras pre-salt FPSOs, Comperj
Argentina CAGR 6.3% Vaca Muerta shale development
Rest of South America USD 1.2 B (2025) Mining, municipal water


Petrobras plans to deploy 15 new floating production units between 2025 and 2030 under its 2024–2028 strategic plan, each requiring thousands of high-pressure subsea and topside valves in super-duplex and Inconel materials. Argentina's Vaca Muerta formation, meanwhile, has attracted over USD 5 billion in upstream investment commitments through 2027.


Industrial Valve Market By Region, 2025-2035

Competitive Benchmarking

The Industrial Valve Market is moderately fragmented, with an estimated Herfindahl-Hirschman Index below 500 and the top five players holding a combined 22–26% revenue share. Hundreds of regional manufacturers compete in commodity segments, while a smaller group of global OEMs dominates safety-critical, high-specification niches such as cryogenic, subsea, and severe-service control valves. Competitive differentiation increasingly rests on digital capabilities, aftermarket service networks, and certification breadth.

Company Est. Revenue Share Range Key Offerings Strategic Positioning
Emerson Electric (Fisher, Vanessa) ~5–7% Control valves, actuators, digital solutions Integrated automation ecosystem
Flowserve Corporation ~4–6% Isolation, control, nuclear-qualified valves Aftermarket and lifecycle services
IMI plc (IMI Critical Engineering) ~3–5% Severe-service, nuclear, custom-engineered Premium niche engineering
Schlumberger (Cameron) ~3–5% Subsea, wellhead, surface chokes Upstream oil & gas specialist
Crane Co. (Crane ChemPharma & Energy) ~2–4% Process, cryogenic, sanitary valves Material science and alloy expertise
Neles (Valmet) ~2–4% Ball, butterfly, automation packages Pulp & paper and process digitalization
KITZ Corporation ~2–3% Bronze, stainless, industrial ball valves Asia-Pacific distribution strength
Velan Inc. ~1–3% Nuclear, cryogenic, forged-steel valves Nuclear fleet installed base
Bray International ~1–2% Resilient-seated butterfly, ball valves Cost-competitive midmarket
AVK Group ~1–2% Water and wastewater gate, butterfly valves Municipal specification dominance


Recent News & Developments


  • IMI Critical Engineering (March 2024): Completed hydrogen-compatibility testing of its full severe-service valve portfolio at pressures up to 700 bar, becoming one of the first major OEMs to certify a product line for 100% hydrogen pipeline service [12].


  • European Commission (4 August 2024 ): Published the final text of the EU Methane Regulation requiring oil, gas, and coal operators to implement mandatory leak detection and repair programs, directly driving valve replacement cycles across European upstream assets [4].


Industrial Valve Market Report Scope

Parameter Detail
Market Scope Global Industrial Valve Market — valves, actuators, and accessories
Study Period 2021–2035
CAGR Window 2026–2035
Market Size (2025) USD 88.5 Billion
Market Size (2035) USD 155.5 Billion
CAGR 5.8%
Fastest Growing Segment (Type) Ball Valves (CAGR 6.4%)
Fastest Growing Region Asia-Pacific (CAGR ~7.2%)
Companies Profiled 10
Valuation Currency USD (constant 2025 dollars)
CAGR Driver Disclaimer Impact percentages are directional; not additive to headline CAGR


FAQs

How do lead times for custom-engineered valves compare to standard catalog products?
Custom-engineered valves in exotic alloys or nuclear grades typically require 26–40 weeks versus 6–10 weeks for standard carbon-steel catalog items [5]. Buyers should place engineered-valve orders 12+ months ahead of construction milestones to avoid schedule risk.
What qualification standards differentiate valve suppliers in subsea applications?
API 17D and API 6DSS govern subsea valve design, testing, and material requirements at pressures exceeding 15,000 psi [8]. Only a handful of manufacturers globally hold active subsea qualifications, creating significant barriers to entry.
How is additive manufacturing changing valve production economics?
Metal 3D printing enables complex internal flow geometries and reduces lead times for low-volume specialty valve bodies by 40–60% [20]. Adoption remains limited to prototyping and niche severe-service components due to certification timelines.
What total cost-of-ownership factors should buyers weigh beyond purchase price?
Installation, actuation, maintenance, energy consumption, and fugitive-emission compliance costs typically represent 60–70% of a valve's lifetime expense [22]. Specifying higher-grade packing and electric actuation often lowers total cost despite a higher upfront price.
How do trade tariffs affect valve procurement strategy?
U.S. Section 301 tariffs on Chinese-origin valves range from 7.5% to 25%, prompting many buyers to dual-source from India, South Korea, and domestic suppliers [16]. Tariff exposure should be modeled into landed-cost comparisons during vendor evaluation.
What role do valve distributors play in the Industrial Valve Market's channel structure?
Distributors handle roughly 35–40% of valve sales globally, providing local stocking, technical selection support, and same-day availability for MRO needs [5]. Direct OEM channels dominate for project-engineered and safety-critical specifications.
How will digital twin technology reshape valve aftermarket services?
Digital twins enable continuous performance monitoring and virtual failure-mode simulation, reducing unplanned maintenance interventions by up to 30% [3]. OEMs offering twin-enabled lifecycle contracts will capture growing aftermarket share through 2035.    
Author
Author
Author Profile
Snehal Singh LinkedIn
Manager - Research
High acumen in analyzing complex macro & micro markets with more than 6 years of work experience in the field of market research. By implementing her analytical skills in forecasting and estimation into market research reports, she has expertise in Packaging, Construction, and Equipment domains. She handles a team size of 20-25 resources and ensures smooth running of the projects, associated marketing activities, and client servicing.

Research Approach


Secondary Research

The secondary research process involved comprehensive analysis of regulatory databases, industry publications, technical standards repositories, and authoritative engineering organizations. Key sources included the American Society of Mechanical Engineers (ASME.org), American Petroleum Institute (API.org), International Organization for Standardization (ISO.org), International Electrotechnical Commission (IEC.ch), US Environmental Protection Agency (EPA.gov), US Department of Energy (DOE.gov), European Committee for Standardization (CEN.eu), British Valve & Actuator Association (BVAA.org.uk), Valve Manufacturers Association of America (VMA.org), International Water Association (IWA), Power Engineering International, Hydrocarbon Processing, Chemical Engineering Magazine, World Pipelines, Oil & Gas Journal, and national statistical agencies including US Census Bureau, EU Eurostat, China National Bureau of Statistics, and Japan Ministry of Economy, Trade and Industry. These sources were used to collect industrial production data, regulatory compliance standards, material specifications, end-use industry trends, and competitive landscape analysis for ball valves, gate valves, globe valves, butterfly valves, check valves, and specialty valve technologies across stainless steel, cast iron, alloy-based, and cryogenic material categories.


Primary Research

Qualitative and quantitative insights were obtained by interviewing supply-side and demand-side stakeholders during the primary research process. The supply-side sources consisted of CEOs, VPs of Engineering, leaders of R&D, and commercial directors from valve manufacturers, OEMs, and actuator technology providers. Procurement directors, maintenance managers, project engineers, and operations vice presidents from oil and gas corporations, water utilities, power generation facilities, chemical processing plants, and EPC contractors were included in the demand-side sources for infrastructure projects. Market segmentation was verified, product certification timelines were verified, and insights regarding procurement patterns, lifecycle replacement cycles, and aftermarket service dynamics were obtained through primary research.

Primary Respondent Breakdown:

By Designation: C-level Primaries (28%), Director Level (32%), Others (40%)

By Region: North America (32%), Europe (29%), Asia-Pacific (34%), Rest of World (5%)


Market Size Estimation

Global market valuation was derived through revenue mapping and unit shipment analysis. The methodology included:

Identification of 60+ key manufacturers across North America, Europe, Asia-Pacific, Middle East, and Latin America

Product mapping across ball valves, butterfly valves, gate valves, globe valves, check valves, plug valves, pinch valves, and other specialty valve categories

Analysis of reported and modeled annual revenues specific to industrial valve portfolios

Coverage of manufacturers representing 65-70% of global market share in 2024

Extrapolation using bottom-up (unit shipments × ASP by country and end-use sector) and top-down (manufacturer revenue validation) approaches to derive segment-specific valuations for oil & gas, water & wastewater, energy & power, chemicals, construction, and food & beverage applications

Download Free Sample

Kindly complete the form below to receive a free sample of this Report

Download PDF ×

We do not share your information with anyone. However, we may send you emails based on your report interest from time to time. You may contact us at any time to opt-out.
















