Download Free Sample
Kindly complete the form below to receive a free sample of this Report
Intellectual Property (IP) Litigation Services Market Research Report Information By End Use (Corporate Entities, Legal Firms, Government Agencies, Research Institutions), By Industry (Technology, Pharmaceuticals, Entertainment, Manufacturing), By Application (Patent Litigation, Trademark Litigation, Copyright Litigation, Trade Secret Litigation), By Client Type (Small Enterprises, Medium Enterprises, Large Corporations, Startups), By Service Type (Consultation Services, Litigation Support Services, Mediation Services, Arbitration Services) And By Region (North America, Europe, Asia-Pacific, And Rest Of The World) – Market Forecast Till 2035.
As per MRFR analysis, the Intellectual Property (IP) Litigation Services Market was estimated at 10.5 USD Billion in 2024. The IP litigation industry is projected to grow from 10.86 USD Billion in 2025 to 15.2 USD Billion by 2035, exhibiting a compound annual growth rate (CAGR) of 3.42% during the forecast period 2025 - 2035.
The Intellectual Property (IP) Litigation Services Market is experiencing dynamic growth driven by technological advancements and evolving legal landscapes.
| 2024 Market Size | 10.5 (USD Billion) |
| 2035 Market Size | 15.2 (USD Billion) |
| CAGR (2025 - 2035) | 3.42% |
Baker McKenzie (US), DLA Piper (GB), Kirkland & Ellis (US), Latham & Watkins (US), Sidley Austin (US), Hogan Lovells (GB), Jones Day (US), Finnegan (US), Fish & Richardson (US), Morrison & Foerster (US)
Our Impact
Enabled $4.3B Revenue Impact for Fortune 500 and Leading Multinationals
Partnering with 2000+ Global Organizations Each Year
30K+ Citations by Top-Tier Firms in the Industry
The Intellectual Property (IP) Litigation Services Market is currently experiencing a dynamic evolution, driven by the increasing complexity of intellectual property rights and the growing need for businesses to protect their innovations. As companies expand globally, they face diverse legal challenges that necessitate specialized litigation services. This market appears to be influenced by various factors, including technological advancements, regulatory changes, and the rising importance of intellectual property in corporate strategy. Legal firms are adapting to these shifts by enhancing their service offerings and leveraging technology to streamline processes, which may lead to more efficient dispute resolution. Moreover, the competitive landscape of the Intellectual Property (IP) Litigation Services Market is becoming increasingly intricate. Firms are not only competing on the basis of expertise but also on their ability to provide comprehensive solutions that encompass both litigation and advisory services. This trend suggests a potential shift towards integrated service models, where legal counsel collaborates closely with clients to develop proactive strategies for IP management. As the market continues to evolve, stakeholders must remain vigilant to emerging trends and adapt their approaches accordingly, ensuring they are well-positioned to navigate the complexities of IP litigation in the future.
The integration of advanced technologies, such as artificial intelligence and machine learning, is transforming the Intellectual Property (IP) Litigation Services Market. Legal firms are increasingly utilizing these tools to enhance research capabilities, streamline case management, and improve overall efficiency. This trend indicates a shift towards more data-driven approaches in litigation, potentially leading to faster and more accurate outcomes.
As globalization continues to shape business operations, the Intellectual Property (IP) Litigation Services Market is witnessing a rise in cross-border disputes. Companies are often entangled in legal battles that span multiple jurisdictions, necessitating a nuanced understanding of international IP laws. This trend suggests that legal practitioners must develop expertise in navigating complex international frameworks to effectively represent their clients.
There is a growing emphasis on preventive measures within the Intellectual Property (IP) Litigation Services Market. Businesses are recognizing the value of proactive IP management to mitigate potential disputes before they escalate into litigation. This trend indicates a shift towards advisory services, where legal experts work closely with clients to establish robust IP strategies, thereby reducing the likelihood of costly legal battles.
The increasing awareness of intellectual property rights among businesses and individuals drives the demand for Intellectual Property (IP) Litigation Services Market. As companies expand their operations and innovate, they seek to protect their inventions, trademarks, and copyrights. This heightened focus on IP protection is evidenced by the rise in patent filings, which reached over 3.2 million in 2023. Consequently, the need for legal services specializing in IP litigation has surged, as organizations aim to safeguard their assets from infringement. The Intellectual Property (IP) Litigation Services Market is thus experiencing a robust growth trajectory, fueled by the necessity for legal recourse in the face of potential violations.
Recent legislative changes and reforms in intellectual property law are shaping the landscape of the Intellectual Property (IP) Litigation Services Market. Governments are increasingly recognizing the need to adapt IP laws to keep pace with technological advancements and evolving business practices. In 2023, several countries enacted reforms aimed at strengthening IP protection, which may lead to an uptick in litigation cases as businesses seek to enforce their rights. These changes create opportunities for legal practitioners specializing in IP litigation, as they assist clients in understanding and navigating the new legal frameworks. The Intellectual Property (IP) Litigation Services Market is thus likely to benefit from these developments, as organizations seek to ensure compliance and protect their innovations.
The rapid expansion of e-commerce and digital platforms has transformed the landscape of business operations, leading to an increased reliance on intellectual property rights. As online transactions proliferate, the Intellectual Property (IP) Litigation Services Market is likely to experience heightened demand for legal services related to copyright and trademark disputes. In 2023, e-commerce sales surpassed 5 trillion, underscoring the significance of IP protection in the digital realm. Companies operating in this space must ensure their intellectual property is safeguarded against infringement, thereby driving the need for specialized litigation services. This trend indicates a promising outlook for the Intellectual Property (IP) Litigation Services Market.
Investment in research and development (R&D) has seen a marked increase across various sectors, particularly in technology and pharmaceuticals. This trend is likely to bolster the Intellectual Property (IP) Litigation Services Market, as companies strive to protect their innovations. In 2023, R&D spending reached approximately 2.5 trillion, reflecting a commitment to innovation. As organizations develop new products and technologies, the potential for IP disputes escalates, necessitating specialized legal services. The Intellectual Property (IP) Litigation Services Market stands to benefit from this investment, as firms seek to navigate the complexities of IP law and defend their proprietary rights.
There is a growing recognition among businesses of the potential consequences of intellectual property infringement, which is likely to propel the demand for litigation services. Companies are increasingly aware that failing to protect their IP can lead to significant financial losses and reputational damage. This awareness is reflected in the rising number of IP litigation cases, which reached over 50,000 in 2023. As organizations seek to mitigate risks associated with IP violations, the Intellectual Property (IP) Litigation Services Market is positioned to thrive. Legal professionals specializing in IP law are becoming essential partners for businesses aiming to navigate the complexities of enforcement and compliance.
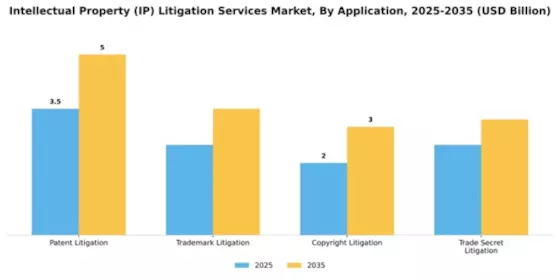
In the Intellectual Property (IP) Litigation Services Market, Patent Litigation holds the largest share among the various application segments. This segment is characterized by its critical role in safeguarding inventors and organizations against patent infringements, leading to a significant volume of litigation cases. Following closely is Trademark Litigation, which is quickly gaining traction in the market. With the surge in e-commerce and brand globalization, the importance of protecting trademarks has never been more emphasized, leading to a sharp rise in trademark-related disputes.
Patent Litigation (Dominant) vs. Trademark Litigation (Emerging)
Patent Litigation remains the dominant force in the Intellectual Property (IP) Litigation Services Market, primarily due to the complexity of patent laws and the increasing intricacies of technological innovations. Companies are more inclined to protect their intellectual capital through robust patent enforcement. In contrast, Trademark Litigation is emerging rapidly as businesses expand their market presence globally. The rise in online businesses and the proliferation of brands have necessitated greater vigilance in trademark enforcement, attracting a growing number of litigation cases. As intellectual property continues to evolve, both segments will play critical roles in shaping the legal landscape.
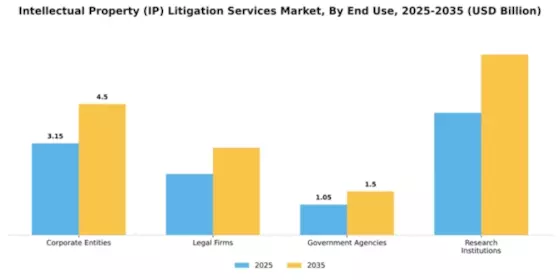
Among the end-use segments in the Intellectual Property (IP) Litigation Services Market, Corporate Entities hold the largest share, primarily driven by their need to protect proprietary technologies and innovation. They actively engage in litigation to safeguard their intellectual property assets. Legal Firms, while smaller in market share, represent the fastest-growing segment as businesses increasingly seek specialized legal services to navigate complex IP litigation processes, thus fueling demand for their expertise.
Corporate Entities: Dominant vs. Legal Firms: Emerging
Corporate Entities have established themselves as the dominant players in the Intellectual Property (IP) Litigation Services Market due to their extensive resources and substantial stakes in intellectual property. Their need for robust legal strategies ensures sustained demand for IP litigation services. Legal Firms, on the other hand, are emerging as pivotal partners for these entities, adapting to the rapid advancements in technology and the evolving landscape of IP law. Their ability to offer specialized services and innovative solutions positions them favorably to capitalize on increasing corporate litigation needs, making them a crucial player in this market.
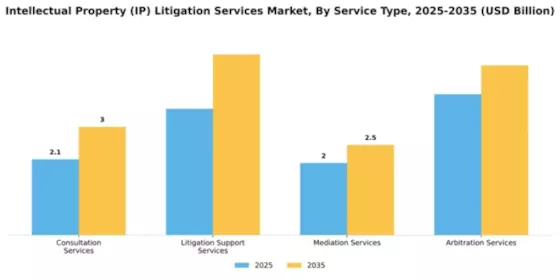
The Intellectual Property (IP) Litigation Services Market is characterized by distinct service types, with Litigation Support Services commanding the largest share. This segment caters to essential needs in litigation processes, making it a cornerstone for IP cases. In contrast, Mediation Services are emerging rapidly, gaining traction as businesses seek alternative dispute resolution methods to avoid lengthy litigation. This aligns with a growing trend towards amicable solutions in IP conflicts, boosting its market appeal. The growth trends for these services are heavily influenced by the increasing complexity of intellectual property cases and an upsurge in disputes over technology patents and copyrights. As organizations prioritize protection of their intangible assets, the demands for both Litigation Support Services and mediation approaches are expected to rise. Corporate litigation strategies are increasingly incorporating mediation as a crucial component, reflecting a shift in how entities approach IP-related disputes, thereby promising continued growth in these segments.
Litigation Support Services (Dominant) vs. Arbitration Services (Emerging)
Litigation Support Services play a dominant role in the IP Litigation Services Market, characterized by comprehensive offerings including legal research, document management, and expert witness coordination. Their importance is underscored by the increasing need for robust support during litigation processes, as IP cases become more intricate. By contrast, Arbitration Services are emerging as a preferred alternative for resolving disagreements in IP matters, noted for their efficiency and expertise in confidential proceedings. The growth of Arbitration Services is driven by an increasing preference for quicker resolutions and a desire to maintain the confidentiality of sensitive information inherent in IP disputes. This distinctive characteristic of arbitration is appealing to companies that seek to protect their proprietary data while navigating legal challenges.
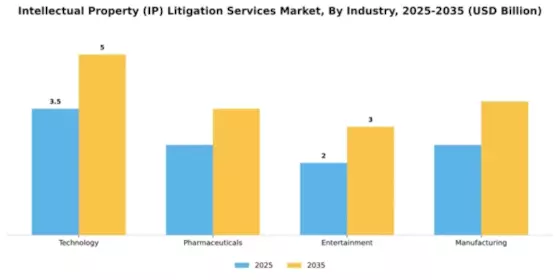
The Intellectual Property (IP) Litigation Services Market has shown a diverse market share distribution across various industries. Technology holds the largest segment share, driven by the rapid innovation in software and hardware, making companies increasingly vigilant about patent protection. Pharmaceuticals follow closely, leveraging the increasing importance of patent litigation as they navigate complex regulatory frameworks and the constant threat of generic competition.
Technology: Dominant vs. Pharmaceuticals: Emerging
The Technology sector is characterized by its dominant presence within the IP Litigation Services Market, primarily due to the high-value patents associated with tech innovations. This sector is rampant with patent disputes as companies strive to protect their innovations, from software solutions to electronic devices. On the other hand, the Pharmaceuticals sector is emerging rapidly, motivated by the growing emphasis on protecting drug patents amidst a backdrop of rising generic competition. The pharmaceutical industry faces unique challenges and litigation landscapes, specifically against generics and biosimilars, creating an intense demand for IP litigation services.
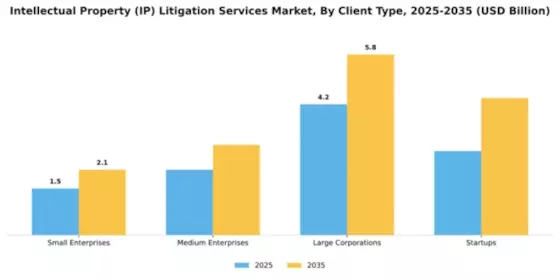
In the Intellectual Property (IP) Litigation Services Market, the client type segmentation reveals a diverse landscape where large corporations command the largest share. These entities, with substantial resources and a pressing need to protect their intellectual property, contribute significantly to the overall demand for litigation services. In contrast, startups, while smaller in market share, are becoming increasingly relevant as they seek to establish and protect their innovations in competitive industries. Their growing focus on securing IP rights has made them a notable segment in this market.
Large Corporations: Dominant vs. Startups: Emerging
Large corporations, characterized by their significant market presence and ability to invest heavily in IP litigation, dominate the intellectual property services landscape. These entities often have established legal teams dedicated to managing IP rights, thus ensuring proactive measures against infringement. Meanwhile, startups represent an emerging force in this market; they are agile and innovative, driven by the necessity to protect unique ideas and technologies. As these smaller companies seek to scale, they frequently engage in litigation to safeguard their competitive edge, thereby increasing their relevance and demand for IP litigation services in the industry.
Get more detailed insights about Intellectual Property (IP) Litigation Services Market Request Free Sample
North America continues to lead the Intellectual Property (IP) Litigation Services market, holding a significant share of 5.25 in 2024. The region's growth is driven by a robust legal framework, increasing patent filings, and a surge in technology-related disputes. Regulatory support and a strong emphasis on IP protection further catalyze demand, making it a prime location for litigation services. The competitive landscape is characterized by major players such as Baker McKenzie, Kirkland & Ellis, and Latham & Watkins, which dominate the market. The U.S. remains the leading country, with a well-established legal system that supports IP enforcement. The presence of top-tier law firms ensures that clients receive comprehensive services, enhancing the region's reputation as a hub for IP litigation.
Europe's Intellectual Property (IP) Litigation Services market is poised for growth, with a market size of 3.0 in 2024. The region benefits from evolving legal frameworks that enhance IP protection and enforcement. Increased cross-border disputes and a focus on innovation drive demand for litigation services, supported by regulatory initiatives aimed at harmonizing IP laws across member states. Leading countries such as Germany, the UK, and France are at the forefront of this market, with a competitive landscape featuring firms like DLA Piper and Hogan Lovells. The presence of these key players ensures a diverse range of services tailored to meet the needs of clients navigating complex IP issues. As the market evolves, firms are adapting to new challenges and opportunities in the IP landscape.
The Asia-Pacific region is witnessing a burgeoning demand for Intellectual Property (IP) Litigation Services, with a market size of 2.5 in 2024. Rapid economic growth, increased foreign investments, and a rising number of patent applications are key drivers of this trend. Governments are also implementing stricter IP laws to protect local and foreign innovations, creating a favorable environment for litigation services. Countries like China, Japan, and India are leading the charge, with a competitive landscape that includes both local and international law firms. The presence of established players such as Finnegan and Fish & Richardson highlights the region's potential for growth. As businesses expand, the need for effective IP litigation strategies becomes increasingly critical, positioning Asia-Pacific as a key player in the global market.
The Middle East and Africa (MEA) region is emerging as a new frontier for Intellectual Property (IP) Litigation Services, with a market size of 0.75 in 2024. The growth is driven by increasing awareness of IP rights, foreign investments, and the establishment of regulatory frameworks aimed at protecting intellectual property. Governments are recognizing the importance of IP in fostering innovation and economic development, leading to a rise in demand for litigation services. Countries like South Africa and the UAE are at the forefront, with a growing number of law firms specializing in IP litigation. The competitive landscape is evolving, with both local and international firms seeking to capitalize on the untapped potential of the market. As the region continues to develop, the demand for effective IP litigation strategies is expected to increase significantly.
The Intellectual Property (IP) Litigation Services Market is characterized by a dynamic competitive landscape, driven by the increasing complexity of IP laws and the growing need for businesses to protect their innovations. Key players such as Baker McKenzie (US), DLA Piper (GB), and Kirkland & Ellis (US) are strategically positioned to leverage their extensive legal expertise and global reach. These firms focus on innovation and digital transformation, enhancing their service offerings through technology-driven solutions. Their collective strategies not only shape the competitive environment but also indicate a trend towards more integrated and client-centric approaches in IP litigation.The market structure appears moderately fragmented, with a mix of large multinational firms and specialized boutiques. Key players employ various business tactics, such as localizing their services to cater to regional legal nuances and optimizing their operational frameworks to enhance efficiency. This competitive structure allows for a diverse range of service offerings, enabling firms to differentiate themselves based on expertise, client relationships, and technological capabilities.In November Baker McKenzie (US) announced a strategic partnership with a leading technology firm to develop AI-driven tools aimed at streamlining the IP litigation process. This move is likely to enhance their operational efficiency and provide clients with more effective solutions for managing IP disputes. The integration of AI into their service offerings may position Baker McKenzie as a frontrunner in the market, potentially reshaping client expectations regarding speed and accuracy in litigation.In October DLA Piper (GB) expanded its global footprint by opening a new office in Singapore, focusing on the Asia-Pacific region's burgeoning IP landscape. This expansion reflects a strategic intent to tap into emerging markets where IP litigation is on the rise, thereby enhancing their competitive positioning. The establishment of a presence in Singapore may facilitate better client engagement and responsiveness to regional legal developments, which is crucial in a rapidly evolving market.In September Kirkland & Ellis (US) successfully represented a major technology client in a landmark patent infringement case, securing a ruling that could set a precedent in the industry. This victory not only underscores their litigation prowess but also enhances their reputation as a leader in IP litigation. Such high-profile cases are likely to attract new clients seeking similar expertise, thereby reinforcing Kirkland & Ellis's market position.As of December current trends in the IP litigation landscape include a pronounced shift towards digitalization and the integration of advanced technologies such as AI and machine learning. Strategic alliances among firms are becoming increasingly common, fostering innovation and enhancing service delivery. The competitive differentiation is likely to evolve from traditional price-based competition to a focus on technological innovation, reliability in supply chains, and the ability to provide tailored solutions that meet the unique needs of clients. This shift may redefine the competitive dynamics within the market, emphasizing the importance of adaptability and forward-thinking strategies.


The Intellectual Property (IP) Litigation Services Market is projected to grow at a 3.42% CAGR from 2025 to 2035, driven by increasing IP disputes and technological advancements.
New opportunities lie in:
By 2035, the market is expected to be robust, reflecting sustained growth and innovation.
| MARKET SIZE 2024 | 10.5(USD Billion) |
| MARKET SIZE 2025 | 10.86(USD Billion) |
| MARKET SIZE 2035 | 15.2(USD Billion) |
| COMPOUND ANNUAL GROWTH RATE (CAGR) | 3.42% (2025 - 2035) |
| REPORT COVERAGE | Revenue Forecast, Competitive Landscape, Growth Factors, and Trends |
| BASE YEAR | 2024 |
| Market Forecast Period | 2025 - 2035 |
| Historical Data | 2019 - 2024 |
| Market Forecast Units | USD Billion |
| Key Companies Profiled | Baker McKenzie (US), DLA Piper (GB), Kirkland & Ellis (US), Latham & Watkins (US), Sidley Austin (US), Hogan Lovells (GB), Jones Day (US), Finnegan (US), Fish & Richardson (US), Morrison & Foerster (US) |
| Segments Covered | Application, End Use, Service Type, Industry, Client Type |
| Key Market Opportunities | Growing demand for litigation services due to increased intellectual property rights enforcement and emerging technologies. |
| Key Market Dynamics | Rising complexity of intellectual property laws drives demand for specialized litigation services amid evolving technological landscapes. |
| Countries Covered | North America, Europe, APAC, South America, MEA |
The market valuation reached 10.5 USD Billion in 2024.
The market is expected to grow to 15.2 USD Billion by 2035.
The anticipated CAGR for this market is 3.42% from 2025 to 2035.
The segments include Patent Litigation, Trademark Litigation, Copyright Litigation, and Trade Secret Litigation.
Patent Litigation is projected to reach between 5.0 and 5.0 USD Billion by 2035.
Corporate entities are expected to account for a market value between 4.5 and 4.5 USD Billion by 2035.
Legal firms are projected to contribute between 3.0 and 3.0 USD Billion by 2035.
Key players include Baker McKenzie, DLA Piper, Kirkland & Ellis, and Latham & Watkins.
Services include Consultation Services, Litigation Support Services, Mediation Services, and Arbitration Services.
Research Institutions are projected to grow to between 6.2 and 6.2 USD Billion by 2035.


Kindly complete the form below to receive a free sample of this Report

“This is really good guys. Excellent work on a tight deadline. I will continue to use you going forward and recommend you to others. Nice job”


“Thanks. It’s been a pleasure working with you, please use me as reference with any other Intel employees.”


“Thanks for sending the report it gives us a good global view of the Betaïne market.”


“Thank you, this will be very helpful for OQS.”


“We found the report very insightful! we found your research firm very helpful. I'm sending this email to secure our future business.”


“I am very pleased with how market segments have been defined in a relevant way for my purposes (such as "Portable Freezers & refrigerators" and "last-mile"). In general the report is well structured. Thanks very much for your efforts.”


“I have been reading the first document or the study, ,the Global HVAC and FP market report 2021 till 2026. Must say, good info! I have not gone in depth at all parts, but got a good indication of the data inside!”


“We got the report in time, we really thank you for your support in this process. I also thank to all of your team as they did a great job.”


“The Automotive 48V ECU Components Procurement Intelligence Study” was a complex project, but the Market Research Future (MRFR) team handled it with quality, agility, and customer-centricity. They delivered all requested data on time and within the agreed scope. The team, including Shubhendra Anand and Rahul Gotadki, was always readily available to clarify questions and swiftly implement necessary adjustments, driving the project to a successful conclusion within a very demanding timeframe.
I would also like to specifically commend Akshay Agarwal for his responsiveness and support at every stage—from our initial inquiry on May 6th through to final delivery on June 18th. His dedication made the entire process seamless.”



