Download Free Sample
Kindly complete the form below to receive a free sample of this Report
Intellectual Property Litigation Support Services Market Size, Share and Trends Analysis Research Report Information By Industry (Technology, Pharmaceuticals, Entertainment, Manufacturing), By Application (Patent, Trademark, Copyright, Trade Secret Litigation), By Client Type (Law Firms, Corporations, Government Agencies, Academic Institutions), By Service Type (Consulting, Document Management, Expert Witness, Trial Support), And By Region – Market Forecast Till 2035.
As per MRFR analysis, the Intellectual Property Litigation Support Services Market was estimated at 10.5 USD Billion in 2024. The Intellectual Property Litigation Support Services industry is projected to grow from 11.04 USD Billion in 2025 to 18.2 USD Billion by 2035, exhibiting a compound annual growth rate (CAGR) of 5.13% during the forecast period 2025 - 2035.
The Intellectual Property Litigation Support Services Market is experiencing robust growth driven by technological advancements and increasing demand for specialized services.
| 2024 Market Size | 10.5 (USD Billion) |
| 2035 Market Size | 18.2 (USD Billion) |
| CAGR (2025 - 2035) | 5.13% |
Deloitte (GB), Ernst & Young (GB), KPMG (GB), PwC (GB), Navigant Consulting (US), Bain & Company (US), AlixPartners (US), FTI Consulting (US), Charles River Associates (US)
Our Impact
Enabled $4.3B Revenue Impact for Fortune 500 and Leading Multinationals
Partnering with 2000+ Global Organizations Each Year
30K+ Citations by Top-Tier Firms in the Industry
The Intellectual Property Litigation Support Services Market is currently experiencing a dynamic evolution, driven by the increasing complexity of intellectual property disputes and the growing need for specialized support. Legal professionals are increasingly relying on expert services to navigate the intricate landscape of intellectual property rights, which encompasses patents, trademarks, copyrights, and trade secrets. This market appears to be expanding as organizations seek to protect their innovations and creative works more effectively. The demand for litigation support services, including document management, expert witness services, and trial consulting, seems to be on the rise, reflecting a broader trend towards more sophisticated legal strategies. Moreover, advancements in technology are likely to play a pivotal role in shaping the future of the Intellectual Property Litigation Support Services Market. The integration of artificial intelligence and data analytics into litigation processes may enhance the efficiency and accuracy of legal proceedings. As firms increasingly adopt these technologies, the market could witness a shift towards more streamlined and cost-effective solutions. This trend suggests that the landscape of intellectual property litigation is not only becoming more competitive but also more reliant on innovative approaches to meet the evolving needs of clients and legal practitioners alike.
The Intellectual Property Litigation Support Services Market is witnessing a heightened demand for specialized services. Legal professionals are increasingly seeking expertise in areas such as patent analysis, trademark disputes, and copyright enforcement. This trend indicates a shift towards more tailored support, as firms recognize the complexities involved in intellectual property cases.
The integration of advanced technologies into litigation support services is becoming more prevalent. Tools such as artificial intelligence and machine learning are being utilized to streamline processes, enhance data analysis, and improve case management. This trend suggests that technology is reshaping the landscape of legal support, making it more efficient and effective.
There is a growing emphasis on cost-effectiveness within the Intellectual Property Litigation Support Services Market. Organizations are increasingly looking for solutions that provide value without compromising quality. This trend reflects a broader awareness of budget constraints and the need for efficient resource allocation in legal proceedings.
The Intellectual Property Litigation Support Services Market is significantly influenced by evolving regulatory frameworks surrounding intellectual property rights. Governments and international bodies continuously update laws to address emerging technologies and market dynamics. For instance, recent legislative changes have introduced stricter penalties for infringement, thereby increasing the stakes for businesses. This evolving landscape compels organizations to engage litigation support services to ensure compliance and effectively manage disputes. The market for these services is projected to expand as companies seek to navigate the complexities of new regulations, indicating a robust demand for expertise in the Intellectual Property Litigation Support Services Market.
The Intellectual Property Litigation Support Services Market is significantly impacted by globalization and the rise of cross-border disputes. As businesses expand internationally, they encounter diverse legal systems and varying intellectual property laws. This complexity necessitates the involvement of litigation support services to address jurisdictional challenges and navigate international regulations. The market is projected to grow as companies seek assistance in managing cross-border intellectual property disputes, which are becoming increasingly common. The demand for specialized services that can provide insights into different legal frameworks and facilitate effective dispute resolution is likely to drive the Intellectual Property Litigation Support Services Market forward.
The Intellectual Property Litigation Support Services Market experiences a notable increase in demand due to the rising number of intellectual property infringement cases. As businesses expand and innovate, the risk of infringement escalates, prompting companies to seek specialized litigation support services. In recent years, the number of patent litigation cases has surged, with estimates indicating a growth rate of approximately 5% annually. This trend necessitates the involvement of expert litigation support services to navigate complex legal landscapes, analyze evidence, and provide strategic insights. Consequently, the Intellectual Property Litigation Support Services Market is poised for growth as organizations prioritize the protection of their intellectual assets.
Technological advancements play a crucial role in shaping the Intellectual Property Litigation Support Services Market. The integration of artificial intelligence, data analytics, and e-discovery tools enhances the efficiency and effectiveness of litigation processes. These technologies enable legal teams to analyze vast amounts of data quickly, identify relevant information, and streamline case management. As firms increasingly adopt these innovations, the demand for specialized litigation support services rises. The market is expected to witness a compound annual growth rate of around 6% as organizations recognize the value of technology-driven solutions in managing intellectual property disputes, thereby reinforcing the Intellectual Property Litigation Support Services Market.
The Intellectual Property Litigation Support Services Market is experiencing heightened interest in intellectual property valuation. As businesses recognize the intrinsic value of their intellectual assets, they seek expert assistance in assessing and quantifying this value. This trend is particularly evident in merger and acquisition scenarios, where accurate valuation is critical for negotiations. The market for litigation support services is likely to grow as companies require specialized expertise to navigate valuation disputes and ensure fair compensation. Furthermore, the increasing emphasis on intellectual property as a business asset underscores the importance of litigation support services in the Intellectual Property Litigation Support Services Market.
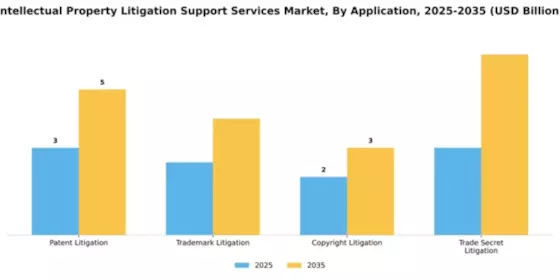
In the Intellectual Property Litigation Support Services Market, Patent Litigation represents the largest share, driven by the increasing complexity and frequency of patent disputes among technology and pharmaceutical companies. Trademark Litigation remains a significant segment as well, showing favorable growth rates due to the rising emphasis on brand protection in an increasingly competitive marketplace. Copyright Litigation and Trade Secret Litigation follow, but with comparatively smaller market footprints. These segments reflect distinct applications of litigation support services tailored to the unique needs and strategies of IP holders.
Patent Litigation (Dominant) vs. Trademark Litigation (Emerging)
Patent Litigation holds a dominant position in the IP Litigation Support Services Market, primarily due to its critical role in safeguarding technological innovations and intellectual achievements, which drive many sectors today. This segment benefits from extensive expertise in technical details and legal precedents, making it essential for contentious patent disputes. On the other hand, Trademark Litigation is emerging rapidly as businesses prioritize brand reputation and consumer recognition. The growth in e-commerce and digital branding necessitates robust trademark protection, propelling firms to seek specialized litigation support. As such, while Patent Litigation remains dominant, Trademark Litigation is gaining importance as companies navigate the complexities of intellectual property law in a digital age.
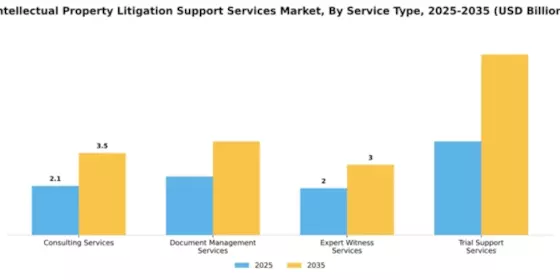
In the Intellectual Property Litigation Support Services Market, Consulting Services represent the largest segment, commanding a significant share through robust demand for strategic insights and expert advice on litigation cases. Document Management Services also hold a meaningful share, providing essential organization and accessibility of legal documents, which is crucial for effective case preparation. Meanwhile, both Expert Witness Services and Trial Support Services, while smaller, play vital roles, with Trial Support Services seeing a surge in interest as firms seek comprehensive assistance during trial proceedings.
Consulting Services (Dominant) vs. Trial Support Services (Emerging)
Consulting Services within the Intellectual Property Litigation Support Services Market stands as a dominant force, characterized by a high demand for specialized legal consultancy that guides firms through complex litigation processes. These services not only provide strategic insights but also encompass risk assessments and compliance advisories. Conversely, Trial Support Services are emerging rapidly, reflecting an increased need for professional backing during trials. This growth is driven by law firms recognizing the value of integrated support, from exhibit preparation to jury consulting, enhancing their ability to navigate challenging legal landscapes successfully.
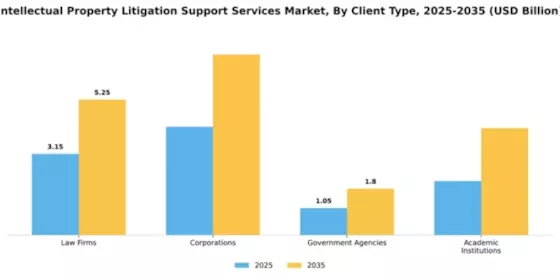
In the Intellectual Property Litigation Support Services Market, Law Firms remain the dominant player, commanding a significant portion of the overall market share. Their established relationships with clients and specialized expertise position them advantageously in this competitive landscape. Corporations, on the other hand, have been progressively increasing their involvement in this sector, benefitting from the rising importance of intellectual property in safeguarding innovations and assets, which reflects a broader trend of corporations actively seeking legal support for litigation matters.
Law Firms: Dominant vs. Corporations: Emerging
Law Firms play a crucial role in the Intellectual Property Litigation Support Services Market, leveraging their deep legal expertise and vast experience in handling complex litigation cases. Their understanding of legal intricacies and client needs allows them to provide tailored support essential for successful outcomes. On the contrary, Corporations are emerging as a significant segment in this market, influenced by the growing emphasis on protecting intellectual assets. As they adapt to a more litigious environment, Corporations increasingly seek specialized litigation support, investing in services that enhance their litigation strategies, thereby shaping their demand for efficient and comprehensive support.
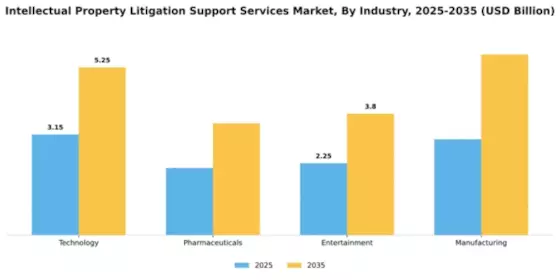
In the Intellectual Property Litigation Support Services Market, the Technology sector holds the largest share, driven by constant innovations and the rapid advancement of digital products and services. The surge in patent filings and litigation in this sector reflects the critical importance of intellectual property rights in technology development. Pharmaceuticals, while currently smaller, have demonstrated rapid growth due to increasing complexities in drug development, patent disputes, and regulatory challenges, positioning it as the fastest-growing segment in the industry.
Pharmaceuticals: Patent Protection (Dominant) vs. Drug Development (Emerging)
In the realm of Pharmaceuticals within the Intellectual Property Litigation Support Services Market, Patent Protection stands as a dominant force, given its essential role in securing exclusive rights for patented drugs and treatments. As the pharmaceutical landscape evolves with new innovations, the need for robust litigation support in protecting these patents only increases. Meanwhile, Drug Development is emerging as a significant area as pharmaceutical companies face increasing scrutiny and high-stakes litigation related to clinical trials, testing protocols, and regulatory compliance. This segment's growth is fueled by heightened competition, rapid technological advancements, and complex global regulatory environments.
Get more detailed insights about Intellectual Property Litigation Support Services Market Request Free Sample
North America continues to lead the Intellectual Property Litigation Support Services market, holding a significant share of 5.25 in 2024. The region's growth is driven by a robust legal framework, increasing patent filings, and a surge in technology-related disputes. Regulatory support and a strong emphasis on IP rights protection further catalyze demand, making it a prime market for litigation support services. The competitive landscape is characterized by the presence of major players such as Deloitte, PwC, and Navigant Consulting. The U.S. stands out as the leading country, with a well-established legal infrastructure and a high volume of IP litigation cases. This environment fosters innovation and attracts investments, ensuring that North America remains at the forefront of IP litigation support services.
Europe's Intellectual Property Litigation Support Services market is on the rise, with a market size of 3.0 in 2024. The region benefits from stringent IP regulations and a growing awareness of intellectual property rights among businesses. Countries like Germany and the UK are witnessing increased demand for litigation support due to a rise in cross-border disputes and technological advancements, driving the market's growth. The competitive landscape features key players such as KPMG and Ernst & Young, who are expanding their services to meet the growing needs of clients. The UK, in particular, is a hub for IP litigation, supported by a strong legal framework. As businesses increasingly recognize the value of IP, the demand for specialized litigation support services is expected to grow significantly.
The Asia-Pacific region is emerging as a significant player in the Intellectual Property Litigation Support Services market, with a size of 2.5 in 2024. The growth is fueled by rapid technological advancements, increasing patent registrations, and a rising number of IP disputes. Countries like China and Japan are leading the charge, supported by government initiatives aimed at enhancing IP protection and enforcement, which are crucial for market expansion. The competitive landscape is evolving, with local firms and international players like FTI Consulting gaining traction. China, in particular, is witnessing a surge in IP litigation cases, driven by its booming tech industry. As awareness of IP rights grows, the demand for litigation support services is expected to rise, positioning Asia-Pacific as a key market in the coming years.
The Middle East and Africa region is gradually developing its Intellectual Property Litigation Support Services market, currently valued at 0.75 in 2024. The growth is primarily driven by increasing foreign investments and a rising awareness of the importance of IP rights among businesses. Governments in countries like South Africa and the UAE are implementing regulations to strengthen IP protection, which is essential for attracting investment and fostering innovation. The competitive landscape is still in its infancy, with a few local firms and international players beginning to establish a presence. South Africa is leading the way in IP litigation, supported by a growing legal framework. As the region continues to develop its IP infrastructure, the demand for litigation support services is expected to increase significantly, presenting opportunities for growth.
The Intellectual Property Litigation Support Services Market is characterized by a dynamic competitive landscape, driven by the increasing complexity of intellectual property (IP) disputes and the growing need for specialized support services. Key players such as Deloitte (GB), Ernst & Young (GB), and FTI Consulting (US) are strategically positioned to leverage their extensive expertise in litigation support, analytics, and technology integration. These firms are focusing on enhancing their service offerings through digital transformation and strategic partnerships, which collectively shape a competitive environment that emphasizes innovation and responsiveness to client needs.The market structure appears moderately fragmented, with a mix of large consulting firms and specialized service providers. Key business tactics include optimizing service delivery through technology and localizing offerings to meet regional demands. The influence of major players is significant, as they set benchmarks for service quality and operational efficiency, thereby impacting the overall market dynamics.In November Deloitte (GB) announced a strategic partnership with a leading AI technology firm to enhance its litigation support capabilities. This collaboration aims to integrate advanced analytics and machine learning into their service offerings, potentially streamlining the litigation process and improving outcomes for clients. Such a move underscores Deloitte's commitment to innovation and positions it favorably in a competitive market increasingly driven by technological advancements.In October FTI Consulting (US) expanded its global footprint by opening a new office in Singapore, aimed at catering to the growing demand for IP litigation support in the Asia-Pacific region. This expansion reflects FTI's strategy to localize its services and tap into emerging markets, which may enhance its competitive edge and client base in a region known for its robust IP landscape. The strategic importance of this move lies in FTI's ability to provide tailored solutions that resonate with local clients, thereby fostering stronger relationships and driving growth.In September Ernst & Young (GB) launched a new suite of digital tools designed to assist clients in navigating complex IP litigation scenarios. This initiative highlights Ernst & Young's focus on digitalization and its intent to provide clients with innovative solutions that enhance decision-making processes. The introduction of these tools may not only improve client satisfaction but also position Ernst & Young as a leader in the integration of technology within the litigation support domain.As of December current competitive trends indicate a pronounced shift towards digitalization, sustainability, and AI integration within the Intellectual Property Litigation Support Services Market. Strategic alliances are increasingly shaping the landscape, as firms recognize the value of collaborative innovation. Looking ahead, competitive differentiation is likely to evolve from traditional price-based competition to a focus on technological innovation, service reliability, and the ability to provide comprehensive, data-driven solutions that meet the nuanced needs of clients.





The Intellectual Property Litigation Support Services Market is projected to grow at a 5.13% CAGR from 2025 to 2035, driven by technological advancements and increasing IP disputes.
New opportunities lie in:
By 2035, the market is expected to be robust, reflecting substantial growth and innovation.
| MARKET SIZE 2024 | 10.5(USD Billion) |
| MARKET SIZE 2025 | 11.04(USD Billion) |
| MARKET SIZE 2035 | 18.2(USD Billion) |
| COMPOUND ANNUAL GROWTH RATE (CAGR) | 5.13% (2025 - 2035) |
| REPORT COVERAGE | Revenue Forecast, Competitive Landscape, Growth Factors, and Trends |
| BASE YEAR | 2024 |
| Market Forecast Period | 2025 - 2035 |
| Historical Data | 2019 - 2024 |
| Market Forecast Units | USD Billion |
| Key Companies Profiled | Deloitte (GB), Ernst & Young (GB), KPMG (GB), PwC (GB), Navigant Consulting (US), Bain & Company (US), AlixPartners (US), FTI Consulting (US), Charles River Associates (US) |
| Segments Covered | Application, Service Type, Client Type, Industry |
| Key Market Opportunities | Integration of advanced analytics and artificial intelligence in Intellectual Property Litigation Support Services Market. |
| Key Market Dynamics | Rising demand for advanced analytics and technology-driven solutions enhances competition in Intellectual Property Litigation Support Services. |
| Countries Covered | North America, Europe, APAC, South America, MEA |
The projected market valuation for the Intellectual Property Litigation Support Services Market in 2035 is 18.2 USD Billion.
The overall market valuation for the Intellectual Property Litigation Support Services Market in 2024 was 10.5 USD Billion.
The expected CAGR for the Intellectual Property Litigation Support Services Market during the forecast period 2025 - 2035 is 5.13%.
In 2024, the segment of Trial Support Services had the highest valuation at 4.0 USD Billion.
The projected valuation for Patent Litigation by 2035 is expected to reach 5.0 USD Billion.
Key players in the market include Deloitte, Ernst & Young, KPMG, PwC, and Navigant Consulting.
The projected valuation for Document Management Services in 2035 is anticipated to be 4.0 USD Billion.
The valuation of Trade Secret Litigation is expected to increase from 3.0 USD Billion in 2024 to 6.2 USD Billion by 2035.
The expected valuation for Corporations in the market by 2035 is projected to be 7.0 USD Billion.
The Technology industry segment is projected to have the highest growth, with a valuation expected to reach 5.25 USD Billion by 2035.


Kindly complete the form below to receive a free sample of this Report

“This is really good guys. Excellent work on a tight deadline. I will continue to use you going forward and recommend you to others. Nice job”


“Thanks. It’s been a pleasure working with you, please use me as reference with any other Intel employees.”


“Thanks for sending the report it gives us a good global view of the Betaïne market.”


“Thank you, this will be very helpful for OQS.”


“We found the report very insightful! we found your research firm very helpful. I'm sending this email to secure our future business.”


“I am very pleased with how market segments have been defined in a relevant way for my purposes (such as "Portable Freezers & refrigerators" and "last-mile"). In general the report is well structured. Thanks very much for your efforts.”


“I have been reading the first document or the study, ,the Global HVAC and FP market report 2021 till 2026. Must say, good info! I have not gone in depth at all parts, but got a good indication of the data inside!”


“We got the report in time, we really thank you for your support in this process. I also thank to all of your team as they did a great job.”


“The Automotive 48V ECU Components Procurement Intelligence Study” was a complex project, but the Market Research Future (MRFR) team handled it with quality, agility, and customer-centricity. They delivered all requested data on time and within the agreed scope. The team, including Shubhendra Anand and Rahul Gotadki, was always readily available to clarify questions and swiftly implement necessary adjustments, driving the project to a successful conclusion within a very demanding timeframe.
I would also like to specifically commend Akshay Agarwal for his responsiveness and support at every stage—from our initial inquiry on May 6th through to final delivery on June 18th. His dedication made the entire process seamless.”



