Japan Electrical Computer Aided Design Market Segmentation
Japan Electrical Computer Aided Design Market By Component (USD Million, 2025-2035)
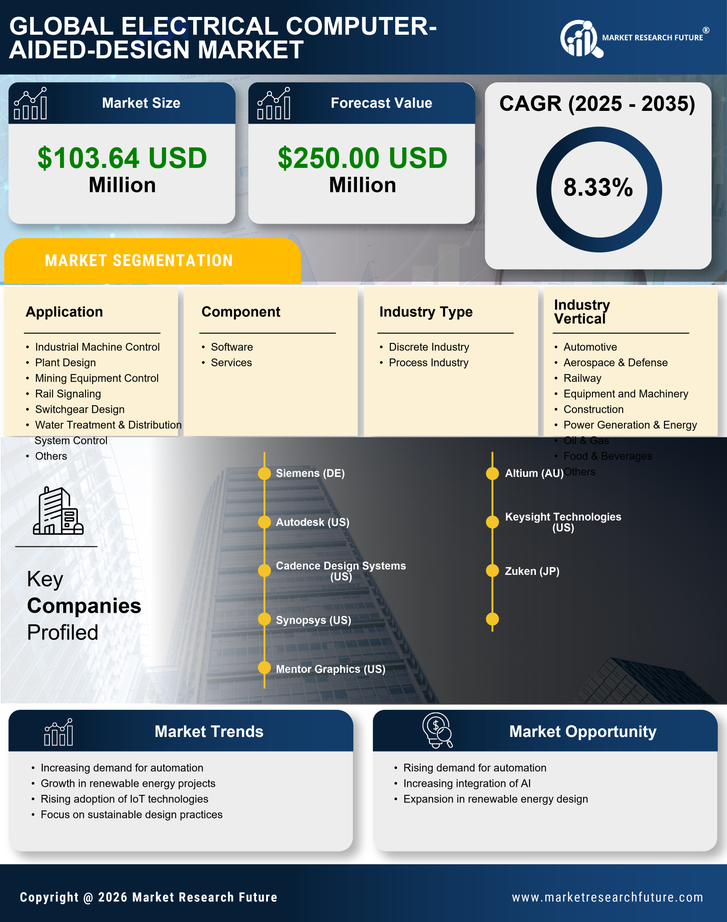
- Software
- Services
Japan Electrical Computer Aided Design Market By Industry Type (USD Million, 2025-2035)
- Discrete Industry
- Process Industry
Japan Electrical Computer Aided Design Market By Application (USD Million, 2025-2035)
- Industrial Machine Control
- Plant Design
- Mining Equipment Control
- Rail Signaling
- Switchgear Design
- Water Treatment & Distribution System Control
- Others
Japan Electrical Computer Aided Design Market By Industry Vertical (USD Million, 2025-2035)
- Automotive
- Japan Electrical Computer Aided Design Market
- Railway
- Equipment and Machinery
- Construction
- Power Generation & Energy
- Oil & Gas
- Food & Beverages
- Others