Request Free Sample ×

Kindly complete the form below to receive a free sample of this Report

* Please use a valid business email

Leading companies partner with us for data-driven Insights

clients tt-cursor
Hero Background

Japan Life Science Analytics Market

ID: MRFR/LS/49371-HCR
200 Pages
Satyendra Maurya
Last Updated: April 24, 2026
Japan Life Science Analytics Market Research Report: Size, Share, Trend Analysis By Types of Analytics (Predictive Analytics, Descriptive Analytics, Prescriptive Analytics), By Applications (Research & Development, Pharmacovigilance, Regulatory Compliance, Sales & Marketing, Supply Chain Optimization), By Component (Software, Services, Hardware), By Deployment Model (On-Premise, Cloud-Based) and By End Users (Hospitals, Clinics, Others) - Growth Outlook & Industry Forecast 2025 To 2035
Download PDF ×

We do not share your information with anyone. However, we may send you emails based on your report interest from time to time. You may contact us at any time to opt-out.

  1. 1 SECTION I: EXECUTIVE SUMMARY AND KEY HIGHLIGHTS
    1. 1.1 EXECUTIVE SUMMARY
      1. 1.1.1 Market Overview
      2. 1.1.2 Key Findings
      3. 1.1.3 Market Segmentation
      4. 1.1.4 Competitive Landscape
      5. 1.1.5 Challenges and Opportunities
      6. 1.1.6 Future Outlook
  2. 2 SECTION II: SCOPING, METHODOLOGY AND MARKET STRUCTURE
    1. 2.1 MARKET INTRODUCTION
      1. 2.1.1 Definition
      2. 2.1.2 Scope of the study
        1. 2.1.2.1 Research Objective
        2. 2.1.2.2 Assumption
        3. 2.1.2.3 Limitations
    2. 2.2 RESEARCH METHODOLOGY
      1. 2.2.1 Overview
      2. 2.2.2 Data Mining
      3. 2.2.3 Secondary Research
      4. 2.2.4 Primary Research
        1. 2.2.4.1 Primary Interviews and Information Gathering Process
        2. 2.2.4.2 Breakdown of Primary Respondents
      5. 2.2.5 Forecasting Model
      6. 2.2.6 Market Size Estimation
        1. 2.2.6.1 Bottom-Up Approach
        2. 2.2.6.2 Top-Down Approach
      7. 2.2.7 Data Triangulation
      8. 2.2.8 Validation
  3. 3 SECTION III: QUALITATIVE ANALYSIS
    1. 3.1 MARKET DYNAMICS
      1. 3.1.1 Overview
      2. 3.1.2 Drivers
      3. 3.1.3 Restraints
      4. 3.1.4 Opportunities
    2. 3.2 MARKET FACTOR ANALYSIS
      1. 3.2.1 Value chain Analysis
      2. 3.2.2 Porter's Five Forces Analysis
        1. 3.2.2.1 Bargaining Power of Suppliers
        2. 3.2.2.2 Bargaining Power of Buyers
        3. 3.2.2.3 Threat of New Entrants
        4. 3.2.2.4 Threat of Substitutes
        5. 3.2.2.5 Intensity of Rivalry
      3. 3.2.3 COVID-19 Impact Analysis
        1. 3.2.3.1 Market Impact Analysis
        2. 3.2.3.2 Regional Impact
        3. 3.2.3.3 Opportunity and Threat Analysis
  4. 4 SECTION IV: QUANTITATIVE ANALYSIS
    1. 4.1 Construction, BY Application (USD Million)
      1. 4.1.1 Drug Discovery
      2. 4.1.2 Clinical Trials
      3. 4.1.3 Genomic Data Analysis
      4. 4.1.4 Sales and Marketing Analytics
      5. 4.1.5 Regulatory Compliance
    2. 4.2 Construction, BY Type (USD Million)
      1. 4.2.1 Descriptive Analytics
      2. 4.2.2 Predictive Analytics
      3. 4.2.3 Prescriptive Analytics
      4. 4.2.4 Cognitive Analytics
    3. 4.3 Construction, BY Deployment Mode (USD Million)
      1. 4.3.1 On-premise
      2. 4.3.2 Cloud-based
      3. 4.3.3 Hybrid
    4. 4.4 Construction, BY End User (USD Million)
      1. 4.4.1 Pharmaceutical Companies
      2. 4.4.2 Biotechnology Companies
      3. 4.4.3 Contract Research Organizations
      4. 4.4.4 Academic Institutions
  5. 5 SECTION V: COMPETITIVE ANALYSIS
    1. 5.1 Competitive Landscape
      1. 5.1.1 Overview
      2. 5.1.2 Competitive Analysis
      3. 5.1.3 Market share Analysis
      4. 5.1.4 Major Growth Strategy in the Construction
      5. 5.1.5 Competitive Benchmarking
      6. 5.1.6 Leading Players in Terms of Number of Developments in the Construction
      7. 5.1.7 Key developments and growth strategies
        1. 5.1.7.1 New Product Launch/Service Deployment
        2. 5.1.7.2 Merger & Acquisitions
        3. 5.1.7.3 Joint Ventures
      8. 5.1.8 Major Players Financial Matrix
        1. 5.1.8.1 Sales and Operating Income
        2. 5.1.8.2 Major Players R&D Expenditure. 2023
    2. 5.2 Company Profiles
      1. 5.2.1 Thermo Fisher Scientific (US)
        1. 5.2.1.1 Financial Overview
        2. 5.2.1.2 Products Offered
        3. 5.2.1.3 Key Developments
        4. 5.2.1.4 SWOT Analysis
        5. 5.2.1.5 Key Strategies
      2. 5.2.2 Abbott Laboratories (US)
        1. 5.2.2.1 Financial Overview
        2. 5.2.2.2 Products Offered
        3. 5.2.2.3 Key Developments
        4. 5.2.2.4 SWOT Analysis
        5. 5.2.2.5 Key Strategies
      3. 5.2.3 Roche Holding AG (CH)
        1. 5.2.3.1 Financial Overview
        2. 5.2.3.2 Products Offered
        3. 5.2.3.3 Key Developments
        4. 5.2.3.4 SWOT Analysis
        5. 5.2.3.5 Key Strategies
      4. 5.2.4 Illumina Inc (US)
        1. 5.2.4.1 Financial Overview
        2. 5.2.4.2 Products Offered
        3. 5.2.4.3 Key Developments
        4. 5.2.4.4 SWOT Analysis
        5. 5.2.4.5 Key Strategies
      5. 5.2.5 PerkinElmer Inc (US)
        1. 5.2.5.1 Financial Overview
        2. 5.2.5.2 Products Offered
        3. 5.2.5.3 Key Developments
        4. 5.2.5.4 SWOT Analysis
        5. 5.2.5.5 Key Strategies
      6. 5.2.6 Agilent Technologies Inc (US)
        1. 5.2.6.1 Financial Overview
        2. 5.2.6.2 Products Offered
        3. 5.2.6.3 Key Developments
        4. 5.2.6.4 SWOT Analysis
        5. 5.2.6.5 Key Strategies
      7. 5.2.7 Merck KGaA (DE)
        1. 5.2.7.1 Financial Overview
        2. 5.2.7.2 Products Offered
        3. 5.2.7.3 Key Developments
        4. 5.2.7.4 SWOT Analysis
        5. 5.2.7.5 Key Strategies
      8. 5.2.8 Bio-Rad Laboratories Inc (US)
        1. 5.2.8.1 Financial Overview
        2. 5.2.8.2 Products Offered
        3. 5.2.8.3 Key Developments
        4. 5.2.8.4 SWOT Analysis
        5. 5.2.8.5 Key Strategies
      9. 5.2.9 Qiagen N.V. (NL)
        1. 5.2.9.1 Financial Overview
        2. 5.2.9.2 Products Offered
        3. 5.2.9.3 Key Developments
        4. 5.2.9.4 SWOT Analysis
        5. 5.2.9.5 Key Strategies
    3. 5.3 Appendix
      1. 5.3.1 References
      2. 5.3.2 Related Reports
  6. 6 LIST OF FIGURES
    1. 6.1 MARKET SYNOPSIS
    2. 6.2 JAPAN MARKET ANALYSIS BY APPLICATION
    3. 6.3 JAPAN MARKET ANALYSIS BY TYPE
    4. 6.4 JAPAN MARKET ANALYSIS BY DEPLOYMENT MODE
    5. 6.5 JAPAN MARKET ANALYSIS BY END USER
    6. 6.6 KEY BUYING CRITERIA OF CONSTRUCTION
    7. 6.7 RESEARCH PROCESS OF MRFR
    8. 6.8 DRO ANALYSIS OF CONSTRUCTION
    9. 6.9 DRIVERS IMPACT ANALYSIS: CONSTRUCTION
    10. 6.10 RESTRAINTS IMPACT ANALYSIS: CONSTRUCTION
    11. 6.11 SUPPLY / VALUE CHAIN: CONSTRUCTION
    12. 6.12 CONSTRUCTION, BY APPLICATION, 2024 (% SHARE)
    13. 6.13 CONSTRUCTION, BY APPLICATION, 2024 TO 2035 (USD Million)
    14. 6.14 CONSTRUCTION, BY TYPE, 2024 (% SHARE)
    15. 6.15 CONSTRUCTION, BY TYPE, 2024 TO 2035 (USD Million)
    16. 6.16 CONSTRUCTION, BY DEPLOYMENT MODE, 2024 (% SHARE)
    17. 6.17 CONSTRUCTION, BY DEPLOYMENT MODE, 2024 TO 2035 (USD Million)
    18. 6.18 CONSTRUCTION, BY END USER, 2024 (% SHARE)
    19. 6.19 CONSTRUCTION, BY END USER, 2024 TO 2035 (USD Million)
    20. 6.20 BENCHMARKING OF MAJOR COMPETITORS
  7. 7 LIST OF TABLES
    1. 7.1 LIST OF ASSUMPTIONS
  8. 7.1.1
    1. 7.2 Japan MARKET SIZE ESTIMATES; FORECAST
      1. 7.2.1 BY APPLICATION, 2025-2035 (USD Million)
      2. 7.2.2 BY TYPE, 2025-2035 (USD Million)
      3. 7.2.3 BY DEPLOYMENT MODE, 2025-2035 (USD Million)
      4. 7.2.4 BY END USER, 2025-2035 (USD Million)
    2. 7.3 PRODUCT LAUNCH/PRODUCT DEVELOPMENT/APPROVAL
  9. 7.3.1
    1. 7.4 ACQUISITION/PARTNERSHIP
  10. 7.4.1

Japan Construction Market Segmentation

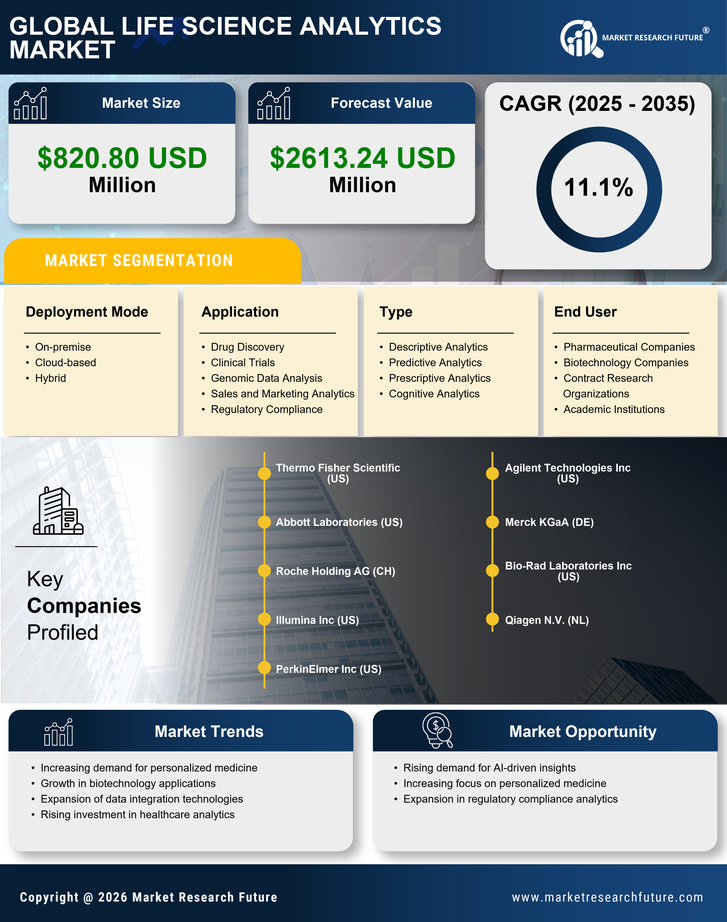
Construction By Application (USD Million, 2025-2035)

  • Drug Discovery
  • Clinical Trials
  • Genomic Data Analysis
  • Sales and Marketing Analytics
  • Regulatory Compliance

Construction By Type (USD Million, 2025-2035)

  • Descriptive Analytics
  • Predictive Analytics
  • Prescriptive Analytics
  • Cognitive Analytics

Construction By Deployment Mode (USD Million, 2025-2035)

  • On-premise
  • Cloud-based
  • Hybrid

Construction By End User (USD Million, 2025-2035)

  • Pharmaceutical Companies
  • Biotechnology Companies
  • Contract Research Organizations
  • Academic Institutions