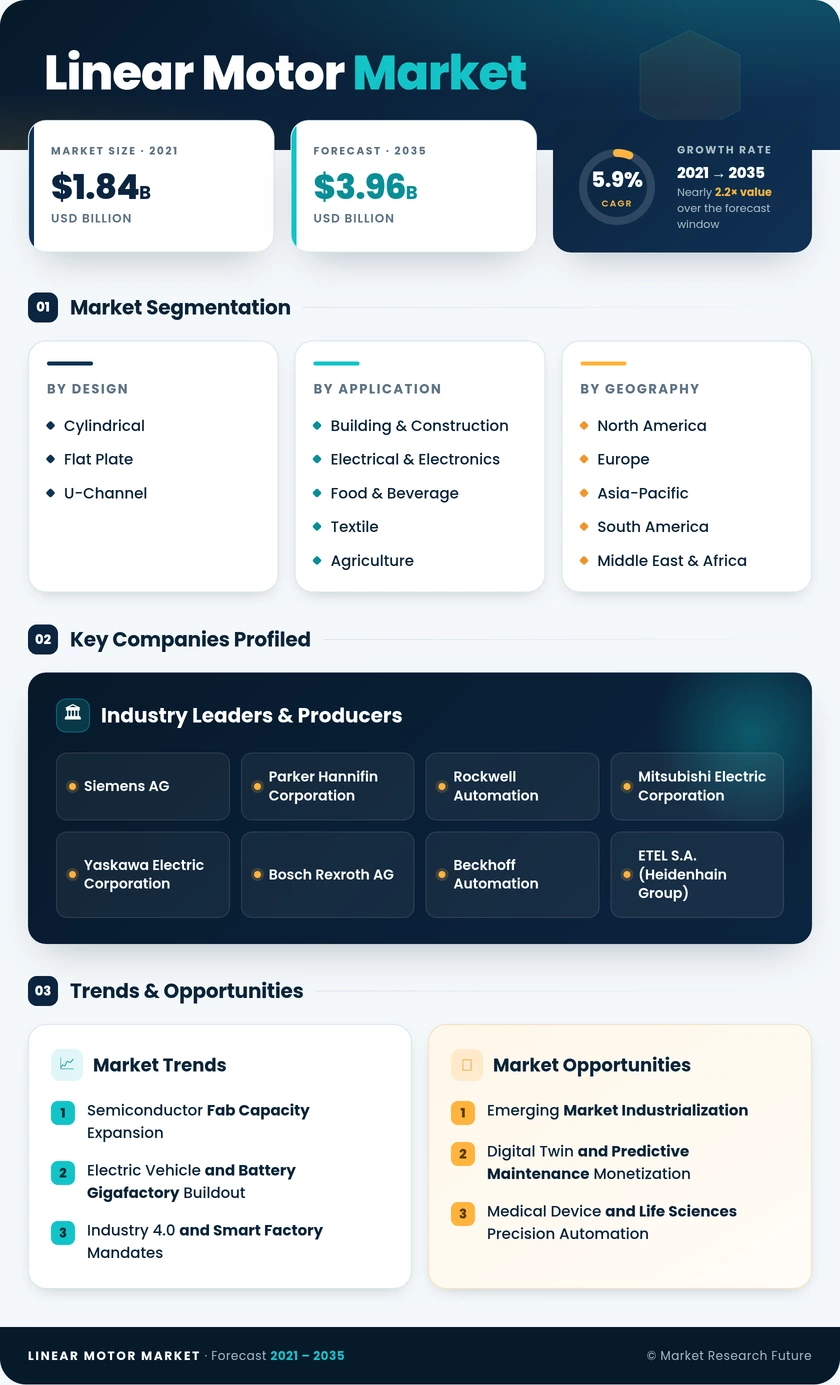
Linear Motor Market (2025 - 2035)

ID: MRFR/SEM/5683-HCR
100 Pages
Ankit Gupta
Last Updated: June 30, 2026
Linear Motor Market Size, Share and Research Report By Design (Flat-bed, U-Channel, and Cylindrical), By Application (Electronics and Assembly, Food & Beverage, Packaging & Labeling, Meteorology, Machine Tools, Printing, Robotics, Semiconductor, Non-Industrial Application, and Others) And By Region (North America, Europe, Asia-Pacific, And The Rest Of The World) –Industry Forecast Till 2035
Linear Motor Market
Market Size
Forecast Period2025-2035
CAGR (2025-2035)5.9%
2025 Market SizeUSD 2.23 Billion
2035 Market SizeUSD 3.96 Billion
Key Players
Siemens AG
Parker Hannifin Corporation
Rockwell Automation
Mitsubishi Electric Corporation
Yaskawa Electric Corporation
Bosch Rexroth AG
Opportunities
  • Emerging Market Industrialization
  • Digital Twin and Predictive Maintenance Monetization
  • Medical Device and Life Sciences Precision Automation
  1. 1 Market Overview |
    1. 1.1 Study Assumptions & Market Definition |
    2. 1.2 Scope of the Study |
    3. 1.3 Research Methodology
  2. 2 Market Summary & Key Takeaways
  3. 3 Market Dynamics |
    1. 3.1 Market Drivers Analysis | |
      1. 3.1.1 Semiconductor Fab Capacity Expansion | |
      2. 3.1.2 Electric Vehicle and Battery Gigafactory Buildout | |
      3. 3.1.3 Industry
    2. 4.0 and Smart Factory Mandates | |
      1. 3.1.4 Advanced Packaging and Chiplet Integration | |
      2. 3.1.5 Growth of Collaborative and Mobile Robotics | |
      3. 3.1.6 Miniaturization in Medical Device Manufacturing | |
      4. 3.1.7 Adoption of Direct-Drive over Legacy Ball-Screw Systems |
    3. 3.2 Market Restraints Analysis | |
      1. 3.2.1 High Upfront Cost of Linear Motor Systems | |
      2. 3.2.2 Thermal Management Complexity | |
      3. 3.2.3 Limited Availability of Skilled Motion Control Engineers | |
      4. 3.2.4 Magnetic Interference in Sensitive Environments | |
      5. 3.2.5 Entrenched Ball-Screw Supply Chains and Vendor Lock-In |
    4. 3.3 Market Opportunity Analysis | |
      1. 3.3.1 Emerging Market Industrialization | |
      2. 3.3.2 Digital Twin and Predictive Maintenance Monetization | |
      3. 3.3.3 Medical Device and Life Sciences Precision Automation | |
      4. 3.3.4 Additive Manufacturing and Hybrid Machine Tools | |
      5. 3.3.5 Reshoring-Driven Retrofit and Upgrade Cycles |
    5. 3.4 Industry Value Chain Analysis |
    6. 3.5 Porter's Five Forces Analysis
  4. 4 Global Linear Motor Market Size & Forecast (2021–2035) |
    1. 4.1 Historical Market Size (2021–2025) |
    2. 4.2 Current & Forecast Market Size (2026–2035) |
    3. 4.3 Market Size by Revenue (USD Billion) |
    4. 4.4 Year-over-Year Growth Analysis
  5. 5 Segmentation Analysis |
    1. 5.1 By Design | |
      1. 5.1.1 Cylindrical | |
      2. 5.1.2 Flat Plate | |
      3. 5.1.3 U-Channel |
    2. 5.2 By Application | |
      1. 5.2.1 Building and Construction | |
      2. 5.2.2 Electrical and Electronics | |
      3. 5.2.3 Food and Beverage | |
      4. 5.2.4 Textile | |
      5. 5.2.5 Agriculture | |
      6. 5.2.6 Automotive | |
      7. 5.2.7 Other Applications
  6. 6 Regional Analysis |
    1. 6.1 North America | |
      1. 6.1.1 United States | |
      2. 6.1.2 Canada | |
      3. 6.1.3 Mexico |
    2. 6.2 Europe | |
      1. 6.2.1 Germany | |
      2. 6.2.2 United Kingdom | |
      3. 6.2.3 France | |
      4. 6.2.4 Italy | |
      5. 6.2.5 Spain | |
      6. 6.2.6 Nordic Countries | |
      7. 6.2.7 Russia | |
      8. 6.2.8 Rest of Europe |
    3. 6.3 Asia-Pacific | |
      1. 6.3.1 China | |
      2. 6.3.2 Japan | |
      3. 6.3.3 South Korea | |
      4. 6.3.4 India | |
      5. 6.3.5 ASEAN | |
      6. 6.3.6 Rest of Asia-Pacific |
    4. 6.4 South America | |
      1. 6.4.1 Brazil | |
      2. 6.4.2 Argentina | |
      3. 6.4.3 Rest of South America |
    5. 6.5 Middle East & Africa | |
      1. 6.5.1 Saudi Arabia | |
      2. 6.5.2 UAE | |
      3. 6.5.3 South Africa | |
      4. 6.5.4 Egypt | |
      5. 6.5.5 Rest of MEA
  7. 7 Competitive Landscape |
    1. 7.1 Market Share Analysis (2025) |
    2. 7.2 Competitive Benchmarking Matrix |
    3. 7.3 Company Profiles | |
      1. 7.3.1 Siemens AG | |
      2. 7.3.2 Parker Hannifin Corporation | |
      3. 7.3.3 Rockwell Automation | |
      4. 7.3.4 Mitsubishi Electric Corporation | |
      5. 7.3.5 Yaskawa Electric Corporation | |
      6. 7.3.6 Bosch Rexroth AG | |
      7. 7.3.7 Beckhoff Automation | |
      8. 7.3.8 ETEL S.A. (Heidenhain Group) | |
      9. 7.3.9 Aerotech Inc. | |
      10. 7.3.10 Kollmorgen (Regal Rexnord)
  8. 8 Future Outlook & Strategic Recommendations (2026–2035) |
    1. 8.1 AI-Integrated Servo Control and Adaptive Motion |
    2. 8.2 Electrification Supercycle and Mobility Transformation |
    3. 8.3 Sustainability and Energy Efficiency Mandates |
    4. 8.4 Modular and Reconfigurable Manufacturing Platforms
  9. 9 Recent Developments & News
  10. 10 Frequently Asked Questions (FAQs)
  11. 11 Report Scope & Methodology |
    1. 11.1 Study Period & Base Year |
    2. 11.2 Data Sources & Citations |
    3. 11.3 Abbreviations
  12. 12 LIST OF TABLES |
  13. TABLE 1 Global Linear Motor Market Size & Forecast, by Revenue (USD Billion), 2021–2035 |
  14. TABLE 2 Global Linear Motor Market – Year-over-Year Growth Analysis, 2021–2035 |
  15. TABLE 3 Driver Impact Analysis – Linear Motor Market, 2026–2035 |
  16. TABLE 4 Restraint Impact Analysis – Linear Motor Market, 2026–2035 |
  17. TABLE 5 Global Linear Motor Market Size, by Design, 2021–2035 (USD Billion) |
  18. TABLE 6 Global Linear Motor Market Size, by Application, 2021–2035 (USD Billion) |
  19. TABLE 7 Global Linear Motor Market Size, by Region, 2021–2035 (USD Billion) |
  20. TABLE 8 North America Linear Motor Market Size, by Country, 2021–2035 (USD Billion) |
  21. TABLE 9 Europe Linear Motor Market Size, by Country, 2021–2035 (USD Billion) |
  22. TABLE 10 Asia-Pacific Linear Motor Market Size, by Country, 2021–2035 (USD Billion) |
  23. TABLE 11 South America Linear Motor Market Size, by Country, 2021–2035 (USD Billion) |
  24. TABLE 12 Middle East & Africa Linear Motor Market Size, by Country, 2021–2035 (USD Billion) |
  25. TABLE 13 Competitive Benchmarking Matrix – Global Linear Motor Market, 2025 |
  26. TABLE 14 Company Profiles – Key Players, Global Linear Motor Market |
  27. TABLE 15 Recent Developments & Strategic Announcements, 2023–2025 |
  28. TABLE 16 North America Linear Motor Market Size, by Design, 2021–2035 (USD Billion) |
  29. TABLE 17 North America Linear Motor Market Size, by Application, 2021–2035 (USD Billion) |
  30. TABLE 18 Europe Linear Motor Market Size, by Design, 2021–2035 (USD Billion) |
  31. TABLE 19 Europe Linear Motor Market Size, by Application, 2021–2035 (USD Billion) |
  32. TABLE 20 Asia-Pacific Linear Motor Market Size, by Design, 2021–2035 (USD Billion) |
  33. TABLE 21 Asia-Pacific Linear Motor Market Size, by Application, 2021–2035 (USD Billion) |
  34. TABLE 22 South America Linear Motor Market Size, by Design, 2021–2035 (USD Billion) |
  35. TABLE 23 South America Linear Motor Market Size, by Application, 2021–2035 (USD Billion) |
  36. TABLE 24 Middle East & Africa Linear Motor Market Size, by Design, 2021–2035 (USD Billion) |
  37. TABLE 25 Middle East & Africa Linear Motor Market Size, by Application, 2021–2035 (USD Billion) |
  38. TABLE 26 Report Scope & Methodology Summary
  39. 13 LIST OF FIGURES |
  40. FIGURE 1 Global Linear Motor Market Dynamics – Drivers, Restraints, and Opportunities |
  41. FIGURE 2 Industry Value Chain Analysis – Linear Motor Market |
  42. FIGURE 3 Porter's Five Forces Analysis – Linear Motor Market |
  43. FIGURE 4 Global Linear Motor Market Size Trend & Forecast (USD Billion), 2021–2035 |
  44. FIGURE 5 Global Linear Motor Market Share, by Design, 2025 (%) |
  45. FIGURE 6 Global Linear Motor Market Share, by Application, 2025 (%) |
  46. FIGURE 7 Global Linear Motor Market Share, by Region, 2025 (%) |
  47. FIGURE 8 North America Linear Motor Market Size Trend (USD Billion), 2021–2035 |
  48. FIGURE 9 Europe Linear Motor Market Size Trend (USD Billion), 2021–2035 |
  49. FIGURE 10 Asia-Pacific Linear Motor Market Size Trend (USD Billion), 2021–2035 |
  50. FIGURE 11 South America Linear Motor Market Size Trend (USD Billion), 2021–2035 |
  51. FIGURE 12 Middle East & Africa Linear Motor Market Size Trend (USD Billion), 2021–2035 |
  52. FIGURE 13 Competitive Landscape – Market Share Analysis, 2025 |
  53. FIGURE 14 Competitive Positioning Map – Key Players, Linear Motor Market

Segmentation Quick Reference

DimensionSub-SegmentsDominant SegmentFastest Growing Segment
By DesignCylindrical, Flat Plate, U-ChannelFlat PlateCylindrical
By ApplicationBuilding & Linear Motor Market, Electrical & Electronics, Food & Beverage, Textile, Agriculture, Automotive, Other ApplicationsElectrical & ElectronicsAutomotive
By GeographyNorth America, Europe, Asia-Pacific, South America, Middle East & AfricaAsia-PacificNorth America


Market Segmentation Overview

By Design

Sub-SegmentKey Trend
CylindricalRising adoption in automotive actuator replacement and compact machine tool axes
Flat PlateDominant in semiconductor lithography, metrology, and high-precision inspection
U-ChannelPreferred for heavy-payload gantry systems and large-format machine tools


Flat Plate linear motors remain the backbone of the precision manufacturing ecosystem, while Cylindrical designs are gaining ground as electric actuator alternatives in automotive and packaging. U-Channel configurations serve niche but high-value heavy-industry applications where payload capacity and structural rigidity are paramount.

By Application

Sub-SegmentKey Trend
Building & Linear Motor MarketLinear motor-driven elevators and escalators for high-rise and smart buildings
Electrical & ElectronicsSemiconductor fab, PCB production, LED sorting, and display manufacturing
Food & BeverageHygienic, contactless conveying for packaging and filling operations
TextileHigh-speed weaving and knitting machines with linear motor warp tension control
AgriculturePrecision seed placement and automated sorting in post-harvest processing
AutomotiveEV battery assembly, powertrain testing, and production line material handling
Other ApplicationsMedical devices, aerospace, defense optics, and scientific research


Electrical and Electronics manufacturing drives the largest share of demand due to the concentration of semiconductor and display fabrication equipment. Automotive applications are expanding rapidly as the EV transition reshapes production infrastructure globally.

By Geography

Sub-SegmentKey Trend
North AmericaCHIPS Act-driven semiconductor reshoring and EV gigafactory investment
EuropeMachine tool leadership in Germany and European Chips Act fab construction
Asia-PacificSemiconductor, display, and robotics manufacturing concentration
South AmericaEarly-stage adoption in food processing and textile sectors
Middle East & AfricaVision 2030 industrial diversification and smart logistics zones


Asia-Pacific dominates global demand through its unmatched semiconductor and electronics manufacturing installed base. North America's growth trajectory reflects the most aggressive government-backed reshoring and incentive programs currently in effect.


 

Download PDF ×

We do not share your information with anyone. However, we may send you emails based on your report interest from time to time. You may contact us at any time to opt-out.