Liquid Nitrogen Market (2025 - 2035)

Liquid Nitrogen Market Research Report: By Storage (Cryogenic Cylinders & Packaged Gas, Tonnage), By Technology (Cryogenic Distillation, Pressure Swing Adsorption), By End-Use Industry (Chemical, Healthcare, Food & Beverages, Foundry) and By Regional (North America, Europe, South America, Asia Pacific, Middle East and Africa) - Forecast to 2035.
ID: MRFR/CnM/1591-HCR
111 Pages
Chitranshi Jaiswal
Last Updated: July 06, 2026
Liquid Nitrogen Market
Market Size
Forecast Period2025-2035
CAGR (2025-2035)4.36%
2024 Market Size16.32(USD Billion)
2025 Market Size17.03(USD Billion)
2035 Market Size26.1(USD Billion)
Key Players
Air Liquide S.A.
Linde plc
Air Products & Chemicals
Taiyo Nippon Sanso
Messer Group
SOL Group
Opportunities
  • Cryogenic Food Processing in Emerging Economies
  • Cell and Gene Therapy Cryopreservation
  • Hydrogen Economy Synergies

Liquid Nitrogen Market Summary

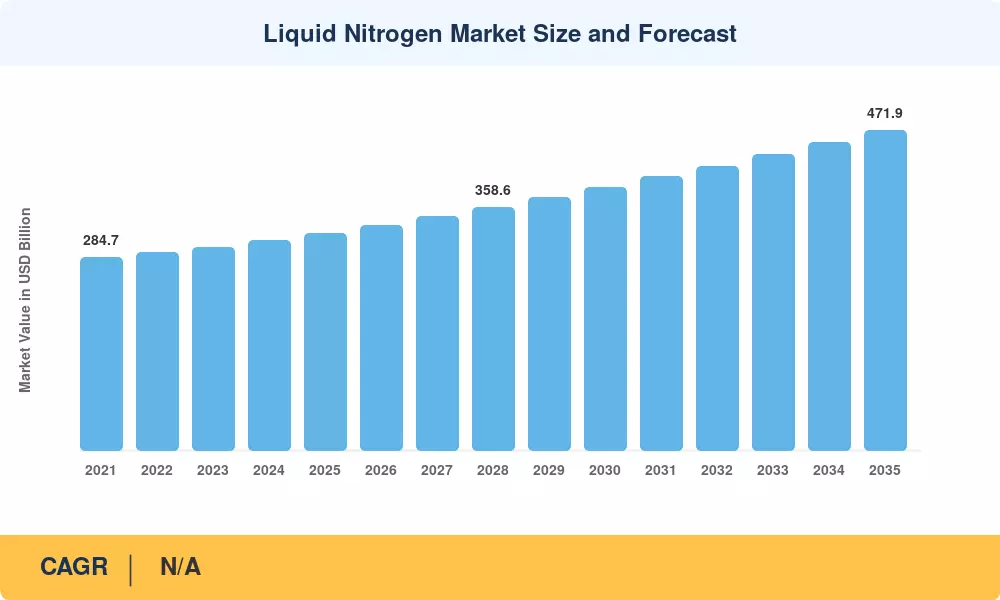
The Liquid Nitrogen Market reached a valuation of USD 319.5 Million in 2025 and is projected to grow from USD 331.5 Million in 2026 to USD 471.9 Million by 2035, expanding at a compound annual growth rate of 4.0% during 2026–2035. Two catalysts anchor this trajectory: accelerating semiconductor fabrication investments across East Asia — where ultra-pure nitrogen atmospheres are non-negotiable — and the global push toward biologics cold-chain infrastructure mandated by evolving WHO and FDA temperature-integrity guidelines [1]. Long-term supply agreements between air-separation-unit operators and anchor customers underpin pricing stability, insulating the Liquid Nitrogen Market from spot-market volatility that periodically rattles other commodity chemicals.

The industry is transitioning away from legacy bulk-delivery logistics toward digitally optimized, application-engineered supply chains. Vertically integrated majors are deploying IoT-enabled tank telemetry and energy-efficient cryogenic plants that reduce delivered cost by an estimated 12–18% compared to 2020 baselines [2]. Policy tailwinds — including the U.S. CHIPS and Science Act's USD 52.7 Billion allocation and the EU Chips Act's EUR 43 Billion target — are pulling forward capacity additions in electronics-grade nitrogen, reshaping the Liquid Nitrogen Market's revenue mix toward higher-margin specialty segments.

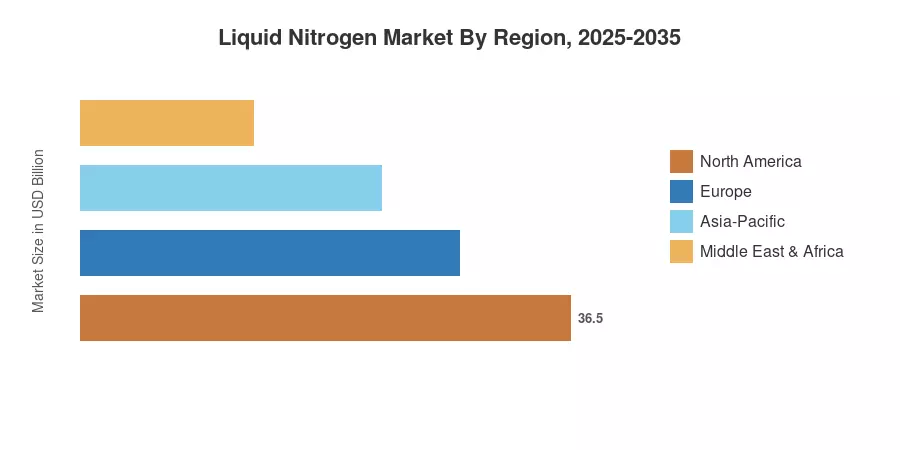
Asia-Pacific commands roughly 49.2% of global revenue, driven by China's semiconductor expansion and India's biologics manufacturing capacity. The region also posts the fastest growth at a 4.7% CAGR through 2035. North America holds the second-largest position with approximately 24.3% share, sustained by outpatient oncology adoption and pharmaceutical logistics modernization. Europe follows at 18.1%, supported by automotive lightweighting and renewable-energy component manufacturing. The Liquid Nitrogen Market is poised for sustained expansion as application complexity deepens across every major consuming sector.


Key Report Takeaways — Liquid Nitrogen Market

By Storage Type

  • Packaged gas accounted for 70.0% of the Liquid Nitrogen Market in 2025, reflecting the dominance of standardized delivery formats across healthcare and laboratory end users.
  • Cylinder storage is forecast to expand at a 4.5% CAGR through 2035, outpacing the overall market as point-of-use deployments in smaller clinical and research facilities proliferate.

By Function

  • Coolant applications commanded 61.5% of the Liquid Nitrogen Market in 2025, anchored by demand from semiconductor wafer processing and pharmaceutical freeze-drying operations.
  • Refrigerant use is advancing at a 5.1% CAGR to 2035, accelerated by regulatory phase-downs of high-GWP synthetic refrigerants under the Kigali Amendment.

By End-User Industry

  • The chemical and pharmaceutical segment represented 28.5% of the Liquid Nitrogen Market in 2025, reflecting nitrogen's role as an inert blanketing agent and cryogenic process enabler.
  • The food and beverage segment is growing fastest at a 5.3% CAGR through 2035, propelled by flash-freezing adoption and modified-atmosphere packaging expansion.

By Region

  • Asia-Pacific led with 49.2% revenue share in 2025 and is forecast to register the highest regional CAGR of 4.7% to 2035.
  • North America contributed approximately USD 77.6 Million in 2025, sustained by robust pharmaceutical cold-chain investments.


Liquid Nitrogen Market Size and Forecast (2021–2035)

Market Research Future employs a triangulated estimation methodology combining top-down industry benchmarking, bottom-up plant-capacity audits, and proprietary trade-flow databases validated against customs and industry-association datasets. Historical figures (2021–2024) are derived from audited company filings and government trade statistics; forecast values (2026–2035) apply econometric demand modeling correlated with GDP growth, semiconductor capex cycles, and cold-chain infrastructure spending [3].
Liquid Nitrogen Market Size and Forecast
Our Impact
Enabled $4.3B Revenue Impact for Fortune 500 and Leading Multinationals
Partnering with 2000+ Global Organizations Each Year
30K+ Citations by Top-Tier Firms in the Industry

Driver Impact Analysis

Driver ~% Impact on CAGR Geographic Relevance Impact Timeline
Semiconductor fabrication expansion +0.9% Asia-Pacific, North America Medium-term (2–4 yr)
Biologics cold-chain mandates +0.7% Global Short-term (≤2 yr)
Kigali Amendment HFC phase-down +0.5% Europe, North America Long-term (≥4 yr)
Flash-freezing adoption in food processing +0.4% Asia-Pacific, Europe Medium-term
EV battery & energy-storage manufacturing +0.3% China, Europe Medium-term
Superconducting infrastructure pilots +0.2% Japan, Germany, US Long-term
On-site ASU deployment by SMEs +0.2% Global Short-term


Semiconductor Fabrication Expansion

Global semiconductor capex reached an estimated USD 190 Billion in 2024 [4], with leading foundries committing multi-year investments in advanced nodes that require nitrogen-blanket atmospheres at every lithographic stage. The U.S. CHIPS Act alone earmarks USD 52.7 Billion in subsidies and tax credits, triggering greenfield fab construction in Arizona, Ohio, and Texas that will convert to recurring nitrogen offtake by 2027–2028. South Korea's K-Semiconductor Strategy and Japan's RAPIDUS initiative add further demand pull, ensuring that the Liquid Nitrogen Market in the electronics segment maintains above-average growth through 2035.

Biologics Cold-Chain Mandates

FDA's 2023 guidance on temperature-controlled distribution of cell and gene therapies — coupled with WHO's expanded prequalification protocols for mRNA vaccines — has pushed biopharma logistics providers to invest heavily in cryogenic infrastructure [5]. An estimated USD 18 Billion in cold-chain capital spending is projected globally between 2025 and 2030, with liquid nitrogen–based dewars and cryo-shippers absorbing a significant share. This regulatory-driven demand is largely inelastic and positions the Liquid Nitrogen Market's pharmaceutical segment as a predictable growth pillar.

Kigali Amendment HFC Phase-Down

The Kigali Amendment to the Montreal Protocol mandates an 80–85% reduction in hydrofluorocarbon consumption in developed countries by 2036 [8]. As food processors, data-center operators, and cold-storage providers search for alternatives to high-GWP synthetic refrigerants, liquid nitrogen emerges as a commercially proven, zero-GWP substitute for rapid cooling and tunnel freezing. European adoption is furthest advanced, with new F-gas regulations effective January 2025 accelerating retrofit activity across the EU's 32,000+ cold-storage facilities.

EV Battery and Energy-Storage Manufacturing

Lithium-ion cell production requires inert-atmosphere processing during electrode coating, electrolyte filling, and formation cycling. With global battery manufacturing capacity projected to exceed 6,000 GWh by 2030 [10], nitrogen consumption per GWh of cell output translates into substantial incremental demand for the Liquid Nitrogen Market, particularly in China's Yangtze River Delta and Europe's battery corridors in Germany, Hungary, and Sweden.


Restraints Impact Analysis

Restraint percentages reflect estimated downward pressure on the overall CAGR. These are independent directional indicators and do not net directly against driver impacts.

Restraint ~% Impact on CAGR Geographic Relevance Impact Timeline
Energy-intensive production costs –0.4% Global Short-term
On-site nitrogen generators displacing merchant supply –0.3% North America, Europe Medium-term
Safety and handling regulatory complexity –0.2% Global Long-term
Transportation and storage infrastructure constraints –0.2% South America, MEA Medium-term
Price deflation from excess ASU capacity –0.1% China Short-term


Energy-Intensive Production Economics

Air-separation units consume approximately 0.4–0.5 kWh per kilogram of liquid nitrogen produced [13]. In regions with rising electricity tariffs — notably parts of Europe where wholesale power prices spiked above EUR 200/MWh during the 2022–2023 energy crisis — production margins compress materially. While integrated majors hedge through long-term power-purchase agreements and co-location with renewable assets, mid-tier operators face margin erosion that limits capacity reinvestment and constrains Liquid Nitrogen Market supply growth.

On-Site Nitrogen Generators Displacing Merchant Supply

Pressure-swing adsorption (PSA) and membrane-based nitrogen generators have improved in purity output (up to 99.999% for premium PSA units) and declined in unit cost by roughly 15% since 2020. Large industrial consumers — particularly in steel, glass, and chemical manufacturing — increasingly install on-site generators to reduce logistics cost and supply-chain risk. Each on-site conversion represents a permanent reduction in merchant Liquid Nitrogen Market volumes, capping growth in the packaged-gas segment among heavy-industry users.

Safety and Regulatory Complexity

Liquid nitrogen's cryogenic temperature (–196 °C) poses asphyxiation and cold-burn hazards that invite stringent regulatory oversight. OSHA's permissible exposure and confined-space rules, combined with evolving EU CLP classification requirements, impose compliance costs that disproportionately burden smaller distributors [15]. In emerging markets where enforcement infrastructure is developing, safety incidents can slow adoption and deter institutional investment in the Liquid Nitrogen Market.


Liquid Nitrogen Market Opportunities

Cryogenic Food Processing in Emerging Economies

Rising disposable income and urbanisation in South-East Asia, the Middle East and sub-Saharan Africa are driving demand for processed, frozen and ready-to-eat meals. Liquid nitrogen tunnel freezers also result in a better quality of product, with less ice crystal formation and higher throughput. They are the premium choice for exporters aiming to meet European and North American retail requirements. Vietnam, Indonesia and Egypt to get new food processing parks during 2026-2030, which might bring significant incremental volume to the Liquid Nitrogen Market


Cell and Gene Therapy Cryopreservation

Today, the global cell and gene therapy pipeline has more than 3,700 active clinical trials [18] that require proven cryogenic storage and transfer of patient-specific biologics. The commercial-scale manufacturing of CAR-T treatments requires controlled-rate freezers and liquid-nitrogen-vapor-phase storage systems, generating a high-margin, specification-driven area of the Liquid Nitrogen Market that is largely immune to commodity-price cyclicality.


Hydrogen Economy Synergies

The large-scale hydrogen liquefaction plants use cryogenic cooling loops, which produce excess nitrogen as a co-product of air separation. The IEA estimates there will be more than 420 GW of electrolyzer capacity by 2035 [19], meaning green hydrogen projects are scaling, and nitrogen supply will grow alongside it, bringing pricing pressure and new distribution channel options for the Liquid Nitrogen Market.


Digital Supply-Chain Monetization

Leading gas suppliers are building IoT-connected telemetry platforms that monitor customer tank levels in real time, enabling predictive replenishment and consumption analytics. These technologies enable subscription-based revenue streams — usage-based pricing, performance dashboards, and safety-compliance reporting — that transform a commodities transaction into a managed-service relationship, raising per-customer ARPU for Liquid Nitrogen Market participants.


Superconducting Power and Quantum Computing Infrastructure

High-temperature superconducting (HTS) cables and quantum-computing dilution refrigerators both rely on liquid-nitrogen pre-cooling stages. Pilot deployments in Essen (Germany), Long Island (US), and Ishikari (Japan) consumed 200–500 tons of liquid nitrogen per kilometer of HTS cable per year [11]. As grid operators and hyperscale data-center firms move from pilots to commercial rollouts post-2030, the Liquid Nitrogen Market will gain a structurally new demand category.


Liquid Nitrogen Market Future Outlook

AI-Driven Supply-Chain Optimization

Artificial intelligence is reshaping industrial-gas logistics. Predictive analytics applied to tank telemetry data enables route optimization and demand forecasting that cut delivery costs by 10–15% for early adopters [21]. As AI models mature, real-time pricing engines will allow Liquid Nitrogen Market suppliers to implement dynamic pricing — adjusting delivered cost based on distance, urgency, and seasonal demand — transforming a commodity business into a differentiated service platform.

Electrification and Clean-Energy Manufacturing Supercycle

The IEA's Net Zero Scenario projects cumulative clean-energy investment of USD 4.5 Trillion annually by 2030 [19]. Wind-turbine blade production, solar-cell encapsulation, and EV battery manufacturing all consume nitrogen at scale. The Liquid Nitrogen Market will benefit as energy-transition capital expenditure accelerates, particularly in regions that combine policy support with manufacturing capacity — notably China, the EU, and the U.S. Gulf Coast.

ESG Reporting and Carbon-Intensity Benchmarking

Industrial-gas producers face mounting pressure from institutional investors and regulatory frameworks (CSRD in the EU, SEC climate-risk disclosure in the US) to quantify and reduce the carbon intensity of their products [22]. Companies that invest in renewable-powered air-separation units and green-electricity procurement will command pricing premiums from ESG-conscious buyers in the Liquid Nitrogen Market, splitting the competitive landscape between sustainability leaders and laggards.

Quantum Computing and Advanced Research Applications

Quantum-computing hardware — from superconducting qubits to photonic systems — requires staged cryogenic cooling, with liquid nitrogen serving as the first-stage coolant in most dilution-refrigerator architectures [11]. As hyperscalers and national laboratories scale quantum programs beyond proof-of-concept, the Liquid Nitrogen Market will gain a small but high-specification demand segment characterized by exacting purity requirements and premium pricing.


Liquid Nitrogen Market Segmentation

By Storage Type

Segment Key Metric Primary Demand Driver
Packaged Gas 70.0% share (2025) Standardized delivery for healthcare and labs
Cylinder 4.5% CAGR (2026–2035) Point-of-use growth in clinics and SMEs


Packaged gas dominates the Liquid Nitrogen Market because it aligns with the bulk-delivery model preferred by hospitals, pharmaceutical manufacturers, and large research institutions. Tanker-to-tank refills on scheduled routes offer economies of scale that cylinder delivery cannot match for high-volume users. Cylinder storage, however, is gaining traction among smaller clinics, university laboratories, and specialty food processors that require flexible, low-commitment supply arrangements. The segment's above-average growth rate reflects the proliferation of decentralized healthcare facilities and artisanal food-production units across both developed and emerging economies.

By Function

Segment Key Metric Primary Demand Driver
Coolant 61.5% share (2025) Semiconductor, pharma freeze-drying
Refrigerant 5.1% CAGR (2026–2035) HFC phase-down, food-sector adoption


Coolant applications anchor the Liquid Nitrogen Market's revenue base, spanning wafer-processing atmospheres, MRI magnet cooling, and controlled-rate cell freezing. Refrigerant use is the faster-growing function thanks to tightening environmental regulations and superior food-quality outcomes in flash-freezing compared to mechanical alternatives. As regulatory timelines under the Kigali Amendment compress, expect refrigerant-function volumes in the Liquid Nitrogen Market to gain share steadily through 2035.

By End-User Industry

Segment Key Metric Primary Demand Driver
Chemical & Pharmaceutical 28.5% share (2025) Inert blanketing, cryogenic processing
Transportation USD 47.3 Million (2025) Cryogenic fuel systems, tire deflashing
Food & Beverage 5.3% CAGR (2026–2035) Flash freezing, MAP packaging
Electronics & Semiconductor USD 54.8 Million (2025) Wafer processing, cleanroom atmospheres
Other End-User Industries 3.4% CAGR (2026–2035) Metal fabrication, construction, research


Chemical and pharmaceutical companies represent the largest single end-user group in the Liquid Nitrogen Market, relying on nitrogen for reactor blanketing, cryogenic grinding, and biologics preservation. The food and beverage sector, meanwhile, is the standout growth story: rising consumer expectations for texture-preserved frozen foods and regulatory mandates for rapid pathogen reduction are driving capital investment in nitrogen-based Individual Quick Freezing (IQF) lines. The Liquid Nitrogen Market's food segment is projected to grow fastest through 2035 as both developed and developing economies tighten food-safety standards.


Regional Market Share Analysis

Region Key Metric Primary Investment Themes
Asia-Pacific 49.2% share (2025) Semiconductor fabs, biologics, food processing
North America USD 77.6 Million (2025) Pharma cold chain, EV battery plants
Europe 18.1% share (2025) F-gas transition, automotive lightweighting
South America 4.8% share (2025) Mining, food exports
Middle East & Africa 3.6% share (2025) Oil & gas, emerging food processing
Total USD 319.5 Million (2025)

The Liquid Nitrogen Market exhibits a pronounced Asia-Pacific concentration, with mature Western markets sustaining steady but slower growth anchored by pharmaceutical and electronics demand.


North America

Country Key Metric Key Driver
US 78.4% of regional share Semiconductor fabs, biopharma logistics [4]
Canada 4.1% CAGR (2026–2035) LNG sector, mining applications
Mexico USD 4.8 Million (2025) Automotive manufacturing, food exports


The United States drives the bulk of North American demand through its combined strength in advanced semiconductor manufacturing, pharmaceutical cold-chain operations, and a well-established network of air-separation units operated by Linde, Air Products, and Air Liquide. Canada's Liquid Nitrogen Market growth is tied to oil-sands enhanced recovery and expanding LNG-terminal infrastructure, while Mexico benefits from nearshoring trends in automotive and aerospace manufacturing that require inert-atmosphere processing [20].

Europe

Country Key Metric Key Driver
Germany 26.3% of regional share Automotive, chemicals, battery corridor
UK 3.9% CAGR (2026–2035) Biopharma, food processing
France USD 8.2 Million (2025) Aerospace, nuclear maintenance
Italy 11.5% of regional share Food processing, metals
Spain 3.7% CAGR (2026–2035) Agriculture, solar manufacturing
Nordic Countries USD 5.1 Million (2025) Fisheries, cleantech
Russia 7.8% of regional share Mining, steel production
Rest of Europe 3.5% CAGR (2026–2035) General industrial expansion


Europe's Liquid Nitrogen Market benefits from stringent F-gas regulations that are shifting commercial refrigeration toward nitrogen-based solutions. Germany's battery manufacturing corridor — stretching from North Rhine-Westphalia to Saxony — generates dedicated nitrogen offtake for electrode production, while the UK's biopharma cluster around the Oxford–Cambridge arc sustains high-specification demand for cryopreservation-grade product [8].

Asia-Pacific

Country Key Metric Key Driver
China 42.5% of regional share Semiconductor, electronics, steel [4]
India 5.2% CAGR (2026–2035) Biologics, food processing
Japan USD 18.4 Million (2025) Superconductors, electronics
South Korea 14.8% of regional share Memory fabs, display manufacturing
ASEAN 4.9% CAGR (2026–2035) Food processing, electronics assembly
Rest of Asia-Pacific USD 6.7 Million (2025) General industrial growth


China's Liquid Nitrogen Market dominance reflects its position as the world's largest semiconductor and electronics manufacturing hub, with over 40 new fab projects announced since 2022 under the National IC Fund's third tranche [4]. India's trajectory is steeper: Hyderabad's Genome Valley and Pune's pharmaceutical cluster are absorbing new cryogenic capacity as biosimilar and vaccine production scales to serve both domestic and export markets [6].

South America

Country Key Metric Key Driver
Brazil 62.3% of regional share Mining, petrochemicals, food exports
Argentina 3.8% CAGR (2026–2035) Agriculture, lithium mining
Rest of South America USD 2.9 Million (2025) General industrial


Brazil's mining and agribusiness sectors generate the majority of South American demand, with liquid nitrogen used in cryogenic grinding of minerals and rapid freezing of protein exports. Argentina's nascent lithium-mining boom — concentrated in Salta and Jujuy provinces — creates incremental demand for inert-atmosphere processing, though volumes in the Liquid Nitrogen Market remain small relative to global totals [16].

Middle East & Africa

Country Key Metric Key Driver
Saudi Arabia 31.2% of regional share Oil & gas, NEOM diversification
UAE 4.3% CAGR (2026–2035) Healthcare, food processing
South Africa USD 2.1 Million (2025) Mining, metals, healthcare
Egypt 4.1% CAGR (2026–2035) Food processing, fertilizer
Rest of MEA 18.7% of regional share General industrial


Saudi Arabia's Vision 2030 diversification program is creating new demand pockets — from NEOM's advanced manufacturing zone to expanded petrochemical complexes at Jubail — while the UAE's healthcare and food-processing sectors are pulling in cryogenic infrastructure as Dubai and Abu Dhabi invest in cold-chain logistics to serve regional re-export markets. Africa's Liquid Nitrogen Market remains nascent but poised for acceleration as South Africa and Egypt modernize pharmaceutical distribution networks [16].


Liquid Nitrogen Market By Region, 2025-2035

Competitive Benchmarking

The Liquid Nitrogen Market exhibits medium concentration. The top five players collectively hold an estimated 55–62% revenue share, reflecting the capital intensity of air-separation-unit operations and the importance of logistics networks in securing long-term supply contracts. Market structure favors vertically integrated majors with global distribution footprints, though mid-tier regional players compete effectively in specialty food processing, laboratory services, and emerging-market geographies where localized service responsiveness outweighs brand scale [23].

Company Est. Revenue Share Range Key Offerings for Liquid Nitrogen Market Strategic Positioning
Air Liquide S.A. ~12–16% Bulk LN2, on-site ASUs, digital telemetry Global leader with integrated engineering arm
Linde plc ~11–15% Merchant LN2, packaged gas, tonnage plants Broadest geographic coverage post-Praxair merger
Air Products & Chemicals ~8–12% Tonnage supply, gasification, hydrogen co-production Strong U.S. and Middle East presence
Taiyo Nippon Sanso (Nippon Gases) ~6–9% Electronics-grade nitrogen, healthcare gases Asia-Pacific and European specialty focus
Messer Group ~4–7% Industrial & specialty gases, on-site solutions European stronghold, growing Americas footprint
SOL Group ~2–4% Medical gases, home-care oxygen, LN2 supply Southern Europe niche with healthcare tilt
Gulf Cryo ~2–3% Bulk and cylinder gases, CO2 recovery Leading independent in GCC region
Buzwair Group ~1–3% Industrial gases, welding products Qatar-based with MEA distribution
Yingde Gases Group ~3–5% Large-scale on-site supply, tonnage plants Dominant China on-site model
Ellenbarrie Industrial Gases ~1–2% Cylinder & bulk supply, specialty mixes Regional India player, growing pharma share


Recent News & Developments


  • Messer Group (August 2023): Launched a digital tank-monitoring platform across its European customer base, enabling predictive replenishment and reducing emergency deliveries by an estimated 25% [21].


  • European Commission (February 2024): Published revised F-gas regulation implementation timelines, accelerating HFC phase-down schedules and indirectly expanding the addressable Liquid Nitrogen Market for refrigeration alternatives [8].


Liquid Nitrogen Market — Report Scope and Methodology

Parameter Detail
Market Scope Global Liquid Nitrogen Market by Storage Type, Function, End-User Industry, and Geography
Study Period 2021–2035
Historical Period 2021–2024
Base Year 2025
Forecast Period 2026–2035
CAGR (2026–2035) 4.0%
2025 Market Size USD 319.5 Million
2035 Market Size USD 471.9 Million
Fastest Growing Segment Food & Beverage (by end-user); Cylinder (by storage type)
Companies Profiled Air Liquide, Linde, Air Products, Taiyo Nippon Sanso, Messer, SOL Group, Gulf Cryo, Buzwair, Yingde Gases, Ellenbarrie
Valuation Currency USD Million
CAGR Driver Disclaimer Driver/restraint impact percentages are directional and not additive to headline CAGR


FAQs

What is the current valuation of the Liquid Nitrogen Market?

As of 2024, the Liquid Nitrogen Market was valued at 16.32 USD Billion.

What is the projected market valuation for Liquid Nitrogen by 2035?

The Liquid Nitrogen Market is projected to reach 26.1 USD Billion by 2035.

What is the expected CAGR for the Liquid Nitrogen Market during the forecast period 2025 - 2035?

The expected CAGR for the Liquid Nitrogen Market during 2025 - 2035 is 4.36%.

Which companies are considered key players in the Liquid Nitrogen Market?

Key players in the Liquid Nitrogen Market include Linde plc, Air Products and Chemicals, Inc., and Air Liquide S.A.

What are the main segments of the Liquid Nitrogen Market?

The main segments of the Liquid Nitrogen Market include Storage, Technology, and End-Use Industry.

What was the valuation of the Storage segment in 2024?

In 2024, the Storage segment of the Liquid Nitrogen Market was valued at 16.0 USD Billion.

How much is the Technology segment projected to be worth by 2035?

The Technology segment is projected to reach a valuation of 26.1 USD Billion by 2035.

What are the projected values for the End-Use Industry segment in 2035?

By 2035, the End-Use Industry segment is projected to be valued at approximately 24.1 USD Billion.

What specific applications are driving the demand for Liquid Nitrogen?
Demand for Liquid Nitrogen is driven by applications in the Chemical, Healthcare, Food & Beverages, and Foundry industries.
What is the expected growth trend for the Cryogenic Cylinders & Packaged Gas segment?
The Cryogenic Cylinders & Packaged Gas segment is expected to grow from 6.5 USD Billion in 2024 to 10.5 USD Billion by 2035.
Author
Author
Author Profile
Chitranshi Jaiswal LinkedIn
Team Lead - Research
Chitranshi is a Team Leader in the Chemicals & Materials (CnM) and Energy & Power (EnP) domains, with 6+ years of experience in market research. She leads and mentors teams to deliver cross-domain projects that equip clients with actionable insights and growth strategies. She is skilled in market estimation, forecasting, competitive benchmarking, and both primary & secondary research, enabling her to turn complex data into decision-ready insights. An engineer and MBA professional, she combines technical expertise with strategic acumen to solve dynamic market challenges. Chitranshi has successfully managed projects that support market entry, investment planning, and competitive positioning, while building strong client relationships. Certified in Advanced Excel & Power BI she leverages data-driven approaches to ensure accuracy, clarity, and impactful outcomes.

Research Approach


Secondary Research

The secondary research process involved comprehensive analysis of regulatory databases, industry safety standards, peer-reviewed engineering journals, and authoritative industrial gas associations. Key sources included the Occupational Safety and Health Administration (OSHA), Environmental Protection Agency (EPA), U.S. Department of Transportation (DOT), Food and Drug Administration (FDA), Chemical Safety Board (CSB), American Society of Mechanical Engineers (ASME), National Institute for Occupational Safety and Health (NIOSH), Compressed Gas Association (CGA), European Industrial Gases Association (EIGA), Cryogenic Society of America, British Cryogenics Council, International Organization for Standardization (ISO), National Fire Protection Association (NFPA), gasworld Business Intelligence, Eurostat Industrial Production Database, U.S. Energy Information Administration (EIA), and National Center for Biotechnology Information (NCBI/PubMed). These sources were used to collect production capacity statistics, safety incident data, regulatory compliance standards (OSHA 1910.101, CGA P-12, ASME Section VIII), air separation unit (ASU) utilization rates, and end-user consumption patterns across cryogenic distillation, pressure swing adsorption, and membrane separation technologies.


Primary Research

To gather both qualitative and quantitative information, the primary research process involved interviewing players from both the supply and demand sides. Executives from industrial gas majors and regional distributors, as well as heads of regulatory affairs and plant managers from air separation plants, were among the supply-side sources. Members of the demand side included plant directors responsible for procurement in the food and beverage industry, leaders of pharmaceutical manufacture, managers of biobanking facilities, engineers specializing in semiconductor fabrication, cryosurgery, and metal fabrication operations. The market segmentation is based on cryogenic grades: cryogenic, industrial, medical/pharmaceutical, food, and research/laboratory. The expansion timelines of ASU were confirmed through primary research. We also learned about the preferences of merchants versus on-site generators, the dynamics of bulk versus packaged gas distribution, and the rates of adoption of cryogenic storage equipment.

Primary Respondent Breakdown:

By Designation: C-level Primaries (32%), Director Level (38%), Others (30%)

By Region: North America (32%), Europe (30%), Asia-Pacific (33%), Rest of World (5%)


Market Size Estimation

Global market valuation was derived through revenue mapping and production volume analysis. The methodology included:

Identification of 40+ key manufacturers across industrial gas majors (Linde, Air Liquide, Air Products, Messer, Taiyo Nippon Sanso), regional independents, and cryogenic vessel/equipment suppliers

Product mapping across cryogenic distillation systems, PSA units, liquid nitrogen grades (Cryogenic, Industrial, Medical, Food, Research), and storage/distribution formats (bulk tanks, microbulk, cylinders/dewars, on-site ASUs)

Analysis of reported and modeled annual revenues specific to liquid nitrogen portfolios, including merchant liquid sales, on-site supply contracts, and packaged gas distribution

Coverage of manufacturers and distributors representing 75-80% of global market share in 2024

Extrapolation using bottom-up (production volume × ASP by country/application) and top-down (manufacturer revenue validation) approaches to derive segment-specific valuations across coolant, refrigerant, cryopreservation agent, and inert gas applications

Integration of capacity utilization data from Air Separation Units (ASUs) and regional energy cost differentials impacting production economics

Download Free Sample

Kindly complete the form below to receive a free sample of this Report

Download PDF ×

We do not share your information with anyone. However, we may send you emails based on your report interest from time to time. You may contact us at any time to opt-out.

















