Manufactured Housing Market (2026 - 2035)

Manufactured Housing Market Size, Share & Industry Analysis Research Report: By House Type (Single-Wide, Double-Wide, Triple-Wide, Park Model), By Construction Material (Wood, Steel, Modular), By Purpose (Residential, Recreational, Commercial), By Size (Small (less than 700 square feet), Medium (700-1,500 square feet), Large (over 1,500 square feet)), By Price Range (Low-Cost (up to $100,000), Medium-Cost ($100,000-$150,000), High-Cost (over $150,000)) and By Regional (North America, Europe, South America, Asia Pacific, Middle East and Africa) - Forecast to 2035.
ID: MRFR/PCM/23209-HCR
111 Pages
Snehal Singh
Last Updated: July 12, 2026
Manufactured Housing Market
Market Size
Forecast Period2026-2035
CAGR (2026-2035)7.50%
2025 Market SizeUSD 26.50 Billion
2035 Market SizeUSD 54.64 Billion
Key Players
Clayton Homes
Skyline Champion Corporation
Cavco Industries
Daiwa House Industry
Sekisui House
ATCO Ltd.
Opportunities
  • Build-to-Rent Community Expansion
  • Accessory Dwelling Unit (ADU) Conversion
  • Disaster-Relief and Emergency Housing Procurement

Manufactured Housing Market Summary

The manufactured housing market was valued at USD 26.50 billion in 2025 and is projected to grow from USD 28.49 billion in 2026 to USD 54.64 billion by 2035, registering a CAGR of 7.50% during the forecast period. This expansion is anchored by a persistent affordability crisis across developed economies, where the average factory-built home costs roughly USD 128,000 before land โ€” a fraction of the USD 315,000-plus price tag attached to conventional site-built construction [1]. The September 2024 HUD code revision, permitting up to four-unit manufactured configurations, has opened a new pathway for workforce housing pipelines and build-to-rent portfolios [2].

Traditional site-built construction continues to lose market share to controlled-environment production methods, which decrease build cycles by 30โ€“50% and material waste by up to 15%. Fannie Mae and Freddie Mac duty-to-serve regulations have opened up secondary-market financing for chattel loans [3], bringing institutional capital into a category that was hitherto exclusive to personal-property lending. In 2024, shipments increased to almost 110,000 units, up around 16% year over year but still far below historical peaks, indicating a lot of untapped potential in the manufactured home business [1].

ย 

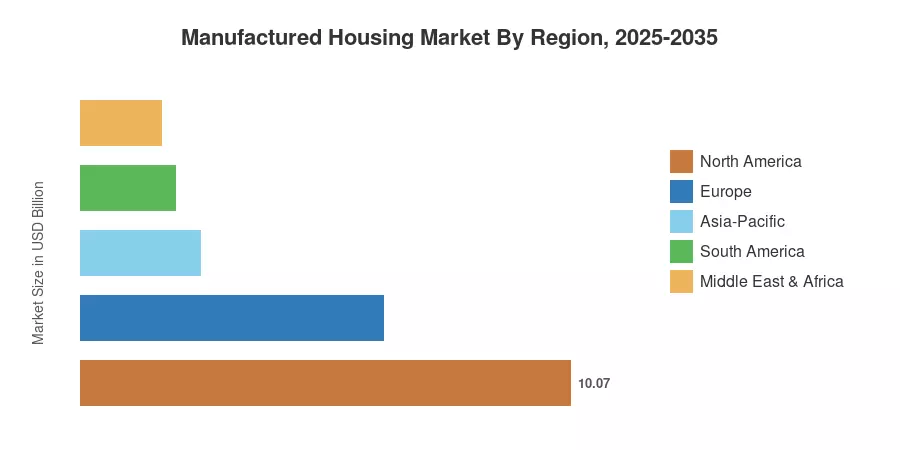
North America has the largest revenue share of 38.0% in 2025, driven by federal incentive schemes and increasing investment in land-lease communities. Asia-Pacific is expected to be the fastest-expanding market for manufactured housing with a CAGR of 9.30% over the forecast period. This growth is attributed to prefabrication targets in China and housing-for-all initiatives in India. Sustainability regulations and volumetric modular uptake in the UK and Scandinavia buoy Europe to the second greatest market share at 23.5%. Over the next decade, manufactured housing is projected to transition from a niche cost-saving alternative to a mainstream pillar of residential supply chains around the world.

ย 

Key Report Takeaways

โ€ข By Structure Type

  • Multi-section units held an estimated 53.2% of the manufactured housing market in 2025, reflecting buyer preference for larger floor plans that rival site-built homes in livable area.
  • Other structure types, including compact and tiny-home configurations, are forecast to grow at a 7.17% CAGR through 2035 as downsizer demand intensifies.

โ€ข By Application

  • Single-family deployments commanded approximately 71.0% of the manufactured housing market size in 2025, underscoring the dominance of owner-occupied and land-lease placements.
  • Multi-family formats are projected to expand at an 8.59% CAGR to 2035, fueled by build-to-rent operators and workforce housing developers.

โ€ข By Material

  • Timber-framed units captured 46.2% of 2025 revenue, benefiting from a mature supply chain and favorable strength-to-weight ratios.
  • Concrete-based systems represent the fastest-growing material category in the manufactured housing market, advancing at an 8.68% CAGR through 2035.

โ€ข By Geography

  • North America generated 38.0% of 2025 revenue in the manufactured housing market, led by the United States' robust community-acquisition pipeline.
  • Asia-Pacific is set to accelerate at a 9.30% CAGR through 2035 on the back of ambitious government prefabrication mandates across China and India.

ย 

Manufactured Housing Market Size and Forecast (2021โ€“2035)

Market Research Future (MRFR)โ€™s forecasting model combines bottom-up manufacturer shipment data, regional permit filing data, trade association statistics from the Manufactured Housing Institute, and proprietary demand indices based on census and HUD databases. Historical numbers are based on real industry data, and predictions for the forecast period are based on the calibrated 7.50% CAGR with adjustments for expected regulatory and macroeconomic changes.
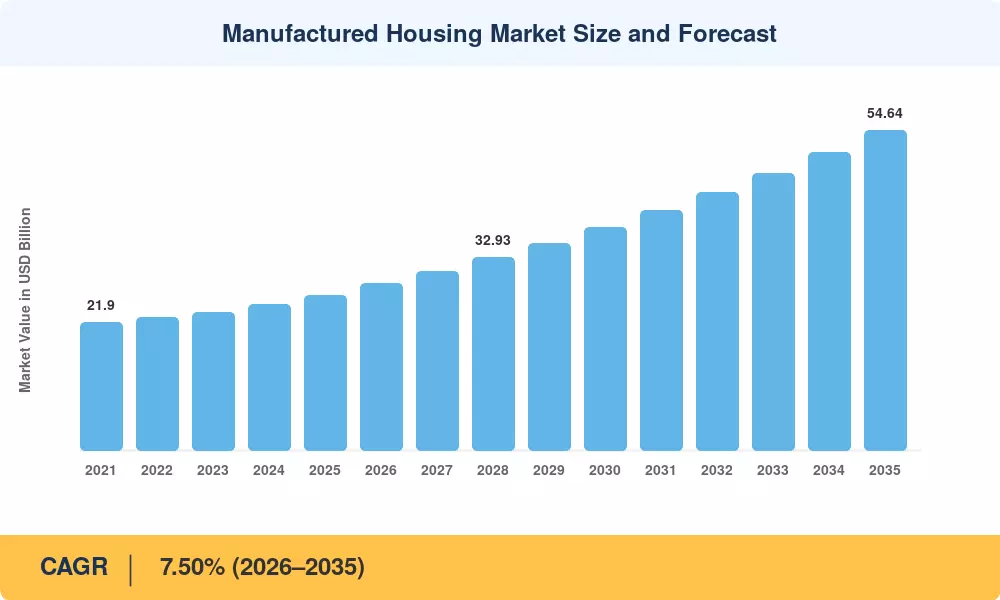
Manufactured Housing Market Size and Forecast
Our Impact
Enabled $4.3B Revenue Impact for Fortune 500 and Leading Multinationals
Partnering with 2000+ Global Organizations Each Year
30K+ Citations by Top-Tier Firms in the Industry

Driver Impact Analysis

Driver ~% Impact on CAGR Geographic Relevance Impact Timeline
Structural housing affordability gap ~22% Global Long-term (โ‰ฅ4 yr)
HUD code modernization (multi-unit) ~18% North America Short-term (โ‰ค2 yr)
GSE duty-to-serve financing mandates ~16% North America Medium-term (2โ€“4 yr)
Government prefabrication mandates ~14% Asia-Pacific Medium-term (2โ€“4 yr)
Institutional capital inflows ~12% North America, Europe Medium-term (2โ€“4 yr)
Speed-to-occupancy advantages ~10% Global Long-term (โ‰ฅ4 yr)
Sustainability and waste-reduction targets ~8% Europe, Asia-Pacific Long-term (โ‰ฅ4 yr)

ย 

Structural Housing Affordability Gap

The gap between median household income and median home prices has widened to a 40-year extreme in the United States, where the National Association of Realtors reported a median existing-home price of USD 407,500 in late 2024 [1]. Factory-produced units priced at roughly USD 128,000 before land deliver a 55โ€“65% cost discount, converting price-sensitive first-time buyers and retirees into a durable demand pool for the manufactured housing market. This affordability lever operates across income bands and geographies, making it the single most influential structural tailwind over the forecast period.

HUD Code Modernization

HUD's September 2024 code update was the most significant regulatory revision in over a decade, lifting the unit-count ceiling from two sections to four-unit configurations [2]. The change allows manufacturers to compete directly in the small multifamily segment โ€” a category previously reserved for stick-built construction. Early adopters have reported 25โ€“30% shorter permitting timelines under the revised code, strengthening the manufactured housing market's position in workforce housing procurement.

GSE Financing Mandates

Fannie Mae's and Freddie Mac's duty-to-serve obligations require each enterprise to facilitate a meaningful volume of manufactured-housing loans annually [3]. This mandate has lowered average interest-rate spreads on chattel loans by approximately 80 basis points since 2022 and expanded the pool of qualifying buyers. The resulting liquidity injection is a medium-term accelerant for the manufactured housing market, with cumulative origination targets expected to exceed USD 15 billion across both GSEs by 2028.

Government Prefabrication Mandates in Asia-Pacific

China's Ministry of Housing targets a 30% prefabrication rate for new urban construction by 2026, creating a policy floor under factory-built volumes in the world's largest construction economy [10]. India's Pradhan Mantri Awas Yojana program aims to deliver 20 million urban housing units by 2025, with increasing allocation to industrialized building methods. These twin mandates position Asia-Pacific as the fastest-growing region for the manufactured housing market over the next decade.

ย 

Restraints Impact Analysis

Impact estimates below follow the same directional methodology described in Section 4 and reflect drag on the headline CAGR rather than absolute market contraction.

Restraint ~% Drag on CAGR Geographic Relevance Impact Timeline
Exclusionary municipal zoning ~โ€“25% North America Long-term (โ‰ฅ4 yr)
Stigma and consumer perception bias ~โ€“20% North America, Europe Long-term (โ‰ฅ4 yr)
Chattel-loan interest-rate premium ~โ€“20% North America Medium-term (2โ€“4 yr)
Transportation and logistics constraints ~โ€“18% Global Medium-term (2โ€“4 yr)
Limited secondary-market resale liquidity ~โ€“17% North America Long-term (โ‰ฅ4 yr)

ย 

Exclusionary Municipal Zoning

Despite federal-level support, an estimated 60% of U.S. municipalities retain zoning ordinances that restrict or outright prohibit manufactured home placements in residential zones [7]. These local barriers fragment the addressable market and force developers into less desirable land parcels, constraining lot supply growth. Bipartisan zoning-reform bills introduced in more than a dozen state legislatures since 2023 have shown incremental progress, but full diffusion remains a multi-year process for the manufactured housing market.

Consumer Perception and Stigma

Legacy associations with lower build quality continue to suppress demand among move-up buyers, even as modern units meet or exceed International Residential Code standards for energy efficiency [15]. Industry-funded consumer education campaigns and the rebranding of "mobile homes" as "manufactured homes" have made headway, yet brand perception surveys still show a 15โ€“20 percentage-point favorability gap relative to traditional site-built homes, creating a ceiling on the manufactured housing market's penetration of middle-income segments.

Chattel-Loan Interest-Rate Premiums

Roughly half of manufactured-home purchases are financed through chattel (personal-property) loans, which carry average rates 200โ€“300 basis points above conventional mortgage rates [3]. The premium reflects both collateral-risk perception and the absence of a deep secondary market for these instruments. While GSE programs are narrowing the spread, the rate differential remains a meaningful hurdle for cost-sensitive buyers and dampens volume growth in the manufactured housing market.

ย 

Manufactured Housing Market Opportunities

Build-to-Rent Community Expansion

Institutional investment in manufactured housing communities has surged as investors seek stable, high-occupancy assets. The "build-to-rent" model, which often integrates land and unit ownership, is becoming a preferred institutional strategy to mitigate the operational complexities of traditional lot-lease models and meet the rising demand for flexible, high-quality rental housing.

ย 

Accessory Dwelling Unit (ADU) Conversion

State-level legislation, such as Californiaโ€™s ADU reform, has transformed the regulatory landscape for secondary dwelling units. Factory-built ADUs are increasingly utilized as a high-speed solution to address regional housing shortages, allowing for efficient infill development on existing residential lots.

ย 

Disaster-Relief and Emergency Housing Procurement

Manufactured housing is becoming a strategic asset for federal and state disaster-recovery agencies. Due to the ability to rapidly deploy units following extreme weather events, government procurement frameworks are shifting toward pre-qualifying manufacturers, creating a more stable and recurring revenue channel for the industry.

ย 

Emerging-Market Urbanization in Southeast Asia and Sub-Saharan Africa

Rapid urbanization in Southeast Asia and Sub-Saharan Africa is creating a substantial need for scalable housing. Conventional construction methods often struggle to meet the speed and budget requirements of these regions, creating opportunities for factory-built housing companies that can localize production and adapt to specific regional demands.

ย 

Digital Sales Platforms and Configurator Technology

Manufacturers are increasingly leveraging digital configurators, virtual walkthroughs, and integrated financial tools to streamline the customer journey. These platforms are effectively reducing the complexity of the sales cycle, lowering customer acquisition costs, and modernizing the buying experience to better align with the expectations of modern consumers.

ย 

Manufactured Housing Market Future Outlook

Automation and Robotics in Factory Production

Robotic framing, automated wiring harnesses, and machine-vision quality inspection are already operational in leading Japanese and Swedish factories, reducing labor content per unit by 20โ€“30% [13]. As these technologies migrate to North American production lines over 2027โ€“2030, unit economics in the manufactured housing market will improve further, enabling manufacturers to absorb rising material costs without proportional price increases.

Net-Zero and Energy-Positive Unit Design

The U.S. Department of Energy's Zero Energy Ready Home program has certified over 4,000 manufactured units since 2021, and the 2024 International Energy Conservation Code raised minimum envelope performance by 10โ€“15% [11]. Manufacturers that integrate rooftop solar, battery storage, and heat-pump HVAC into standard configurations will differentiate on operating-cost savings and capture the growing share of climate-conscious buyers within the manufactured housing market.

Platform-Based Community Operating Models

Private-equity-backed operators are consolidating fragmented community portfolios into technology-enabled platforms that centralize rent collection, maintenance dispatch, and capital planning [6]. This platform approach improves NOI margins by 200โ€“400 basis points and attracts investment-grade debt, reducing capital costs. The professionalization trend positions the manufactured housing market for accelerated institutional adoption through 2035.

ESG Reporting and Green-Bond Financing

The EU Taxonomy for Sustainable Activities and the SEC's proposed climate-disclosure rules are creating standardized frameworks for reporting the environmental footprint of housing production [12]. Manufactured units with verified lower embodied carbon can qualify for green-bond issuance, opening a new capital channel. Early movers in the manufactured housing market that embed lifecycle-assessment data into their product specifications will gain preferential access to sustainability-linked financing.

ย 

Manufactured Housing Market Segmentation

By Structure Type

Segment Metric Primary Demand Driver
Multi-Section Homes 53.2% share (2025) Buyer demand for 1,400+ sq ft floor plans
Single-Section Homes USD 10.38 Billion (2025) Entry-level affordability; lot-size constraints
Other Types (incl. Tiny Homes) 7.17% CAGR (2026โ€“2035) Downsizer demand; ADU conversions

ย 

Multi-section homes dominate the manufactured housing market because they deliver living areas comparable to mid-range site-built homes at a fraction of the cost. These units typically feature three to four bedrooms, pitched rooflines, and drywall interiors that blur the visual distinction from conventional construction. Manufacturers have invested heavily in design options โ€” granite countertops, energy-rated windows, and smart-home wiring โ€” to attract move-up buyers.

Single-section homes remain the workhorse of the entry-level segment, offering a complete dwelling in a single transportable module priced below USD 80,000 in many markets. Their compact footprint makes them ideal for infill lots, retirement communities, and rural placements where transportation logistics favor a single wide-load delivery.

By Application

Segment Metric Primary Demand Driver
Single Family 71.0% share (2025) Owner-occupied and land-lease placements
Multi Family 8.59% CAGR (2026โ€“2035) Build-to-rent and workforce housing

ย 

Single-family applications anchor the manufactured housing market, driven by land-lease communities where residents own the home and rent the lot. The HUD code's new four-unit provision is expected to shift share toward multi-family over the forecast period, as developers can now deploy manufactured duplexes and quadplexes under a single regulatory approval. Multi-family growth is further supported by municipal incentive programs that fast-track permitting for factory-built rental projects.

By Material

Segment Metric Primary Demand Driver
Timber 46.2% share (2025) Mature supply chain; lightweight transport
Metal USD 5.43 Billion (2025) Steel-frame durability; hurricane resistance
Concrete 8.68% CAGR (2026โ€“2035) Fire resistance; multi-story capability
Others 4.8% share (2025) Composite and hybrid systems

ย 

Timber remains the dominant material in the manufactured housing market due to decades of optimized framing processes, wide availability of dimensional lumber, and favorable weight characteristics for highway transport. Concrete-based systems, while heavier and more logistically complex, are gaining ground in multi-story and urban applications where fire rating and acoustic performance are regulatory requirements. Steel-frame construction occupies a middle ground, favored in hurricane-prone markets along the Gulf Coast and in commercial workforce-camp deployments.

ย 

Regional Market Share Analysis

Region Metric (2025) Primary Investment Themes
North America 38.0% share Community acquisitions; GSE financing; ADU legislation
Europe 23.5% share Volumetric modular; net-zero mandates; social housing
Asia-Pacific 9.30% CAGR (2026โ€“2035) Prefabrication mandates; urbanization; affordability
South America USD 1.96 Billion Social housing programs; deficit reduction
Middle East & Africa USD 1.67 Billion Workforce camps; rapid urbanization
Total USD 26.50 Billion โ€”

The manufactured housing market displays significant regional variation, with North America commanding the largest share due to a mature community infrastructure and favorable federal policies. At the same time, Asia-Pacific leads growth on the strength of ambitious industrialized-construction targets.

ย 

North America

Country Metric Key Driver
United States 78.4% of regional share Community investment; HUD code reform
Canada 13.2% of regional share Northern and remote housing programs
Mexico 8.4% of regional share Social housing deficit; INFONAVIT financing

ย 

The United States remains the engine of North America's manufactured housing market, with 22 HUD-approved production facilities operating across the Sun Belt and Southeast corridors [2]. Canadian demand is concentrated in British Columbia and Alberta, where provincial programs subsidize factory-built units for rural and Indigenous communities. Mexico's INFONAVIT system has begun piloting industrialized housing solutions in peri-urban zones surrounding Monterrey and Guadalajara, though regulatory harmonization with HUD-equivalent standards is still in early stages.

Europe

Country Metric Key Driver
Germany 7.52% CAGR Energiewende compliance; timber construction incentives
United Kingdom 27.8% of regional share MMC (Modern Methods of Construction) framework
France USD 0.94 Billion Social housing renovation; RE2020 energy code
Italy 5.9% of regional share Post-earthquake reconstruction programs
Spain 5.4% of regional share Tourism-driven modular hospitality
Nordic Countries 18.6% of regional share Mature volumetric modular industry
Russia 4.1% of regional share Arctic and remote infrastructure
Rest of Europe 11.3% of regional share Mixed regulatory landscape

ย 

Stringent energy-performance regulations and government-backed social housing programs shape Europe's manufactured housing market. The UK's Ministry of Housing designated Modern Methods of Construction as a strategic priority, allocating GBP 1.5 billion to factory-built social housing through its Affordable Homes Programme [19]. Scandinavian countries โ€” particularly Sweden and Finland โ€” operate the most mature volumetric modular industries globally, achieving over 80% factory completion rates for multi-story residential projects.

Asia-Pacific

Country Metric Key Driver
China 34.2% of regional share 30% prefabrication mandate; Five-Year Plan targets
India 9.85% CAGR PMAY affordable housing mission
Japan 22.6% of regional share Seismic resilience; aging housing stock
South Korea 11.3% of regional share Smart city modular integration
ASEAN 8.74% CAGR Urbanization; disaster-resilient construction
Rest of Asia-Pacific 9.1% of regional share Mixed emerging demand

ย 

Asia-Pacific is the fastest-growing region in the manufactured housing market, driven by government mandates and an urbanization wave that will add roughly 500 million new urban residents by 2035 [10]. China's State Council has tied prefabrication adoption to municipal performance evaluations, creating a compliance-driven demand floor. Japan's Sekisui House and Daiwa House have pioneered high-specification factory-built homes that command premium pricing, demonstrating that the manufactured segment can serve upper-middle-income buyers.

South America

Country Metric Key Driver
Brazil 58.3% of regional share Minha Casa Minha Vida program
Argentina 22.1% of regional share Housing deficit; inflation-resilient construction
Rest of South America 19.6% of regional share Incremental industrialization

ย 

Brazil's revitalized Minha Casa Minha Vida social housing program allocated BRL 100 billion in 2024 for low-income housing construction, with an increasing share directed toward industrialized building methods that shorten delivery timelines [20]. The manufactured housing market in South America remains nascent relative to North America and Europe. Still, it benefits from large absolute housing deficits and growing government willingness to adopt factory-built solutions at scale.

Middle East & Africa

Country Metric Key Driver
Saudi Arabia 31.5% of regional share NEOM and Vision 2030 housing targets
UAE 22.8% of regional share Expo-legacy infrastructure; labor camps
South Africa 18.7% of regional share RDP housing backlog
Egypt 14.2% of regional share New Administrative Capital construction
Rest of MEA 12.8% of regional share Workforce housing; humanitarian shelter

ย 

Saudi Arabia's Vision 2030 targets 70% home-ownership by 2030, translating into demand for approximately 1.5 million new housing units [21]. Factory-built methods are gaining traction in mega-projects like NEOM, where construction speed is a critical constraint. Across Sub-Saharan Africa, the manufactured housing market opportunity remains largely untapped. However, international development finance institutions have begun funding pilot programs for scalable factory-built housing in Kenya and Nigeria.

ย 

Manufactured Housing Market By Region, 2025-2035

Competitive Benchmarking

The prefabricated house market is moderately concentrated, with the top five companies expected to account for 55โ€“60% of revenue and a Herfindahl-Hirschman Index of 1,200โ€“1,500. Clayton Homesโ€™ massive scale advantage โ€“ with Berkshire Hathawayโ€™s vertical integration of manufacturing, retail, financing and insurance โ€“ is a huge competitive moat. The rest of the market is filled by mid-cap experts and international players with specific plays.

Company Est. Revenue Share Range Key Offerings Strategic Positioning
Clayton Homes (Berkshire Hathaway) ~18โ€“22% Full-spectrum single- and multi-section homes; captive financing (21st Mortgage, Vanderbilt) Vertically integrated from factory to consumer.
Skyline Champion Corporation ~10โ€“13% Multi-section homes, park-model RVs, and the ADU product line Dual-brand strategy targeting value and mid-tier
Cavco Industries ~8โ€“11% Factory-built homes; commercial modular structures West and Southwest regional leader
Daiwa House Industry ~5โ€“7% Prefabricated steel and timber homes; commercial facilities Technology leader in Japanese precision manufacturing
Sekisui House ~4โ€“6% High-specification factory-built residences; urban infill Premium-segment positioning with global expansion
ATCO Ltd. ~3โ€“5% Workforce housing; modular space solutions Resource-sector and remote-site specialist
Nobility Homes ~2โ€“3% Single- and multi-section homes for the Florida market Regional niche with company-owned retail
Modulaire Group ~2โ€“4% Modular buildings for education, healthcare and commercial European leasing and rental-fleet model
Champion Home Builders ~3โ€“5% Value-priced single-section homes; regional distribution High-volume value positioning
Algeco Scotsman ~2โ€“3% Temporary and permanent modular buildings Pan-European modular leasing network

ย 

ย 

Recent News & Developments

ย 

  • Skyline Champion Corporation (January 2025): Completed acquisition of Regional Enterprises' four manufacturing plants in the Midwest, adding 8,000 floors per year of production capacity to the manufactured housing market [6].

ย 

ย 

  • Fannie Mae (April 2024): Expanded MH Advantageยฎ eligibility criteria to include homes with carports and covered porches, broadening the qualifying inventory for conventional-rate financing [3].

ย 

ย 

ย 

Manufactured Housing Market Report Scope

Parameter Detail
Market Scope Global manufactured housing market covering factory-built residential units compliant with HUD or equivalent national standards
Study Period 2021โ€“2035
Historical Period 2021โ€“2024
Base Year 2025
Forecast Period 2026โ€“2035
CAGR 7.50% (2026โ€“2035)
Market Size (2025) USD 26.50 Billion
Market Size (2035) USD 54.64 Billion
Fastest Growing Segment Concrete-based systems (by material); Multi-family (by application)
Companies Profiled 10 (Clayton Homes, Skyline Champion, Cavco Industries, Daiwa House, Sekisui House, ATCO, Nobility Homes, Modulaire Group, Champion Home Builders, Algeco Scotsman)
Valuation Currency USD Billion

ย 

ย 

FAQs

How do chattel-loan underwriting standards differ from conventional mortgage requirements for manufactured homes?
Chattel loans treat the home as personal property, requiring higher down payments (typically 10โ€“20%) and shorter amortization periods of 15โ€“20 years compared to 30-year mortgages [16]. CrossMod-designated homes can qualify for conventional rates under MH Advantageยฎ programs.
What wind-zone and thermal-zone ratings should procurement teams verify before specifying units?
HUD assigns wind zones I through III and thermal zones 1 through 3 based on installation location [2]. Specifying the correct combination ensures code compliance and warranty validity.
How does the resale depreciation curve for manufactured homes compare to that of site-built properties?
Homes on owned land typically appreciate at 3โ€“5% annually, comparable to site-built residences, while chattel-titled units on leased lots may depreciate 2โ€“3% per year [15].
What insurance considerations are unique to manufactured housing community operators?
Operators need specialized portfolio policies covering windstorm peril, transport-in-transit damage, and vacant-lot liability โ€” coverages rarely bundled in standard commercial property packages [4].
How do CrossMod homes differ from standard HUD-code units in terms of appraisal treatment?
CrossMod homes meet both HUD standards and selected IRC site-built criteria, enabling them to receive real-property appraisals rather than personal-property valuations [3]. This classification unlocks lower financing rates.
What lead times should developers expect from order placement to site delivery?
Typical production cycles run 8โ€“14 weeks, with an additional 2โ€“4 weeks for transportation and site preparation, totaling roughly 10โ€“18 weeks from order to occupancy [4].
How are energy-performance standards evolving for the manufactured housing market beyond 2026?
DOE's proposed 2026 energy rule targets a 30% efficiency gain over current baselines, requiring upgraded insulation, windows, and HVAC systems that will add an estimated USD 3,000โ€“5,000 per unit [11]. ย  ย 
Author
Author
Author Profile
Snehal Singh LinkedIn
Manager - Research
High acumen in analyzing complex macro & micro markets with more than 6 years of work experience in the field of market research. By implementing her analytical skills in forecasting and estimation into market research reports, she has expertise in Packaging, Construction, and Equipment domains. She handles a team size of 20-25 resources and ensures smooth running of the projects, associated marketing activities, and client servicing.

Research Approach

Secondary Research

The secondary research process involved comprehensive analysis of regulatory databases, industry publications, government housing statistics, and authoritative construction organizations. Key sources included the US Department of Housing and Urban Development (HUD), Federal Housing Finance Agency (FHFA), US Census Bureau Manufactured Housing Survey, Bureau of Labor Statistics (BLS), National Conference of State Legislatures (NCSL), Manufactured Housing Institute (MHI), National Association of Home Builders (NAHB), National Association of Realtors (NAR), European Modular Construction Association (EMCA), UK National Housing Federation, Japan Prefabricated Construction Suppliers and Manufacturers Association (JPSA), Australian Bureau of Statistics (ABS), Statistics Canada, UN-Habitat, World Bank Urban Development Indicators, International Labour Organization (ILO) Construction Statistics, and national housing ministry reports from key markets. These sources were used to collect shipment statistics, regulatory compliance data, construction cost indices, demographic trends, zoning regulation changes, and market landscape analysis for single-wide, double-wide, triple-wide, and park model housing units across wood, steel, and modular construction materials.

Primary Research

In order to gather both qualitative and quantitative insights, supply-side and demand-side stakeholders were interviewed during the primary research process. CEOs, VPs of Manufacturing Operations, regulatory compliance officers, and sales directors from manufacturers of manufactured homes, component suppliers, and modular construction companies were examples of supply-side sources. Property developers, managers of community parks, dealers of prefabricated homes, mortgage lenders that specialize in chattel finance, and procurement leads from authorities overseeing affordable housing, recreational vehicle parks, and commercial construction companies were examples of demand-side sources. In addition to gathering information on land-lease dynamics, funding accessibility, and regional adoption patterns, primary research verified production capacity schedules and validated market segmentation.

Primary Respondent Breakdown:

By Designation: C-level Primaries (28%), Director Level (32%), Others (40%)

By Region: North America (42%), Europe (22%), Asia-Pacific (24%), Rest of World (12%)

Market Size Estimation

Global market valuation was derived through revenue mapping and unit shipment analysis. The methodology included:

Identification of 50+ key manufacturers across North America, Europe, Asia-Pacific, and Latin America

Product mapping across single-wide, double-wide, triple-wide, and park model categories

Analysis of reported and modeled annual revenues specific to manufactured housing portfolios

Coverage of manufacturers representing 75-80% of global market share in 2024

Extrapolation using bottom-up (unit shipments ร— ASP by country) and top-down (manufacturer revenue validation) approaches to derive segment-specific valuations

Download Free Sample

Kindly complete the form below to receive a free sample of this Report

Download PDF ×

We do not share your information with anyone. However, we may send you emails based on your report interest from time to time. You may contact us at any time to opt-out.
















