Medical Carts Market (2026 - 2035)

Medical Carts Market Research Report By Type (Medication Carts, Emergency Carts, Anesthesia Carts, Procedure Carts), By Material (Metal, Plastic, Wood), By Configuration (Mobile Carts, Wall-Mounted Carts, Stationary Carts), By End Use (Hospitals, Nursing Homes, Ambulatory Surgical Centers, Home Healthcare) and By Regional (North America, Europe, South America, Asia Pacific, Middle East and Africa) - Growth & Industry Forecast 2025 To 2035
ID: MRFR/MED/5967-HCR
200 Pages
Vikita Thakur, Rahul Gotadki
Last Updated: July 12, 2026
Medical Carts Market
Market Size
Forecast Period2026-2035
CAGR (2026-2035)11.08%
2025 Market SizeUSD 3.99 Billion
2035 Market SizeUSD 12.18 Billion
Key Players
Ergotron
Capsa Healthcare
Omnicell
Enovate Medical
Harloff
JACO Inc.
Opportunities
  • AI-Enabled Smart Cart Platforms
  • Telehealth-Ready Mobile Workstations
  • Emerging-Market Greenfield Deployments

Medical Carts Market Summary

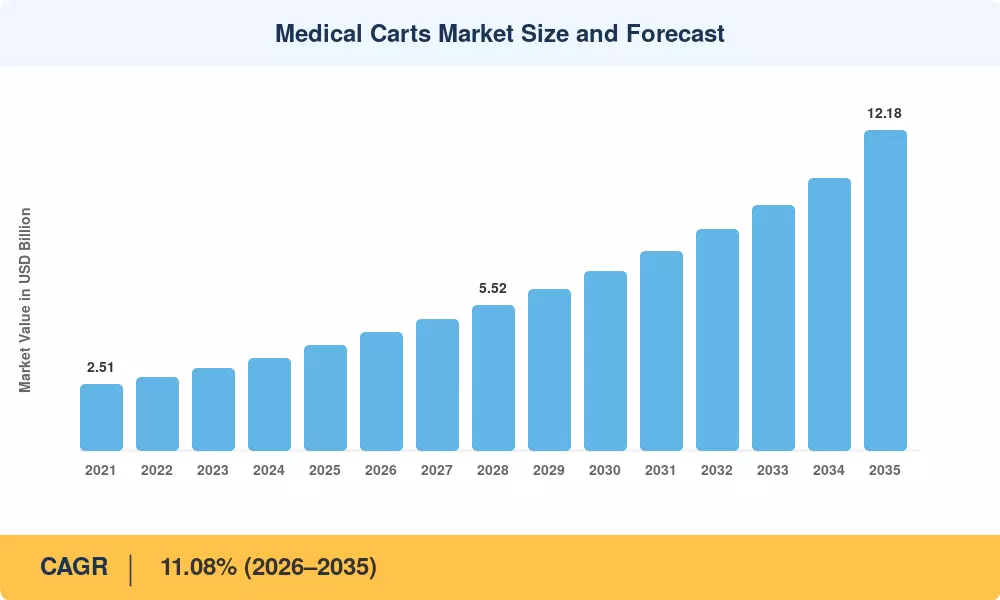
The Medical Carts Market was valued at USD 3.99 billion in 2025 and is projected to reach USD 4.49 billion by 2026, growing to USD 12.18 billion by 2035 at a CAGR of 11.08% during 2026–2035. This expansion is driven by the accelerating digitization of hospital utility carts and the integration of electronic health records into bedside nursing cart workflows. Capital investment from health systems prioritizing value-based reimbursement models — estimated at over USD 38 billion globally in clinical IT infrastructure through 2028 — is reshaping procurement strategies for medication dispensing carts and mobile workstation for clinicians platforms[2].

Likewise, there is a migration from manual traditional supply carts and paper-based systems of medication tracking to networked, sensor-equipped crash cart emergency equipment with real-time inventory management and traceability facilitated by RFID. In 2024, the U.S. Department of Health and Human Services gave USD 1.7 billion in grants to modernize hospitals, with a significant chunk of the funding going to point-of-care recording platforms built around mobile workstations for clinicians' designs [3]. EU Battery Regulation 2023/1542 is also boosting the engineering bar for powered cart platforms across European sites.


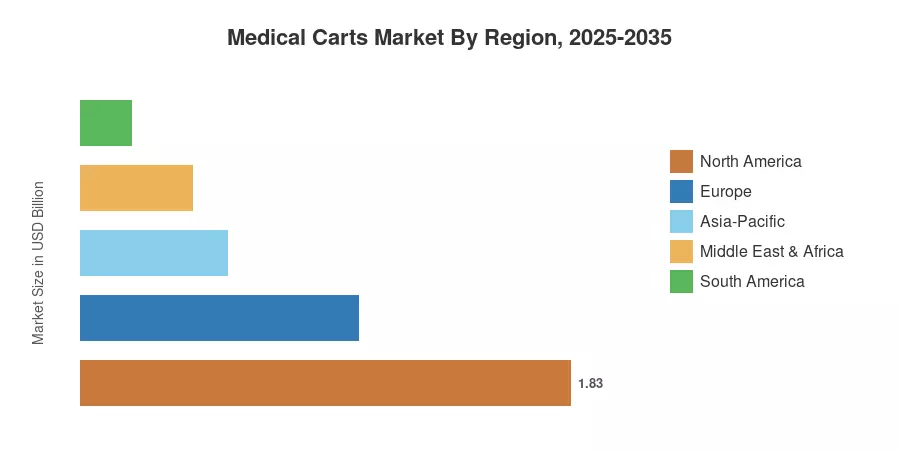
The Market for Medical Carts in North America is estimated to account for ~45.89% of the Market, driven by the acute-care expenditure in the U.S. and Canada. The Asia-Pacific region is the fastest-growing region with a CAGR of 13.82%. The construction boom in hospitals in India, China and the ASEAN countries drives this growth. Europe is the second greatest share with about 26% of worldwide sales, driven by digitalization efforts at the NHS and Germany’s Hospital Future Act As staff shortages continue to increase worldwide, the demand for automated medicine dispensing carts and ergonomic bedside nursing cart solutions will increase more rapidly until 2035.


Key Report Takeaways

• By Cart Type

  • Emergency carts captured 43.78% of the Medical Carts Market share in 2025, reflecting sustained demand for crash cart emergency equipment in acute-care and trauma settings
  • Workstations-on-wheels are the fastest-expanding category, growing at a 13.08% CAGR through 2035 as the adoption of mobile workstations for clinicians deepens

• By Power Source

  • Non-powered hospital utility carts accounted for 56.31% of the Medical Carts Market in 2025, remaining dominant in resource-constrained facilities
  • The powered variants are projected to post the highest CAGR through 2035

• By End User

  • Hospitals represented 55.87% of end-user revenue in 2025, though ambulatory surgical centers are expanding at a 12.85% CAGR
  • The Medical Carts Market in Asia-Pacific is on track for a 13.82% CAGR, outpacing all other regions through 2035


Medical Carts Market Size and Forecast (2021–2035)

Market Research Future (MRFR) uses a unique research methodology to bring to light the market sizing of the Healthcare Asset Management Market. The analysis is based on a two-step process, which comprises primary and secondary research. Historical numbers (2021–2024) are based on actual trade volumes; the 2026–2035 prediction is based on a bottom-up model with facility-level adoption rates for pharmaceutical dispensing carts and mobile workstation for clinicians platforms.
Medical Carts Market Size and Forecast
Our Impact
Enabled $4.3B Revenue Impact for Fortune 500 and Leading Multinationals
Partnering with 2000+ Global Organizations Each Year
30K+ Citations by Top-Tier Firms in the Industry

Driver Impact Analysis

Driver ~% Impact on CAGR Geographic Relevance Impact Timeline
EHR mandate compliance & digitization ~22% Global Short-term (≤2 yr)
Workforce shortage mitigation via automation ~18% North America, Europe Medium-term (2–4 yr)
Medication safety & barcode scanning regulations ~16% North America Short-term (≤2 yr)
Hospital construction boom in Asia-Pacific ~14% Asia-Pacific Long-term (≥4 yr)
Telemedicine & hybrid care model expansion ~12% Global Medium-term (2–4 yr)
Infection control & antimicrobial surface standards ~10% Europe, North America Short-term (≤2 yr)
Value-based reimbursement model transition ~8% North America Long-term (≥4 yr)


EHR Mandate Compliance and Clinical Digitization

The 21st Century Cures Act in the United States and the European Health Data Space regulation are compelling hospitals to embed real-time EHR access at every patient touchpoint. Mobile workstation for clinicians platforms — essentially workstations-on-wheels equipped with barcode scanners and biometric login — have become the primary vehicle for bedside documentation. CMS reported that 96% of non-federal acute-care hospitals now use certified EHR systems, driving a direct replacement cycle for legacy bedside nursing cart configurations that lack integrated computing capability [3][5].

Workforce Shortage and Automation-Driven Procurement

Structural labor deficits continue to heavily dictate hospital procurement strategies across the globe. Projections highlighted by the American Hospital Association (AHA) indicate that the United States could face an acute systemic shortfall of up to 124,000 physicians and 200,000 nurses by 2033. To mitigate this operational strain, hospital administrators are prioritizing automated clinical infrastructure. Automated medication dispensing cabinets and point-of-use carts optimize workflows by reducing manual nursing hand-offs, significantly minimizing the frequency of preventable medication administration errors, and directly liberating clinical staff to focus on direct bedside patient care. This optimization focus is driving advanced international design trends; health systems in pioneering digital regions are actively testing autonomous mobile robots (AMRs) that physically interface with centralized hospital utility and linen carts, transforming baseline inpatient hospital logistics into a semi-autonomous workflow.


Medication Safety Regulations

The FDA's Drug Supply Chain Security Act requires serialized tracking of pharmaceuticals at the unit level by 2027. Medication dispensing carts equipped with RFID readers and automated locking mechanisms are increasingly specified in hospital formulary management plans. Barcode-assisted closed-loop medication administration has demonstrated a 54% reduction in wrong-dose events across 340 surveyed U.S. hospitals [6][12].

Hospital Construction in Emerging Economies

Public infrastructure mandates across emerging economies are serving as the primary volume growth engines for the medical equipment and utilities market through 2035. In India, the Ayushman Bharat initiative has systematically targeted the establishment and structural upgrading of 150,000 primary Ayushman Bharat Health and Wellness Centers (AB-HWCs) nationwide, with each facility requiring a standardized baseline of emergency crash carts, diagnostic instruments, and care delivery supplies. Simultaneously, China’s 14th Five-Year Plan has directed substantial regional and national public health funding toward comprehensive county-level hospital modernization and high-quality development programs. These synchronized government spending initiatives directly accelerate the large-scale procurement of baseline hospital utility carts, mobile workstations, and powered medication dispensing systems throughout the Asia-Pacific territory.


Restraints Impact Analysis

The restraint percentages are directional and represent headwinds that temper overall Medical Carts Market expansion. They do not subtract directly from the headline CAGR.

Restraint ~% Drag on CAGR Geographic Relevance Impact Timeline
High upfront capital cost of powered carts ~−15% Global Short-term (≤2 yr)
Cybersecurity vulnerability of connected devices ~−12% North America, Europe Medium-term (2–4 yr)
Supply chain disruption for specialty components ~−10% Global Short-term (≤2 yr)
Lengthy hospital procurement cycles ~−8% Europe, MEA Long-term (≥4 yr)
Battery lifecycle and disposal regulations ~−6% Europe Medium-term (2–4 yr)


Capital Cost Barriers

A fully configured, powered medication dispensing cart with integrated computing can cost USD 8,000–15,000 per unit, compared to USD 1,200–3,500 for a baseline non-powered equivalent. For a 500-bed hospital refreshing its operational point-of-care asset footprint (typically maintaining a rolling pool of 100 to 150 clinical carts across active shifts), the total capital outlay can easily scale past USD 1.5 to 2.2 million. This significant investment curve strains procurement budgets within public health sectors across South America and Sub-Saharan Africa. This deep pricing differential explains why basic, non-powered hospital utility carts continue to command more than half of global unit shipments across emerging regional healthcare systems.


Cybersecurity Risks in Connected Cart Platforms

Connected mobile workstations for clinicians operate on hospital Wi-Fi networks that face an estimated 82% incidence rate of IoT-related cyberattacks, according to Ponemon Institute research. Each cart running Windows-embedded or Linux-based operating systems becomes a potential attack surface for ransomware. The FDA's 2023 cybersecurity guidance for medical devices now requires premarket submissions to include a software bill of materials, adding regulatory complexity and cost [11][18].

Specialty Component Supply Constraints

Medical-grade lithium-iron-phosphate batteries, antimicrobial polymer housings, and pharmaceutical-grade locking mechanisms are sourced from a limited supplier base concentrated in East Asia. Lead times for battery packs stretched to 18–22 weeks during 2023, forcing cart manufacturers to carry higher inventory or delay orders — a dynamic that constrains near-term growth in the Medical Carts Market [15].


Medical Carts Market Opportunities

AI-Enabled Smart Cart Platforms

The integration of computer vision and natural language processing (NLP) into bedside nursing cart systems automates supply replenishment alerts, tracks clinician hand-hygiene compliance, and supports real-time clinical decision-making. Operational pilots leveraging AI-driven inventory tracking modules embedded within automated medication dispensing systems have demonstrated up to a 30% reduction in workflow inefficiencies and medication retrieval errors, significantly mitigating clinical supply chain bottlenecks.


Telehealth-Ready Mobile Workstations

Hybrid care models blending in-person and virtual consultations demand mobile workstations for clinicians that are pre-equipped with high-definition cameras, noise-canceling microphones, and secure video-conferencing software. Following the initial pandemic spike, global telemedicine utilization has stabilized at structural rates approximately 38 times higher than pre-2019 baselines, creating a durable, long-term demand channel for workstation OEMs who can offer modular, plug-and-play telemedicine capabilities.


Emerging-Market Greenfield Deployments

Developing healthcare infrastructure in nations such as Indonesia, Nigeria, and Vietnam is expanding acute-care capacity from scratch, allowing hospital systems to leapfrog older, static cart designs entirely. Hospital utility carts specified for these markets emphasize modular architecture, tropicalized battery chemistries resilient to fluctuating power grids, and a lower total cost of ownership (TCO). Reflecting this global surge, the broader medical carts market is projected to expand significantly, driven heavily by these geographic expansions.


Cart-as-a-Service Subscription Models

Several OEMs are piloting operating-expense models where hospitals pay a monthly per-cart fee covering hardware, software updates, battery replacement, and preventive maintenance. This approach lowers the capital barrier identified in Section 5 and aligns cart procurement with value-based reimbursement cycles [10].

Data Monetization via Clinical Analytics

Aggregated, de-identified workflow data captured by mobile workstations for clinicians — such as medication administration timestamps, nurse rounding frequency, and supply consumption patterns — can be licensed to pharmaceutical companies, insurers, and population-health analytics firms. This revenue stream diversifies OEM business models beyond hardware margins [19].


Medical Carts Market Future Outlook

AI-Augmented Clinical Cart Ecosystems

By 2030, an estimated 40% of newly shipped medication dispensing carts will embed edge-computing modules running predictive analytics for drug-interaction alerts, supply forecasting, and nurse-workflow optimization. These capabilities will transform hospital utility carts from passive furniture into active clinical decision nodes, supported by partnerships between cart OEMs and health-IT platforms[19].

Electrification and Battery Innovation

Advanced power management architectures remain a critical variable in mobile workstation procurement. The transition toward smart Lithium Iron Phosphate ($LiFePO_4$) chemistries and sophisticated hot-swappable battery management systems (BMS) has successfully extended continuous powered cart runtimes beyond traditional constraints. This allows clinical teams to seamlessly bridge multi-shift rotations without system downtime, actively converting the legacy installed base of non-powered medical carts into fully powered, digital endpoints.


Sustainability and Circular-Economy Mandates

The EU Battery Regulation 2023/1542 requires manufacturers to disclose carbon footprints and ensure minimum recycled-content thresholds for lithium-based battery packs used in medical devices. Cart OEMs are responding with modular designs that allow battery-pack swaps and end-of-life recycling, aligning with hospital ESG reporting requirements now tracked by 67% of large U.S. health systems [9][22].

Convergence of Telemedicine and Bedside Platforms

The boundaries between traditional mobile workstations and dedicated telehealth infrastructure continue to blur. Mobile carts have become the primary physical endpoint for remote specialist consultations, continuous patient monitoring, and digital triage workflows. This deep intersection between physical hardware and remote care networks is generating sustained, high-growth demand for advanced, camera-ready bedside platforms across the global healthcare ecosystem.


Medical Carts Market Segmentation

By Cart Type

Segment Key Metric Primary Demand Driver
Anesthesia Carts 10.62% CAGR Surgical volume growth and OR standardization
Emergency Carts 43.78% share (2025) Trauma care protocols, crash cart emergency equipment mandates
Procedure Carts USD 0.48 Billion (2025) Outpatient procedure expansion
Medication Carts 11.85% CAGR Barcode-verified medication dispensing carts
Others (incl. WOWs) 13.08% CAGR Mobile workstation for clinicians' EHR access


Emergency carts — commonly referred to as crash cart emergency equipment — dominate the Medical Carts Market by revenue because regulatory standards (AHA, ERC) mandate their presence in every acute-care unit, operating room, and emergency department. Replacement cycles average 5–7 years, and the shift toward smart crash carts with automated medication tracking is lifting average selling prices by 18–22% compared to traditional configurations.

Workstations-on-wheels (WOWs) represent the fastest-growing segment as health systems prioritize mobile workstations for clinicians capable of real-time EHR documentation, barcode scanning, and telemedicine connectivity. A single 400-bed hospital may deploy 80–120 WOWs, creating substantial per-facility revenue opportunities for OEMs offering integrated computing and ergonomic design [3].

By Power Source

Segment Key Metric Primary Demand Driver
Powered Carts 12.05% CAGR Computing integration, battery technology advances
Non-Powered Carts 56.31% share (2025) Cost sensitivity, low-acuity settings


Non-powered hospital utility carts maintain a majority share because they serve a vast installed base in clinics, long-term care facilities, and resource-constrained hospitals where electrical infrastructure is limited. Powered variants, however, are gaining ground rapidly as medication dispensing carts, mobile workstations for clinicians, and telemedicine-equipped bedside nursing cart platforms all require onboard power for computing, barcode scanning, and display functionality.

By Material

Segment Key Metric Primary Demand Driver
Aluminum USD 0.52 Billion (2025) Lightweight portability for bedside nursing cart use
Stainless Steel 60.04% share (2025) Durability, infection control and autoclave compatibility
Polymer/Composite 12.28% CAGR Weight reduction, antimicrobial properties
Others USD 0.07 Billion (2025) Specialty alloys for crash cart emergency equipment


Stainless steel remains the material of choice for hospital utility carts in high-acuity environments because of its chemical resistance and ease of decontamination. Polymer and composite materials are growing fastest, driven by OEMs seeking to reduce cart weight — a critical factor for bedside nursing cart ergonomics — while incorporating antimicrobial additives that inhibit biofilm formation.

By End User

Segment Key Metric Primary Demand Driver
Hospitals 55.87% share (2025) Largest installed base, highest acuity requirements
Ambulatory Surgical Centers 12.85% CAGR Outpatient volume migration
Specialty Clinics USD 0.31 Billion (2025) Oncology, dialysis, and infusion therapy expansion
Others 9.74% CAGR Home health, long-term care, and military field medicine


Hospitals account for the largest share of the Medical Carts Market because they deploy the widest variety of cart types — from crash cart emergency equipment in emergency departments to medication dispensing carts in pharmacies and mobile workstations for clinicians at nursing stations. Ambulatory surgical centers represent the fastest-growing end-user channel, as outpatient surgical volumes in the United States have risen by 6.4% annually since 2019, driving demand for compact procedure carts and powered bedside nursing cart configurations.


Regional Market Share Analysis

Region Key Metric Primary Investment Themes
North America 45.89% share (2025) EHR integration, medication safety mandates
Europe USD 1.04 Billion (2025) NHS digitization, EU MDR compliance
Asia-Pacific 13.82% CAGR (2026–2035) Hospital construction, universal health coverage
South America USD 0.19 Billion (2025) Public hospital modernization
Middle East & Africa 10.48% CAGR (2026–2035) Greenfield Hospital builds medical tourism
Total USD 3.99 Billion (2025)

The Medical Carts Market exhibits a clear hierarchy: North America leads on installed base and per-bed spending, while Asia-Pacific drives the fastest volume growth. Europe remains the second-largest revenue pool, buoyed by regulatory standardization across the EU. South America and the Middle East & Africa represent smaller but rapidly developing opportunity zones for hospital utility carts and crash cart emergency equipment.


North America

Country Key Metric Key Driver
United States 78.4% of regional share CMS incentive programs, VA hospital modernization
Canada 12.91% CAGR Provincial digital health mandates
Mexico USD 0.06 Billion IMSS hospital expansion program


North America's dominance in the Medical Carts Market reflects the region's mature acute-care infrastructure and aggressive adoption of medication dispensing carts. The U.S. Veterans Affairs system alone operates 1,298 healthcare facilities undergoing a multi-year capital refresh, with bedside nursing cart replacements accounting for an estimated 8% of total equipment spend. Canada's Ontario Health mandate requiring barcode-verified medication administration in all public hospitals by 2027 is accelerating procurement of powered mobile workstations for clinicians' platforms across the province [3][6].

Europe

Country Key Metric Key Driver
Germany USD 0.28 Billion Hospital Future Act digital investment
United Kingdom 22.6% of regional share NHS modernization and crash cart standardization
France 11.38% CAGR Ségur de la Santé digital health fund
Italy USD 0.09 Billion PNRR healthcare infrastructure allocation
Spain 10.72% CAGR Regional health system consolidation
Nordic Countries USD 0.08 Billion Advanced single-payer digital integration
Russia 9.85% CAGR Federal hospital equipment renewal program
Rest of Europe USD 0.11 Billion EU Medical Device Regulation compliance


The EU Medical Device Regulation (MDR 2017/745) has tightened conformity-assessment requirements for powered hospital utility carts, favoring established OEMs with the resources to navigate extended certification timelines. Germany's Hospital Future Act allocated EUR 4.3 billion for digital infrastructure, directly stimulating demand for connected medication dispensing carts and bedside nursing cart platforms equipped with clinical decision-support software [9][17].

Asia-Pacific

Country Key Metric Key Driver
China 32.7% of regional share 14th Five-Year Plan hospital upgrades
India 15.21% CAGR Ayushman Bharat facility expansion
Japan USD 0.14 Billion Super-aging population, robotics integration
South Korea 13.44% CAGR K-Health digital hospital initiative
ASEAN USD 0.11 Billion Medical tourism and private hospital growth
Rest of Asia-Pacific 12.67% CAGR Rural health infrastructure investment


Asia-Pacific represents the fastest-growing corridor for the Medical Carts Market, propelled by large-scale hospital construction and government-backed universal health coverage programs. India's target of 150,000 health and wellness centers by 2030 creates baseline demand for crash cart emergency equipment and non-powered hospital utility carts. Japan's super-aging demographics — with over 30% of the population above age 65 — are driving the adoption of ergonomic, height-adjustable mobile workstations for clinicians to reduce musculoskeletal strain on nursing staff [7][14].

South America

Country Key Metric Key Driver
Brazil 58.3% of regional share SUS public hospital modernization
Argentina 10.15% CAGR Provincial health digitization programs
Rest of South America USD 0.04 Billion Private hospital chain expansion


Brazil's Unified Health System (SUS) serves 150 million citizens. It is undergoing a phased equipment refresh that includes crash cart emergency equipment, medication dispensing carts, and basic bedside nursing cart units for primary-care facilities. Limited foreign-exchange reserves and import tariffs on medical-grade electronics remain headwinds for powered cart adoption across the region [16].

Middle East & Africa

Country Key Metric Key Driver
Saudi Arabia 34.1% of regional share Vision 2030 healthcare city projects
UAE 11.92% CAGR Medical tourism and JCI accreditation
South Africa USD 0.03 Billion NHI rollout and public hospital upgrades
Egypt 10.58% CAGR Universal health insurance system expansion
Rest of MEA USD 0.04 Billion NGO-funded rural facility equipping


Saudi Arabia's NEOM and King Faisal Medical City projects are specifying a next-generation mobile workstation for clinicians' platforms with integrated telemedicine capability. The UAE's push for JCI accreditation across all public and private hospitals mandates standardized crash cart emergency equipment configurations, creating a regulatory pull for international OEMs entering the Medical Carts Market in the Gulf [14][20].


Medical Carts Market By Region, 2025-2035

Competitive Benchmarking

The Medical Carts Market is moderately concentrated, with the top five companies collectively accounting for an estimated 38–45% of the revenue share. The competition is major diversified medical device companies and specialized cart OEMs. Innovation in modular design, cybersecurity and battery technology differentiates leaders as price rivalry heats up in the non-powered hospital utility carts industry. Estimated Herfindahl-Hirschman Index: 650-850, indicating a fragmented yet consolidating terrain.

Company Est. Revenue Share Range Key Offerings for Medical Carts Market Strategic Positioning
Ergotron ~8–11% StyleView mobile workstation for clinicians, powered carts Ergonomic design leader
Capsa Healthcare ~7–10% Avalo medication dispensing carts, CareLink Mid-range hospital utility carts
Omnicell ~6–9% XT Series automated dispensing, analytics platform Pharmacy automation integration
Enovate Medical ~5–8% e850 mobile workstation, Envoy telemedicine carts Height-adjustable, telehealth-ready
Harloff ~4–7% Crash cart emergency equipment, anesthesia carts Stainless-steel durability focus
JACO Inc. ~3–6% EVO bedside nursing cart, UltraLite series Lightweight polymer carts
Advantech (DLoG) ~3–5% AMiS computing carts, point-of-care terminals Embedded computing specialist
AFC Industries ~2–4% Ergonomic wall-mount and mobile workstations Value-segment positioning
Medline Industries ~2–4% Broad hospital utility carts portfolio, distribution scale GPO contract leverage
TouchPoint Medical ~2–4% Powered bedside nursing cart, AccessRx dispensing Infection control emphasis


Recent News & Developments


  • FDA (September 2023): Published updated cybersecurity guidance requiring premarket submissions for connected medical devices — including powered medication dispensing carts — to include a software bill of materials [11].
  • EU Commission (August 2023): Enacted Battery Regulation 2023/1542, imposing carbon-footprint disclosure and recycled-content minimums on lithium-based packs used in medical carts across the European market [17].


Medical Carts Market Report Scope

Parameter Detail
Market Scope Global Medical Carts Market covering hospital utility carts, medication dispensing carts, mobile workstations for clinicians, crash cart emergency equipment, bedside nursing carts, and specialty procedure carts
Study Period 2021–2035
CAGR 11.08% (2026–2035)
Market Size (2025) USD 3.99 Billion
Market Size (2035) USD 12.18 Billion
Fastest Growing Segment Workstations-on-Wheels (by cart type); Asia-Pacific (by region)
Companies Profiled 10 (Ergotron, Capsa Healthcare, Omnicell, Enovate Medical, Harloff, JACO Inc., Advantech, AFC Industries, Medline Industries, TouchPoint Medical)
Valuation Currency USD Billion


FAQs

What cybersecurity certifications should procurement teams require for connected medical carts?
Look for IEC 62443 compliance and UL 2900-2-1 certification, which validate network-hardened device security. Vendors that provide a current software bill of materials per the FDA's 2023 guidance offer the strongest post-market vulnerability management [11].
How do Cart-as-a-Service pricing models compare with outright purchase?
Subscription models typically run USD 250–400 per cart per month, bundling hardware, battery swaps, and software updates. Over five years, the total cost can be 10–15% higher than the purchase price, but the approach eliminates large capital outlays [10].
Which battery chemistry delivers the best shift-life for powered Medical Carts Market platforms?
Lithium-iron-phosphate offers 8–12 hours per charge with a 2,000+ cycle lifespan. Solid-state alternatives reaching commercialization by 2029 promise 16+ hours, making them the preferred choice for facilities operating extended shifts [21].
What infection-control surface standards apply to hospital utility carts in the EU?
Point-of-care mobile carts must maintain high chemical and surface integrity under harsh, repeated sterilization protocols. Cart structures should be specified utilizing chemical-resistant medical-grade polymers (e.g., ISO 10993/UL 94 V-0 certified custom thermoplastics), non-porous powder-coated metals, or 304/316 medical-grade stainless steel to prevent degradation, micro-pitting, and bacterial biofilm adhesion during exposure to rigorous EPA-approved disinfectants.  
How are ambulatory surgical centers reshaping the Medical Carts Market product mix?
ASCs prioritize compact, lightweight procedure carts over full-size crash cart emergency equipment. OEMs are responding with modular designs that scale from three to six drawers, optimizing footprint for outpatient operating suites [7].
What interoperability standards matter most when integrating a mobile workstation for clinicians with existing HIS?
HL7 FHIR R4 and IHE PCD-01 profiles ensure seamless data exchange between cart-mounted devices and hospital information systems. Vendors supporting these standards reduce integration timelines from months to weeks [3].
Which emerging markets offer the highest near-term growth for the Medical Carts Market?
Rapid expansion across emerging economies is driven heavily by comprehensive national health modernization schemes. In India, massive near-term procurement opportunities are guided by the ongoing PM-ABHIM (Pradhan Mantri Ayushman Bharat Health Infrastructure Mission) infrastructure development, which channels vast capital investments into expanding dedicated Critical Care Hospital Blocks and advanced integrated public health facilities nationwide.    
Author
Author
Author Profile
Vikita Thakur LinkedIn
Senior Research Analyst
She holds an experience of about 5+ years in market research and business consulting projects for sectors such as life sciences, medical devices, and healthcare IT. She possesses a robust background in data analysis, market estimation, competitive intelligence, pipeline analysis market trend identification, and consumer behavior insights. Her expertise lies in technical Sales support, client interaction and project management, designing and implementing market research studies, conducting competitive analysis, and synthesizing complex data into actionable recommendations that drive business growth.
Co-Author
Co-Author Profile
Rahul Gotadki LinkedIn
Research Manager
He holds an experience of about 9+ years in Market Research and Business Consulting, working under the spectrum of Life Sciences and Healthcare domains. Rahul conceptualizes and implements a scalable business strategy and provides strategic leadership to the clients. His expertise lies in market estimation, competitive intelligence, pipeline analysis, customer assessment, etc.

Research Approach


Secondary Research

The secondary research process involved comprehensive analysis of medical device regulatory databases, healthcare infrastructure publications, hospital supply chain journals, and authoritative healthcare organizations. Key sources included the US Food & Drug Administration (FDA) Center for Devices and Radiological Health, European Medicines Agency (EMA) Medical Device Coordination Group, World Health Organization (WHO) Health Systems and Infrastructure Database, Centers for Disease Control and Prevention (CDC) Guidelines for Environmental Infection Control in Healthcare Facilities, American Hospital Association (AHA) Hospital Statistics, European Hospital and Healthcare Federation (HOPE) Data, Organisation for Economic Co-operation and Development (OECD) Health Statistics, National Institutes of Health (NIH) Agency for Healthcare Research and Quality (AHRQ), Health Facilities Management Association (HFMA), Joint Commission Resources, ECRI Institute Health Technology Assessment, and national health ministry reports covering healthcare facility construction, renovation statistics, and medical equipment procurement data from key markets. These sources were used to collect hospital bed capacity metrics, ASC (Ambulatory Surgical Center) counts, infection control standards, regulatory classification data for medical carts, healthcare infrastructure investment trends, and market landscape analysis for metal, plastic, and composite material-based medical carts across mobile, wall-mounted, and stationary configurations.


Primary Research

Qualitative and quantitative insights were obtained by interviewing supply-side and demand-side stakeholders during the primary research process. The supply-side sources consisted of CEOs, VPs of Product Development, regulatory affairs chiefs, and commercial directors from medical cart manufacturers, healthcare furniture OEMs, and hospital supply chain solution providers. Chief Nursing Officers (CNOs), Materials Management Directors, Biomedical Equipment Directors, procurement leads from acute care hospitals, Ambulatory Surgical Center (ASC) administrators, nursing home operations directors, and home healthcare agency coordinators constituted demand-side sources. Primary research has confirmed the product development timelines for smart cart technologies (RFID-enabled, battery-powered computing carts), validated market segmentation across emergency carts, medication carts, anesthesia carts, and procedure carts, and gathered insights on infection control compliance requirements, steel vs. polymer material preferences, and Group Purchasing Organization (GPO) contracting dynamics.

Primary Respondent Breakdown:

• By Designation: C-level Primaries (32%), Director Level (30%), Others (38%)

• By Region: North America (32%), Europe (30%), Asia-Pacific (28%), Rest of World (10%)


Market Size Estimation

Global market valuation was derived through revenue mapping and installed base analysis across healthcare facilities. The methodology included:

• Identification of over 35 main manufacturers in North America (Harloff, Capsa Solutions, Stryker), Europe (TBS Healthcare, Francehopital), Asia-Pacific (Advantech, JCM Med), and Latin America

• Product mapping across medication carts, emergency crash carts, anesthesia carts, procedure carts, and specialized isolation carts by material composition (metal, plastic, wood) and configuration (mobile computing carts, wall-mounted workstations, stationary storage)

• Analysis of reported and modeled annual revenues specific to medical cart and healthcare furniture portfolios

• Coverage of manufacturers representing 70-75% of global market share in 2024

• Extrapolation using bottom-up (healthcare facility count × cart penetration rate by care setting × average selling price by country) and top-down (manufacturer revenue validation and GPO contract value analysis) approaches to derive segment-specific valuations for hospital, nursing home, ASC, and home healthcare end-use segments

Download Free Sample

Kindly complete the form below to receive a free sample of this Report

Download PDF ×

We do not share your information with anyone. However, we may send you emails based on your report interest from time to time. You may contact us at any time to opt-out.
















