Medical Ceramics Market (2026 - 2035)

Medical Ceramics Market Research Report Information By Type (Bioinert Ceramics, Bioactive Ceramics, Bioresorbable Ceramics, Piezoceramics), By Application (Dental Applications, Orthopedic Applications, Cardiovascular, Medical Devices, Plastic Surgery), By End-User (Hospitals & Clinics, Specialty Centers), And By Region (North America, Europe, Asia-Pacific, And Rest Of The World) - Growth & Industry Forecast 2025 To 2035

Forecast Period
2026-2035
CAGR
7.12%
2025 Market Size
USD 20.90 Billion
2035 Market Size
USD 41.42 Billion
Medical Device ● Updated August 24, 2026 Report ID: MRFR/MED/4274-CR | Pages: 155 | Author: Vikita Thakur, Rahul Gotadki

Medical Ceramics Market Summary

The Medical Ceramics Market stood at USD 20.90 billion in 2025 and opens the forecast window at USD 22.31 billion in 2026, climbing to USD 41.42 billion by 2035 at a 7.12% CAGR. Two catalysts anchor that trajectory. The first is demographic: the share of people aged 65 and over across OECD economies passed 18% in 2024, pulling arthroplasty and restorative dentistry volumes upward year after year [1]. The second is reimbursement — the US Centers for Medicare & Medicaid Services expanded its Ambulatory Surgical Center Covered Procedures List to include additional total joint procedures, shifting implant demand toward lower-cost outpatient settings [2].

The bigger change is in manufacturing. Traditional lithography-based additive techniques, hot isostatic pressing and surface-tailored coatings that improve fracture toughness and reduce scrap rates are replacing dry-pressed and hand-machined ceramic components. European suppliers alone have committed an estimated USD 640 million for improved sintering and inspection capacity until 2025 [3]. Regulators strengthened the shift: EU MDR Annex XIV post-market clinical follow-up obligations have turned validated and traceable production into a commercial prerequisite instead of a differentiator [4].


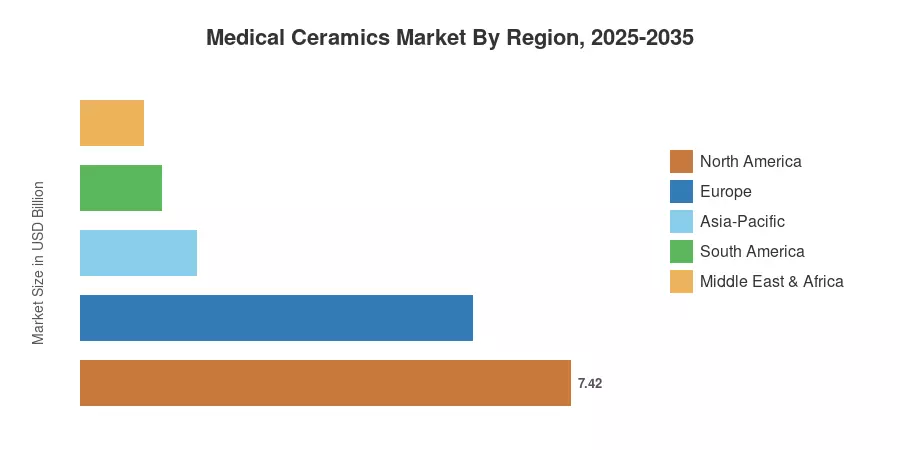
North America accounts for 35.5% of revenue in 2025, driven by dense arthroplasty registries and mature private dental spending. The Asia-Pacific region will see the greatest growth at a CAGR of 8.35% through 2035. China and India are expanding local implant manufacturing. Europe comes in as the second largest block on the back of Germany's device cluster. Suppliers who can demonstrate material performance, not only ship components, will win a competitive advantage in the next decade.


Key Report Takeaways

• By Material

  • Bioinert ceramics captured 53.8% of Medical Ceramics Market revenue in 2025, led by alumina and zirconia bearing couples.
  • Bioresorbable ceramics posted the fastest expansion at an 8.91% CAGR through 2035
  • Bioactive ceramics generated USD 5.14 billion in 2025 across spinal and craniomaxillofacial repair.

• By Application

  • Orthopedic applications held a 41.7% share of the Medical Ceramics Market in 2025
  • Dental applications grew at a 7.93% CAGR, the quickest among application segments.
  • Cardiovascular components contributed USD 2.84 billion in 2025

• By Geography

  • North America accounted for 35.5% of global revenue in 2025
  • Asia-Pacific advances at an 8.35% CAGR through 2035
  • Europe generated USD 5.94 billion in 2025


Market Size and Forecast (2021–2035)

The estimates are a blend of bottom-up procedural modeling (volumes for arthroplasty, spinal fusion and crown-and-bridge derived from national joint registries and dental association surveys) combined with top-down triangulation against supplier revenue disclosures and customs-level trade data for high-purity alumina and yttria-stabilised zirconia powders [1][5][6]. Historical years are reconciled to audited filings; prospective years apply procedure-volume elasticity to a calibrated 2025 basis.
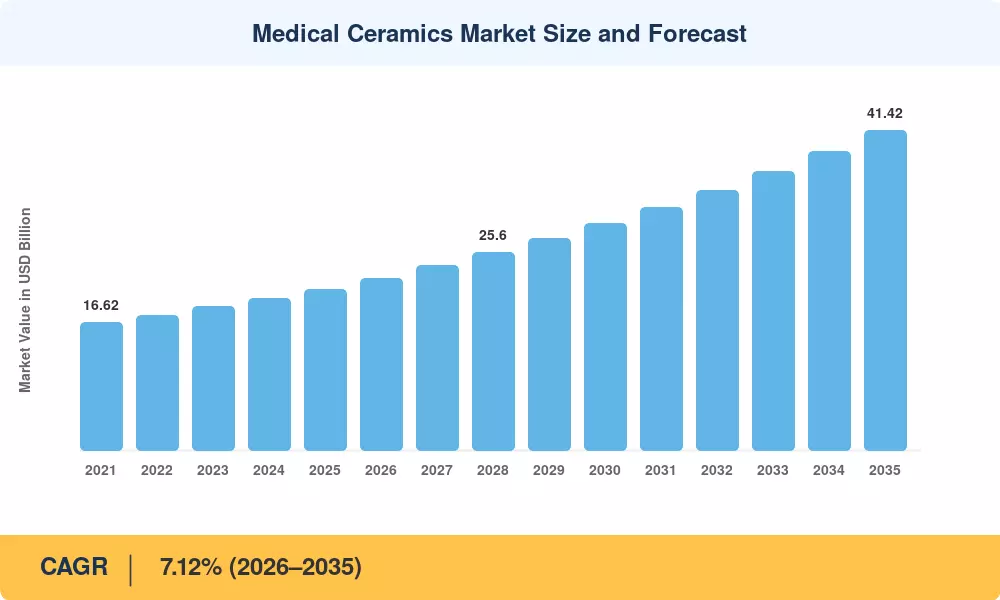
Medical Ceramics Market Size and Forecast
Our Impact
Enabled $4.3B Revenue Impact for Fortune 500 and Leading Multinationals
Partnering with 2000+ Global Organizations Each Year
30K+ Citations by Top-Tier Firms in the Industry

Driver Impact Analysis

Driver ~% Impact on CAGR Geographic Relevance Impact Timeline
Aging populations and rising arthroplasty volumes 1.6 pp Global Long-term (≥4 yr)
Patient preference for metal-free restorations 1.3 pp Europe, North America Medium-term (2–4 yr)
Public insurance expansion across Asia-Pacific 1.1 pp Asia-Pacific Medium-term (2–4 yr)
Additive and digital ceramic manufacturing 0.9 pp North America, Asia-Pacific Medium-term (2–4 yr)
Registry evidence on wear and revision rates 0.8 pp Europe, Oceania Long-term (≥4 yr)
Migration of joint surgery to outpatient settings 0.7 pp North America Short-term (≤2 yr)
Surface engineering and osseointegration coatings 0.6 pp Global Long-term (≥4 yr)


Demographics and Procedure Volume

Joint replacement demand tracks population age structure with unusual reliability. The Australian Orthopaedic Association National Joint Replacement Registry logged more than 140,000 hip and knee procedures in its 2024 reporting year, with ceramic-on-polyethylene bearings now used in over 40% of primary hip cases [9]. Similar registry patterns in the UK and Nordic systems feed directly into the Medical Ceramics Market, because bearing selection is made surgeon-by-surgeon rather than dictated centrally.

The Metal-Free Restoration Shift

Dentistry moved faster than orthopedics. Chairside milling systems and monolithic zirconia blanks cut restoration turnaround from two weeks to a single visit, and American Dental Association practice surveys show all-ceramic units displacing porcelain-fused-to-metal across a clear majority of single-unit crowns [7]. Price parity arrived around 2023; clinical preference did the rest.

Reimbursement and Site-of-Care Migration

Payers reshaped the demand curve. The CMS outpatient rule change moved a growing slice of total hip and knee arthroplasty into ambulatory centres, where procedure economics reward implant systems with shorter instrumentation trays and predictable inventory [2]. Suppliers responded with consignment models tuned to smaller facilities, a structural gain for the Medical Ceramics Market.

Manufacturing Technology

Sintering discipline determines margin. Lithography-based ceramic manufacturing now holds dimensional tolerances near 20 microns on complex geometries, allowing patient-specific craniomaxillofacial components that machining could not produce economically [3]. Yield improvements of roughly 12 percentage points on complex parts have been reported across European pilot lines since 2023 [3].


Restraints Impact Analysis

Restraint ~% Impact on CAGR Geographic Relevance Impact Timeline
EU MDR and FDA clinical evidence burden -1.2 pp Europe, North America Medium-term (2–4 yr)
Concentrated high-purity powder supply -0.8 pp Global Long-term (≥4 yr)
Hospital tender pricing and volume-based procurement -0.7 pp Asia-Pacific, Europe Short-term (≤2 yr)
Clinician concern over brittleness and fracture -0.6 pp Global Long-term (≥4 yr)
Capital intensity of sintering and finishing lines -0.5 pp Emerging markets Medium-term (2–4 yr)


Regulatory Cost Escalation

Compliance now rivals R&D as a budget line. MedTech Europe estimated recertification costs under EU MDR at EUR 2.0–3.5 million per legacy product family, with notified body review queues stretching past 18 months for Class III implants [4]. Smaller ceramic specialists have discontinued profitable but low-volume SKUs rather than absorb the file cost — a quiet contraction in catalogue breadth that the Medical Ceramics Market has yet to fully price in.

Raw Material Concentration

Feedstock is the hidden chokepoint. Yttria-stabilised zirconia powder qualified to ISO 13356 comes from a handful of Japanese and European producers, and yttrium oxide itself remains subject to Chinese export licensing introduced in 2023 [6]. Qualification of a second powder source typically consumes 12 to 24 months of validation work, so buyers carry inventory rather than switch.

Fracture Risk Perception

Memory shapes purchasing. Zirconia femoral head failures reported in the early 2000s still influence surgeon preference two decades later, even though modern alumina-matrix composites show fracture incidence below 0.03% in registry follow-up [9]. Overcoming that requires long-horizon outcome data that only registries can supply.


Medical Ceramics Market Opportunities

Patient-Specific Craniomaxillofacial Implants

Additive processing turns one-off geometries into a viable product line. Hospitals in Germany and Singapore now run point-of-care design workflows that pair CT segmentation with contracted ceramic printing, compressing lead times from six weeks to under ten days [3]. Suppliers that offer design software alongside sintered parts capture a materially larger share of the case value.

Resorbable Scaffolds for Bone Regeneration

Calcium phosphate bioceramics are moving from void filler to engineered scaffold, with tuned porosity that matches native remodelling rates. Clinical interest in spinal fusion and dental ridge augmentation is expanding the addressable base well beyond traditional graft substitution [10].

Asia-Pacific Localisation

Import substitution is policy, not preference. India's Production Linked Incentive scheme for medical devices allocated roughly USD 400 million toward domestic implant capacity, and several Indian and Korean firms have commissioned zirconia machining lines since 2024 [8]. Foreign suppliers that license technology locally protect volume that tenders would otherwise reassign.

Outcome-Linked Commercial Models

Data becomes the product. Registry-linked warranty programmes — where suppliers price implants against measured revision rates rather than list price — are being piloted with Nordic and Dutch hospital groups [9]. The model rewards manufacturers holding the strongest longitudinal evidence and locks in multi-year supply.

Ceramic Components in Sensing and Diagnostics

Piezoceramic elements sit inside ultrasound transducers, intravascular imaging catheters, and surgical energy devices. Demand here follows imaging capital cycles rather than surgical volumes, giving suppliers a useful counter-cyclical hedge [5].


Medical Ceramics Market Future Outlook

Digital Design and Automated Inspection

Machine vision will do what human inspectors cannot at volume — detect subsurface flaws in sintered parts at line speed. Suppliers deploying automated computed-tomography inspection report scrap reduction of 8 to 14 percentage points on complex geometries [3]. Over the decade, this shifts cost structure enough to make patient-specific components price-competitive with catalogue parts.

Evidence as Competitive Infrastructure

Registries are becoming procurement infrastructure. With more than 20 national arthroplasty registries now publishing implant-level survivorship, purchasing committees can rank bearing materials without vendor input [9]. The Medical Ceramics Market will increasingly reward manufacturers who invest in ten-year follow-up rather than in sales coverage.

Supply Chain Reconfiguration

Feedstock security moves up the agenda. Following rare-earth export licensing changes, several Western suppliers began qualifying non-Chinese yttrium sources and building 12-month strategic inventories [6]. Expect vertical integration into powder processing among the larger component producers before 2030.

Sustainability and Energy Cost

Sintering is energy-hungry — kiln cycles above 1,400°C dominate the carbon footprint of ceramic components. European industrial electricity prices and the Carbon Border Adjustment Mechanism together push producers toward electric kilns with heat recovery [13]. Buyers in the Medical Ceramics Market are already requesting product carbon footprint data in tender documentation.


Medical Ceramics Market Segmentation

By Material

Material choice defines everything downstream in the Medical Ceramics Market — cost, regulatory pathway, and clinical indication all follow from it.

Segment Metric (2025 unless noted) Primary Demand Driver
Bioinert Ceramics 53.8% share Wear resistance in load-bearing joint bearings
Bioactive Ceramics USD 5.14 B Osseointegration in spinal and craniofacial repair
Bioresorbable Ceramics 8.91% CAGR (2026–2035) Scaffolds that remodel into native bone
Piezoceramics & Composites 7.7% share Ultrasound and surgical energy devices


Bioinert grades dominate because alumina-matrix composites solved the fracture problem that limited earlier zirconia heads, delivering wear rates roughly two orders of magnitude below metal-on-polyethylene couples [9]. Bioresorbable grades grow fastest from a smaller base, driven by surgeons who prefer a ceramic bone substitute that disappears on a predictable timeline rather than a permanent implant requiring lifelong imaging surveillance [10].

By Application

Segment Metric (2025 unless noted) Primary Demand Driver
Orthopedic 41.7% share Hip and knee arthroplasty volume growth
Dental 7.93% CAGR (2026–2035) Chairside milling and metal-free preference
Cardiovascular USD 2.84 B Pacemaker feedthroughs and valve components
Plastic Surgery 6.8% share Craniofacial reconstruction and augmentation
Other Applications USD 0.98 B Diagnostic and surgical instrumentation


Orthopedics contributes the largest revenue pool in the Medical Ceramics Market, though its growth is essentially demographic and therefore predictable. Dental moves faster because the buying decision sits with individual practices rather than hospital committees, and because digital workflow adoption removed the lab bottleneck that once capped ceramic restoration throughput [7].

By End-User Industry

Segment Metric (2025 unless noted) Primary Demand Driver
Hospitals and Clinics 54.0% share Complex and revision procedure concentration
Ambulatory Surgical Centers 7.79% CAGR (2026–2035) Reimbursement-driven site-of-care migration
Specialty Centers USD 4.54 B Dedicated orthopedic and dental practices


Hospitals retain the majority because revision surgery, oncological reconstruction, and complex cases cannot safely move to outpatient. Ambulatory centres nonetheless take share every year as payer policy and surgeon economics align around same-day discharge [2].


Regional Market Share Analysis

Region Metric (2025) Primary Investment Themes
North America 35.5% share Outpatient arthroplasty, chairside dental milling
Europe USD 5.94 B MDR-compliant capacity, registry-linked contracting
Asia-Pacific 8.35% CAGR (2026–2035) Domestic manufacturing, insurance coverage expansion
South America USD 1.23 B Private hospital networks, dental tourism
Middle East & Africa 4.6% share Hospital construction, medical city projects
Total USD 20.90 B

Regional performance in the Medical Ceramics Market splits along reimbursement design more than along technology access. Mature private-pay dental markets reward premium materials; single-payer systems reward documented revision economics.


North America

Country Metric Key Driver
US 82.4% of region ASC procedure list expansion [2]
Canada USD 0.71 B Provincial wait-time reduction funding
Mexico 8.3% CAGR Cross-border dental and orthopedic tourism


American demand rests on volume and mix simultaneously. The CMS outpatient shift moved thousands of joint cases annually into ambulatory centres, while private dental insurance coverage for all-ceramic crowns broadened across major carriers [2][7]. Canada's growth is slower but steadier, funded through provincial surgical backlog programmes rather than commercial expansion.

Europe

Country Metric Key Driver
Germany 24.1% of region Device manufacturing cluster and DRG stability
UK USD 0.85 B National Joint Registry-guided procurement [9]
France 13.8% of region LPPR reimbursement listings for ceramic bearings
Italy USD 0.66 B Regional tender consolidation
Spain 8.4% of region Private hospital dental expansion
Nordic Countries 6.9% CAGR Registry-linked outcome contracting
Russia USD 0.32 B Domestic substitution programmes
Rest of Europe 9.7% of region CEE hospital modernisation funds


Germany anchors the region on both sides of the ledger — it hosts leading component producers and runs one of the highest per-capita arthroplasty rates in Europe [1]. British procurement has become unusually evidence-driven; National Joint Registry outputs feed directly into framework tender scoring, which advantages suppliers with long survivorship curves [9].

Asia-Pacific

Country Metric Key Driver
China 34.6% of region Volume-based procurement widening access [8]
India 9.8% CAGR Production Linked Incentive manufacturing scheme [8]
Japan USD 1.16 B Advanced material supply base and aging population
South Korea 9.1% of region Dental implant export leadership
ASEAN 8.9% CAGR Private hospital and medical tourism build-out
Rest of Asia-Pacific USD 0.42 B Public health infrastructure investment


Chinese centralised procurement cut implant prices sharply but expanded procedure counts by a larger multiple, lifting unit demand even as average selling prices compressed [8]. Korea plays a different game entirely, exporting dental implant systems across Asia and the Middle East from a manufacturing base built on high-volume zirconia machining.

South America

Country Metric Key Driver
Brazil 55.8% of region ANVISA registration reform and private plan growth
Argentina USD 0.19 B Restorative dentistry demand in urban centres
Rest of South America 7.4% CAGR Chilean and Colombian hospital investment


Brazilian demand concentrates in supplemental-insurance hospital networks rather than the public SUS system, which limits volume but supports premium material selection [11]. Currency volatility remains the principal commercial risk for importers.

Middle East & Africa

Country Metric Key Driver
Saudi Arabia 27.9% of region Vision 2030 health sector transformation [12]
UAE USD 0.19 B Medical tourism and specialist clinic density
South Africa 15.4% of region Private hospital group procurement
Egypt 8.6% CAGR Universal Health Insurance rollout
Rest of MEA USD 0.24 B Donor-funded surgical capacity programmes


Saudi Arabia's health transformation programme committed substantial capital to new hospital capacity and specialist surgical centres, creating first-fit demand for implant systems rather than replacement demand [12]. Egyptian growth is faster in percentage terms but starts from a small installed base.


Medical Ceramics Market By Region, 2025-2035

Competitive Benchmarking

Concentration is in the moderate range. The top five suppliers are expected to account for 33-38% of global revenue, resulting in an HHI in the 620-700 range -- fragmented enough that specialist producers retain pricing power in niche geometries, concentrated enough that the largest firms set material standards. There is a broad variation within the vertical, with some businesses selling powder and finished components, and others acting simply as contract manufacturers to device OEMs.

Company Est. Revenue Share Range Key Offerings for Medical Ceramics Market Strategic Positioning
CeramTec ~9–12% Alumina-matrix composite femoral heads, spinal spacers Reference supplier for orthopedic bearings
CoorsTek ~7–10% Zirconia and alumina components, feedthroughs Broad technical ceramics platform
Kyocera Corporation ~6–9% Hip systems, dental blanks, sensor ceramics Integrated from powder to finished device
Straumann Group ~4–7% Ceramic dental implants, restorative blanks Premium dental brand with clinical evidence depth
Morgan Advanced Materials ~4–6% Precision components, hermetic seals Engineering-led contract manufacturing
Dentsply Sirona ~3–6% Milling blocks, chairside restorative systems Workflow-plus-material bundling
Zimmer Biomet ~3–5% Ceramic bearing knee and hip systems Registry-backed orthopedic portfolio
Ivoclar ~3–5% Lithium disilicate and zirconia restoratives Aesthetics-focused dental materials
Tosoh Corporation ~2–4% Yttria-stabilised zirconia powders Upstream feedstock leadership
Stryker ~2–4% Ceramic-on-polyethylene articulations Surgeon-facing sales and robotics tie-in
DePuy Synthes ~2–4% Hip bearing couples, craniomaxillofacial parts Global hospital contracting scale
Rauschert ~1–3% Custom technical ceramic components Small-batch and prototype specialist


Recent News & Developments

  • CeramTec (March 2024): Commissioned expanded isostatic pressing capacity in Bavaria, targeting shorter lead times on composite femoral heads amid European supply constraints [3]
  • European Commission (May 2023): Extended MDR transition deadlines for legacy Class III devices to 2027–2028, easing near-term recertification pressure on ceramic implant portfolios [4]
  • Straumann Group (September 2024): Broadened its ceramic dental implant line into additional Asia-Pacific registrations, targeting metal-sensitivity patient segments [7]
  • India Ministry of Chemicals & Fertilizers (July 2023): Approved additional Production Linked Incentive disbursements for domestic orthopedic implant manufacturing capacity [8]
  • Kyocera (February 2025): Announced investment in additive ceramic manufacturing for patient-specific craniomaxillofacial components [3]
  • CoorsTek (November 2023): Acquired precision machining capacity to shorten qualification cycles for device OEM customers [5]
  • US FDA (June 2024): Published updated guidance on mechanical testing expectations for ceramic-bearing hip systems, clarifying fatigue and impingement protocols [14]
  • Tosoh Corporation (October 2025): Expanded yttria-stabilised zirconia powder output in response to medical-grade demand and feedstock security concerns [6]


Medical Ceramics Market Report Scope

Parameter Detail
Market Scope Global supply of ceramic materials and components used in orthopedic, dental, cardiovascular, plastic surgery, and diagnostic device applications
Study Period 2021–2035 (Historical 2021–2024; Base Year 2025; Forecast 2026–2035)
CAGR 7.12% (2026–2035)
Market Size Checkpoints USD 20.90 B (2025); USD 22.31 B (2026); USD 41.42 B (2035)
Fastest Growing Segments Bioresorbable ceramics (material); dental (application); ambulatory surgical centers (end-user)
Companies Profiled 12 leading suppliers spanning powder producers, component manufacturers, and device OEMs
Valuation Currency USD Billion

FAQs

How long does it typically take to qualify a new ceramic component supplier for an implantable device?
Expect 12 to 24 months. Powder characterisation, sintering validation, and mechanical testing to ISO 13356 dominate the timeline, followed by regulatory file amendment [20].
What should procurement teams check before switching zirconia grades mid-programme?
Verify yttria content, grain size distribution, and low-temperature degradation resistance against the original specification. Any deviation triggers fresh fatigue testing and a regulatory change notification [14].
Which competitive risk in the Medical Ceramics Market is most often underestimated?
Upstream powder producers integrating forward into finished components. They control feedstock cost and can undercut independent machinists on high-volume geometries [6].
Are ceramic implants suitable for patients with documented metal hypersensitivity?
Yes — that indication drives a meaningful share of ceramic dental implant and ceramic-bearing knee selection. Clinical guidance supports ceramic alternatives where nickel or cobalt sensitivity is confirmed [7].
How does the Medical Ceramics Market handle carbon footprint disclosure in tenders?
European purchasers increasingly request product-level footprint data covering kiln energy. Suppliers using electric sintering with heat recovery hold a scoring advantage [13].
What integration challenge appears most frequently with additive ceramic manufacturing?
Post-sintering shrinkage compensation. Design files must be scaled per material batch, which demands tighter feedstock control than machined production requires [3].
Where does the Medical Ceramics Market see emerging use beyond implants?
Surgical energy devices and intravascular imaging catheters. Both rely on piezoceramic elements whose demand follows imaging capital cycles rather than procedure volumes [5].    
Author
Author
Author Profile
Vikita Thakur LinkedIn
Senior Research Analyst
She holds an experience of about 5+ years in market research and business consulting projects for sectors such as life sciences, medical devices, and healthcare IT. She possesses a robust background in data analysis, market estimation, competitive intelligence, pipeline analysis market trend identification, and consumer behavior insights. Her expertise lies in technical Sales support, client interaction and project management, designing and implementing market research studies, conducting competitive analysis, and synthesizing complex data into actionable recommendations that drive business growth.
Co-Author
Co-Author Profile
Rahul Gotadki LinkedIn
Research Manager
He holds an experience of about 9+ years in Market Research and Business Consulting, working under the spectrum of Life Sciences and Healthcare domains. Rahul conceptualizes and implements a scalable business strategy and provides strategic leadership to the clients. His expertise lies in market estimation, competitive intelligence, pipeline analysis, customer assessment, etc.
Share::
Request Free Sample

Research Approach


Secondary Research

The secondary research process involved comprehensive analysis of regulatory databases, ISO standards, peer-reviewed materials science journals, clinical publications, and authoritative medical device organizations. Key sources included the US Food & Drug Administration (FDA) Center for Devices and Radiological Health (CDRH), European Medicines Agency (EMA) Medical Device Coordination Group (MDCG), International Organization for Standardization (ISO 13356, ISO 6474, ISO 10993 for biological evaluation), ASTM International (F04 Medical Devices Committee), American Ceramic Society (ACerS), International Society for Ceramics in Medicine (ISCM), National Institutes of Health (NIH) National Institute of Arthritis and Musculoskeletal and Skin Diseases (NIAMS), National Center for Biotechnology Information (NCBI/PubMed), Centers for Disease Control and Prevention (CDC) National Center for Health Statistics Arthritis Data, World Health Organization (WHO) Global Burden of Musculoskeletal Conditions, American Academy of Orthopaedic Surgeons (AAOS) Implant Registries, American Dental Association (ADA) Survey Center, European Federation of Ceramics (ECerS), Japan Fine Ceramics Association (JFCA), OECD Health Statistics, and national health ministry medical device registries from key markets. These sources were used to collect implant procedure statistics, regulatory approval data (510(k), PMA, CE Mark), ISO certification compliance, clinical safety studies for alumina/zirconia/hydroxyapatite, arthritis and osteoporosis prevalence trends, dental restoration volumes, and competitive landscape analysis for bioinert, bioactive, bioresorbable, and piezoelectric ceramic technologies.


Primary Research

Qualitative and quantitative insights were obtained by interviewing supply-side and demand-side stakeholders during the primary research process. Medical ceramic manufacturers, precision ceramic processors, and dental OEMs were among the supply-side sources, which included CEOs, VPs of R&D, regulatory affairs managers, and commercial directors. The demand-side sources included orthopedic surgeons, maxillofacial surgeons, prosthodontists, hospital procurement administrators, and materials managers from ambulatory surgical centers, academic medical centers, and implant centers. Market segmentation was validated across ceramic types, ceramic implant pipeline timelines were confirmed, and insights were gathered on surgical adoption patterns, pricing strategies for zirconia versus alumina components, and reimbursement dynamics for ceramic-on-ceramic hip bearings and dental crowns through primary research.

Primary Respondent Breakdown:

By Designation: C-level Primaries (32%), Director Level (35%), Others (33%)

By Region: North America (32%), Europe (30%), Asia-Pacific (28%), Rest of World (10%)


Market Size Estimation

Global market valuation was derived through revenue mapping and implant volume analysis. The methodology included:

Identification of 50+ key manufacturers across North America, Europe, Asia-Pacific (Japan, China, South Korea), and Latin America specializing in medical-grade ceramics

Product mapping across bioinert ceramics (alumina, zirconia, pyrolytic carbon), bioactive ceramics (hydroxyapatite, bioactive glass, tricalcium phosphate), bioresorbable ceramics, and piezoceramics

Analysis of reported and modeled annual revenues specific to medical ceramic portfolios (excluding industrial/electronic ceramic divisions)

Coverage of manufacturers representing 75-80% of global market share in 2024

Extrapolation using bottom-up (implant procedure volume × ASP by country for hip/knee/dental implants) and top-down (manufacturer revenue validation across CeramTec, Kyocera, CoorsTek, Straumann, Zimmer Biomet, Stryker ceramic divisions) approaches to derive segment-specific valuations for orthopedic, dental, cardiovascular, and plastic surgery applications

Share::
Request Free Sample
Download Free Sample

Kindly complete the form below to receive a free sample of this Report

* Please use a valid business email

Share::
Request Free Sample
Download PDF ×

We do not share your information with anyone. However, we may send you emails based on your report interest from time to time. You may contact us at any time to opt-out.
















