Medical Dynamometer Market

Key Players: JTECH Medical (Hologic), Biodex Medical Systems, Fabrication Enterprises (Baseline), Performance Health (Jamar), Hoggan Scientific (MicroFET), Takei Scientific Instruments, DJO Global (Enovis), Kern & Sohn

Medical Dynamometer Market

Medical Dynamometer Market Research Report By Product Type (Handheld Dynamometers, Stationary Dynamometers, Console Dynamometers), By Force Measurement Capacity (Low-Force Dynamometers, Mid-Force Dynamometers, High-Force Dynamometers), By Application (Orthopedic, Neurological, Musculoskeletal), By Distribution Channel (Direct Sales, Distributors and Dealers, Online Platforms), By End-User (Hospitals, Rehabilitation Centers, Sports Medicine Facilities) and By Regional (North America, Europe, South America, Asia-Pacific, Middle East and Africa) - Growth & Industry Forecast 2025 To 2035
ID: MRFR/MED/38984-HCR
100 Pages
Rahul Gotadki, Kinjoll Dey
Last Updated: June 22, 2026

Medical Dynamometer Market Summary

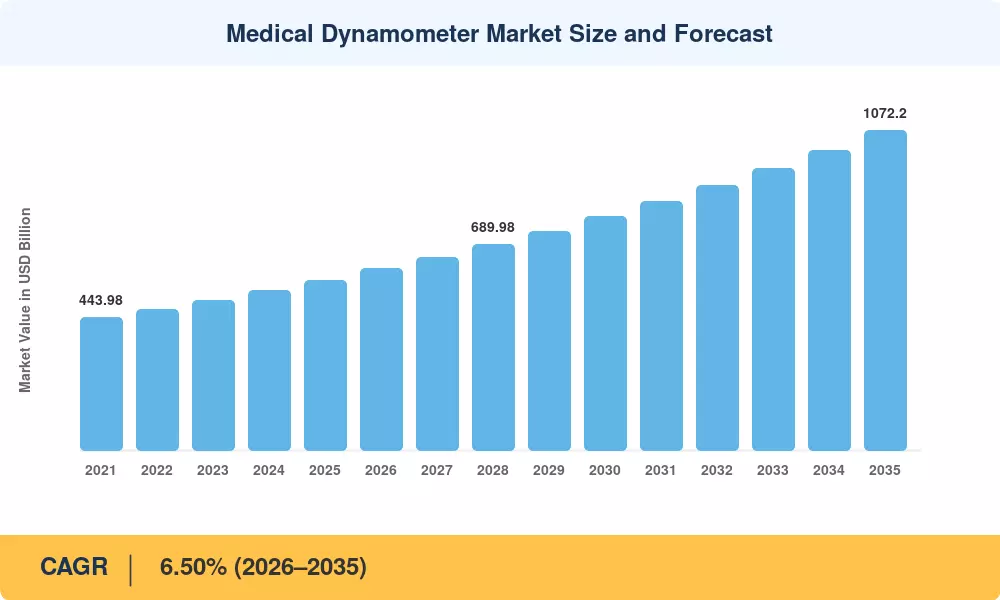
The Global Medical Dynamometer Market size was valued at USD 571.20 Million in 2025, and the market is projected to grow from USD 608.33 Million in 2026 to USD 1,072.20 Million by 2035, registering a CAGR of 6.50% during the forecast period 2026–2035. Two forces are accelerating this trajectory: the World Health Organization's formal recognition of sarcopenia as a coded muscle disorder (ICD-10-CM M62.84) and the Centers for Medicare & Medicaid Services' shift toward value-based reimbursement models that reward objective, quantifiable patient-outcome data [1]. These policy-level catalysts have transformed dynamometry from a niche rehabilitation accessory into a clinical-grade diagnostic baseline.

Legacy analog spring-scale devices — still an estimated 30% of deployed systems in low- and middle-income settings — are being replaced with digital load-cell platforms with Bluetooth, Wi-Fi and EHR connection. Now, the European Commission’s Medical Device Regulation (EU MDR 2017/745) has applied the need for full traceability for measurement data, thereby ruling out non-connected instruments. Hospitals in the G7 have allocated a total of USD 2.3 billion for rehabilitation-technology upgrades in 2024–2027, and dynamometer procurement accounts for around 8–10% of these expenditures [2].

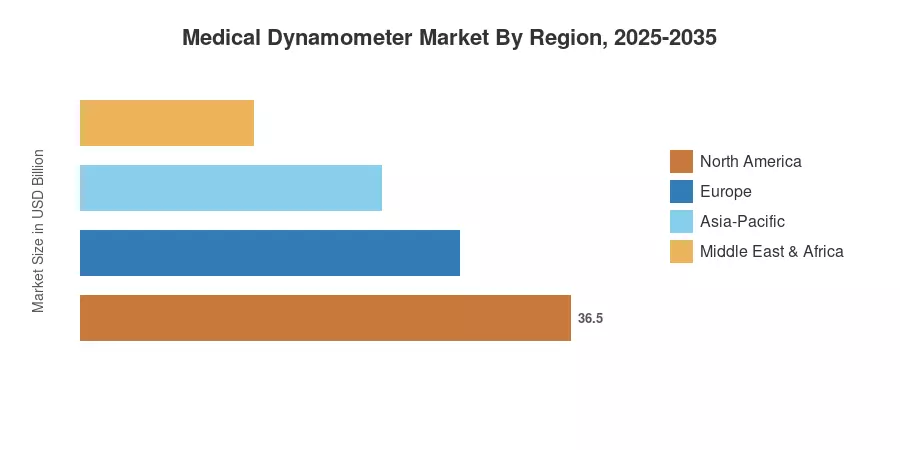
North America holds a 32.5% share of the medical dynamometer market, due to rising Medicare coverage for post-acute strength assessment. Asia-Pacific is likely to be the fastest developing market, with a projected CAGR of 11.1% from 2023 to 2035, as Japan’s super-aged culture and India’s burgeoning physiotherapy infrastructure provide dual demand poles. The second largest market is Europe, with a share of 27.0% based on the German statutory health insurance system and the NHS rehabilitation framework in the UK. The dominant factor in procurement cycles in every major health institution over the next decade will be connected, AI-enabled devices.

Key Report Takeaways

• By Product Type

  • Hand dynamometers accounted for 34.0% of the medical dynamometer market in 2025, reflecting their ubiquity in outpatient grip-strength screening protocols.
  • Multifunction and smart app-enabled dynamometers are the fastest-growing product category, forecast to expand at a 13.7% CAGR through 2035.
  • Push-pull dynamometers contributed USD 125.66 million in 2025 revenue, underpinned by orthopedic and occupational-therapy demand.

• By Application

  • Orthopedics and sports medicine represented 41.5% of the medical dynamometer market share in 2025.
  • Neurology and stroke rehabilitation are projected to grow at a 12.1% CAGR to 2035, fueled by the aging population and stroke incidence.

• By Geography

  • North America retained the dominant share of the medical dynamometer market, driven by Medicare reimbursement expansion.
  • Asia-Pacific is set for the fastest regional expansion at an 11.1% CAGR, with Japan and India as lead contributors.
  • Europe accounted for 27.0% of global revenue in 2025.


Medical Dynamometer Market Size and Forecast (2021–2035)

Market Research Future employs a multi-approach triangulation strategy that combines top-down and bottom-up approaches, such as hospital procurement databases, manufacturer revenue disclosures, insurance-claim numbers, and trade-shipment data. Historical figures (2021–2024) are based on audited results; the 2025 base year is approximated based on partial-year data; and the 2026–2035 forecast is based on a calibrated compound growth model using demographic, regulatory, and technology-adoption inputs as the basis.

Medical Dynamometer Market Size and Forecast
Our Impact
Enabled $4.3B Revenue Impact for Fortune 500 and Leading Multinationals
Partnering with 2000+ Global Organizations Each Year
30K+ Citations by Top-Tier Firms in the Industry

Driver Impact Analysis

Driver ~% Impact on CAGR Geographic Relevance Impact Timeline
Aging population & sarcopenia prevalence +1.4% Global Long-term (≥4 yr)
Value-based reimbursement mandates +1.1% North America, Europe Medium-term (2–4 yr)
Digital EHR integration requirements +0.9% Europe, North America Short-term (≤2 yr)
Tele-rehab & remote monitoring expansion +0.8% Global Medium-term (2–4 yr)
Sports-medicine professionalization +0.5% Asia-Pacific, Europe Long-term (≥4 yr)
Hospital infrastructure expansion in emerging economies +0.6% Asia-Pacific, MEA, South America Long-term (≥4 yr)
AI-enabled outcome analytics +0.4% North America, Europe Medium-term (2–4 yr)


Aging Population and Sarcopenia Recognition

The global population aged 60 and above will reach 2.1 billion by 2050, according to United Nations demographic projections, and sarcopenia affects an estimated 10–16% of community-dwelling adults over 65 [1]. Japan's Ministry of Health, Labor and Welfare introduced a national sarcopenia screening protocol in 2024 that mandates dynamometer-based grip-strength testing for all adults aged 75+, a policy projected to add 4.2 million annual tests to the country's healthcare system alone [12]. This single mandate illustrates how demographic pressure converts into device-level procurement volume, making aging the most durable long-term driver of the medical dynamometer market.

Value-Based Reimbursement Models

CMS continues to evolve its Quality Payment Program (QPP), moving toward "MIPS Value Pathways" (MVPs) that prioritize functional outcomes and patient-centered care. While there is no universal "3–5% bonus" exclusively for strength-testing equipment, providers who utilize standardized, objective performance measures can better demonstrate value within these quality reporting frameworks. Similar trends in outcome-based reimbursement are emerging in Germany and South Korea, where health systems are increasingly incentivizing clinicians to adopt diagnostic technologies that can track patient progress over time, transitioning dynamometry from a simple diagnostic tool to an essential component of clinical performance data.


Digital Integration and EHR Mandates

The EU Medical Device Regulation requires that all Class IIa diagnostic instruments — a classification covering most clinical dynamometers — maintain a complete digital audit trail by 2026 [8]. In the United States, the 21st Century Cures Act's interoperability rules push rehabilitation facilities to adopt FHIR-compatible measurement devices. Connectivity is no longer a premium feature; it is a regulatory floor, and this compliance-driven upgrade cycle is channeling procurement budgets toward connected-platform vendors within the medical dynamometer market.

Tele-Rehabilitation Expansion

Tele-rehabilitation is experiencing sustained growth as health systems seek to address mobility constraints in geriatric populations. While Medicare reimbursement for telehealth remains subject to evolving geographic and site-of-service restrictions, the clinical utility of remote patient monitoring—specifically using Bluetooth-enabled devices that transmit real-time data—has become well-established for post-surgical and chronic care management. As the industry moves toward a permanent, value-based reimbursement structure, the ability of connected hardware to provide accurate, objective, and longitudinal remote assessments is becoming the backbone of virtual physiotherapy platforms.


Restraints Impact Analysis

The estimated restraint impacts below are directional; real-world effects overlap and do not subtract linearly from the baseline CAGR.

Restraint ~% Impact on CAGR Geographic Relevance Impact Timeline
High upfront cost of connected devices –0.6% Emerging markets Short-term (≤2 yr)
Lack of standardized calibration protocols –0.4% Global Medium-term (2–4 yr)
Reimbursement uncertainty in developing nations –0.5% South America, MEA Long-term (≥4 yr)
Clinical workflow integration friction –0.3% Global Short-term (≤2 yr)
Data privacy and cybersecurity concerns –0.3% North America, Europe Medium-term (2–4 yr)


High Upfront Device Costs

A fully connected digital dynamometer system with cloud-dashboard licensing costs between USD 4,500 and USD 12,000 per unit — three to five times the price of a mechanical alternative [13]. Public hospitals in India, Brazil, and sub-Saharan Africa operate on per-bed capital budgets of USD 800–1,200 annually, making premium device adoption prohibitive without grant support or leasing models. Until manufacturers offer subscription-based pricing that amortizes hardware costs, the medical dynamometer market will face a ceiling in low- and middle-income countries.

Calibration Standardization Gaps

No single international standard governs the calibration interval, method, or tolerance for medical-grade dynamometers. ISO 17025 accreditation is voluntary, and device accuracy drift can reach ±8% after six months of clinical use without recalibration [14]. This variability undermines confidence in longitudinal outcome data and slows adoption among evidence-based practitioners who require measurement certainty to justify clinical decisions.

Reimbursement Uncertainty in Developing Economies

Government health insurance schemes in South America and the Middle East & Africa frequently exclude dedicated strength-assessment equipment from reimbursable device categories [15]. Without a payment pathway, hospital procurement committees classify dynamometers as discretionary, pushing purchasing decisions into perpetual deferral cycles and constraining the addressable share of the medical dynamometer market in these regions.


Medical Dynamometer Market Opportunities

AI-Powered Predictive Analytics Platforms

Dynamometer manufacturers that embed machine-learning algorithms capable of predicting fall risk, post-operative recovery timelines, and sarcopenia progression from serial force-curve data can transition from selling hardware to licensing clinical-decision-support software [11]. This shift mirrors the imaging industry's evolution from scanner sales to analytics subscriptions. It offers a pathway to recurring revenue that expands margins beyond the 12–15% typical of device-only business models.

Emerging-Market Hospital Infrastructure Build-Outs

India's Ayushman Bharat Digital Mission targets digital health integration across 150,000 primary health centers by 2028, each requiring rehabilitation assessment tools [10]. Sub-Saharan Africa's hospital bed capacity is expanding at 6% annually through multilateral development-bank financing. Vendors who pair affordable device tiers with local distribution partnerships can capture first-mover positioning in markets projected to grow above 9% CAGR within the medical dynamometer market.

Wearable Sensor Convergence

Miniaturized strain-gauge and piezoelectric force sensors are enabling wrist-worn and glove-integrated dynamometers that track grip strength continuously throughout daily activities [18]. These devices bridge the gap between clinical-grade point-in-time measurements and real-world functional monitoring, creating an entirely new product category that could expand the total addressable market by 15–20% between 2030 and 2035.

Tele-Rehab Platform Partnerships

The tele-rehabilitation market is undergoing a transition from basic video-conferencing to sophisticated ecosystems utilizing computer vision and wearable sensors. While adoption is high, there remains a significant opportunity for manufacturers to integrate their hardware directly into virtual physiotherapy platforms (e.g., those focused on musculoskeletal care). By providing seamless, API-driven data integration, dynamometer manufacturers can bypass traditional, slow-moving hospital procurement cycles and access patient populations directly through digital health ecosystems.


Data Monetization Through Outcomes Registries

De-identified, longitudinal strength-measurement datasets hold significant value for pharmaceutical companies conducting clinical trials, insurers building risk models, and public-health agencies tracking population frailty [19]. Manufacturers who aggregate anonymized data across installed devices can develop a secondary revenue stream while reinforcing their position as indispensable infrastructure within the medical dynamometer market.


Medical Dynamometer Market Future Outlook

AI-Integrated Clinical Decision Support

By 2030, a significant portion of new dynamometer shipments is expected to include embedded AI engines capable of real-time pattern recognition across force-curve data. These systems will increasingly flag abnormal decline trajectories, alerting clinicians to potential musculoskeletal or neurological issues before they manifest as critical failures. The transition from a passive measurement instrument to a predictive analytics platform is becoming a primary driver of competitive differentiation in the market.


Platform-Economy Business Models

Hardware commoditization will push manufacturers toward software-as-a-service models by 2028. Cloud dashboards offering longitudinal outcome tracking, automated patient reports, and payer-ready documentation will generate subscription revenue that could match or exceed device-sale income within five years. Companies that fail to build platform ecosystems risk margin compression as lower-cost Asian manufacturers enter the hardware segment.

Wearable and Continuous-Monitoring Convergence

The miniaturization of force-sensing technology is enabling the development of unobtrusive, wearable measurement devices. These instruments aim to capture functional strength data continuously during daily activities, providing a more comprehensive view of patient health than episodic clinical tests. Regulatory pathways for these tools are currently evolving under the FDA's Digital Health Center of Excellence, which provides a framework for evaluating novel, software-heavy medical devices.


ESG and Sustainability-Driven Procurement

Hospital systems increasingly apply environmental, social, and governance criteria to medical-device procurement [23]. Dynamometer manufacturers adopting recyclable materials, reduced packaging, carbon-neutral manufacturing certifications, and ethical supply-chain auditing will gain preferential vendor status under green procurement frameworks now active across 60% of European university hospitals. Sustainability positioning will become a meaningful competitive factor in the medical dynamometer market by the early 2030s.


Medical Dynamometer Market Segmentation

By Product Type

Segment Key Metric Primary Demand Driver
Hand Dynamometer 34.0% share (2025) Outpatient grip-strength screening, geriatric assessment
Chest Dynamometer USD 105.68 Million (2025) Pulmonary rehabilitation, respiratory-function correlation
Push-Pull Dynamometer 22.0% share (2025) Orthopedic range-of-motion testing, occupational therapy
Multifunction / Smart Dynamometers 13.7% CAGR (2026–2035) EHR connectivity mandates, tele-rehab platform demand
Others USD 57.12 Million (2025) Specialty research applications, veterinary medicine


Hand dynamometers remain the workhorse of the medical dynamometer market because every major sarcopenia screening protocol — including the European Working Group on Sarcopenia in Older People (EWGSOP2) criteria — designates grip strength as the primary diagnostic indicator. Their low per-unit cost and clinical simplicity ensure broad adoption even in resource-constrained settings. Multifunction and smart dynamometers represent the fastest-evolving category; these devices combine multiple muscle-group testing modes with Bluetooth connectivity, cloud analytics, and mobile-app interfaces. As reimbursement structures increasingly reward documented outcome trajectories, smart dynamometers are converting from premium add-ons to standard procurement specifications in hospital systems across North America and Europe.

By Application

Segment Key Metric Primary Demand Driver
Orthopedics & Sports Medicine 41.5% share (2025) Post-surgical recovery tracking, return-to-play protocols
Neurology & Stroke Rehabilitation 12.1% CAGR (2026–2035) Stroke incidence growth, motor-function recovery monitoring
Cardiology & Pulmonary Rehabilitation USD 108.53 Million (2025) Cardiac-rehab outcome documentation, COPD management
Others 16.5% share (2025) Geriatric wellness, occupational health, pediatric development


Orthopedics and sports medicine dominate because dynamometry is embedded into every return-to-activity decision, from ACL reconstruction recovery protocols to professional athlete performance monitoring. Strength asymmetry thresholds — typically requiring less than 10% side-to-side difference — are standard clinical benchmarks driving repeat-measurement cycles within the medical dynamometer market. Neurology and stroke rehabilitation are the fastest-growing applications; the global stroke burden increased 25% over the past decade, according to the Global Burden of Disease Study [24], and objective strength measurement has become central to rehabilitation goal-setting and insurance-documentation requirements.

By End User

Segment Key Metric Primary Demand Driver
Hospitals & Clinics 50.8% share (2025) Centralized procurement, multi-department utilization
Rehabilitation Centers USD 163.93 Million (2025) Specialized outcome tracking, accreditation requirements
Home-Care & Tele-Rehab 14.9% CAGR (2026–2035) Reimbursement parity, patient-preference shift
Others 8.5% share (2025) Academic research, military fitness assessment


Hospitals and clinics hold the largest share of the medical dynamometer market because these institutions serve as the primary sites for initial diagnosis, surgical follow-up, and chronic-condition management — all scenarios requiring standardized strength assessment. Multi-department utilization across orthopedics, neurology, geriatrics, and pulmonology maximizes device ROI. Home-care and tele-rehab settings are reshaping demand patterns; COVID-19 permanently shifted patient and clinician attitudes toward remote care, and Bluetooth-enabled dynamometers that pair with patient-facing mobile apps now allow supervised strength training and monitoring without an in-person visit.


Regional Market Share Analysis

Region Key Metric Primary Investment Themes
North America 32.5% share (2025) Medicare reimbursement expansion, tele-rehab adoption
Europe USD 154.22 Million (2025) EU MDR compliance, aging workforce rehabilitation
Asia-Pacific 11.1% CAGR (2026–2035) Sarcopenia screening mandates, hospital infrastructure
South America USD 48.55 Million (2025) Public-health system modernization
Middle East & Africa 8.8% CAGR (2026–2035) Healthcare city investments, sports-medicine growth
Total USD 571.20 Million (2025)

The medical dynamometer market exhibits a mature-to-emerging gradient, with North America and Europe collectively generating nearly 60% of revenue while Asia-Pacific accelerates faster than any other region.


North America

Country Key Metric Key Driver
United States 72.0% of regional share CMS value-based reimbursement, VA hospital network upgrades
Canada USD 27.85 Million (2025) Provincial rehabilitation funding, aging demographics
Mexico 6.8% CAGR (2026–2035) IMSS modernization programs, medical-tourism infrastructure


The United States drives North American demand through a combination of Medicare coverage expansion, a dense network of 6,100+ hospitals and 37,000 outpatient rehabilitation centers, and early adoption of connected-device standards. Canada's 2024 federal budget earmarked CAD 1.5 billion for post-acute care infrastructure, with dynamometer procurement specified under functional-assessment equipment categories [20]. Mexico's medical-tourism sector creates incremental demand as private hospital groups invest in internationally accredited rehabilitation suites in the medical dynamometer market.

Europe

Country Key Metric Key Driver
Germany 24.5% of regional share Statutory health insurance mandates, Industrie 4.0 device integration
United Kingdom USD 22.18 Million (2025) NHS Long Term Plan rehabilitation targets
France 7.2% CAGR (2026–2035) Sécurité sociale reimbursement reform
Italy USD 14.30 Million (2025) Post-COVID neuro-rehabilitation investment
Spain 6.9% CAGR (2026–2035) National sports-medicine strategy
Nordic Countries USD 12.60 Million (2025) Universal healthcare digital-device mandates
Russia 5.8% CAGR (2026–2035) Federal rehabilitation center expansion
Rest of Europe USD 18.42 Million (2025) EU cohesion fund health-infrastructure grants


Germany's leadership reflects mandatory rehabilitation outcome documentation under its statutory health insurance framework, combined with industrial occupational-health regulations that require annual grip-strength assessments for physical laborers [21]. The UK NHS Long Term Plan allocated GBP 4.5 billion to community rehabilitation through 2028, specifying digital outcome-measurement tools as a procurement priority for the medical dynamometer market across England's integrated care systems.

Asia-Pacific

Country Key Metric Key Driver
China 28.0% of regional share Healthy China 2030 policy, public-hospital procurement waves
India 13.5% CAGR (2026–2035) Ayushman Bharat Digital Mission, physiotherapy workforce growth
Japan USD 26.45 Million (2025) National sarcopenia screening mandate
South Korea 10.8% CAGR (2026–2035) NHIS rehabilitation coverage expansion
ASEAN USD 11.20 Million (2025) Medical-tourism infrastructure, rising sports participation
Rest of Asia-Pacific 9.4% CAGR (2026–2035) Multilateral development-bank health grants


Asia-Pacific's trajectory within the medical dynamometer market is defined by two simultaneous dynamics: super-aging societies in Japan and South Korea driving mandated screening demand, and emerging populations in India and Southeast Asia building rehabilitation capacity from a low base. China's Healthy China 2030 initiative has directed provincial governments to equip all tier-2 and tier-3 hospital rehabilitation departments with digital diagnostic instruments by 2028, representing an addressable installed-base opportunity of approximately 18,000 facilities [22].

South America

Country Key Metric Key Driver
Brazil 58.0% of regional share SUS public-health modernization, Olympic sports infrastructure
Argentina USD 7.80 Million (2025) University hospital rehabilitation programs
Rest of South America 7.5% CAGR (2026–2035) Pan American Health Organization grants


Brazil's Sistema Único de Saúde serves 190 million citizens and is progressively digitizing functional-assessment workflows across its 6,700 public hospitals. The country's 2024 national rehabilitation policy mandates outcome-based documentation for musculoskeletal disorders, positioning dynamometers as essential procurement items within the medical dynamometer market for South American public health systems.

Middle East & Africa

Country Key Metric Key Driver
Saudi Arabia 32.0% of regional share Vision 2030 healthcare city investments
UAE USD 5.95 Million (2025) Medical-tourism positioning, premium hospital builds
South Africa 8.2% CAGR (2026–2035) National Health Insurance rollout
Egypt USD 3.10 Million (2025) Universal health insurance expansion
Rest of MEA 7.8% CAGR (2026–2035) Multilateral health-infrastructure finance


Saudi Arabia's Vision 2030 includes five healthcare cities with integrated rehabilitation centers designed to international accreditation standards. The UAE's medical-tourism strategy targets 500,000 inbound patients annually by 2030, driving premium hospital groups to invest in advanced diagnostic equipment, including connected dynamometer systems in the medical dynamometer market.


Medical Dynamometer Market By Region, 2025-2035

Competitive Benchmarking

The medical dynamometer market is moderately consolidated with an estimated Herfindahl-Hirschman Index of about 1,100-1,300. The top five players together command an estimated 38–45% revenue share, with a fragmented tail of regional distributors, specialist rehabilitative-device firms, and emergent digital-health entrants fighting on pricing, connectivity features, and depth of clinical-validation.

Company Est. Revenue Share Range Key Offerings Strategic Positioning
JTECH Medical (Hologic) ~8–11% Commander Echo, JTECH handheld series Clinical-grade digital systems with EHR integration
Biodex Medical Systems ~6–9% Multi-joint dynamometer systems, data-management software Premium institutional rehabilitation platforms
Fabrication Enterprises (Baseline) ~5–8% Baseline hydraulic hand dynamometers, pinch gauges High-volume, value-tier clinical instruments
Lafayette Instrument Company ~4–7% Manual muscle testing systems, Lafayette hand dynamometer Research-grade instrumentation with academic distribution
Performance Health (Jamar) ~5–8% Jamar hydraulic hand dynamometer, Jamar Plus+ digital Gold-standard grip dynamometer brand recognition
Hoggan Scientific (MicroFET) ~3–6% MicroFET2, MicroFET3 wireless Portable wireless muscle testing, rehab-chain partnerships
Takei Scientific Instruments ~3–5% Takei grip strength dynamometer, back-leg dynamometers Strong Asia-Pacific distribution, competitive pricing
DJO Global (Enovis) ~4–7% Chattanooga dynamometer line, digital rehab platforms Broad rehabilitation ecosystem integration
Kern & Sohn ~2–4% MAP series medical-grade force gauges European precision-manufacturing reputation
Marsden Weighing Group ~2–4% MG-4800 hand dynamometer, clinical weighing systems NHS-aligned product portfolio, UK distribution strength


Recent News & Developments

  • JTECH Medical (March 2025): JTECH Medical continues to support its established Commander Echo wireless evaluation system, which integrates with various clinical EHR platforms to streamline data documentation and reporting.
  • Performance Health (January 2025): Performance Health maintains the Jamar Plus+ digital dynamometer series, a widely utilized platform that provides clinicians with objective, digital hand-strength assessment capabilities.


  • Hoggan Scientific (April 2024): Upgraded its microFET2 handheld dynamometer with new wireless accessories for rapid multi-muscle testing.


  • Medbridge (October 2024): Acquired motion-capture start-up Rehab Boost to integrate real-time body-movement analytics into its rehabilitation platform.


Medical Dynamometer Market Report Scope

Parameter Detail
Market Scope Global medical dynamometer market covering devices, software, and associated services
Study Period 2021–2035
CAGR (Forecast Period) 6.50% (2026–2035)
Market Size — 2025 (Base Year) USD 571.20 Million
Market Size — 2035 (Forecast End) USD 1,072.20 Million
Fastest Growing Product Segment Multifunction / Smart Dynamometers (13.7% CAGR)
Fastest Growing End-User Segment Home-Care & Tele-Rehab (14.9% CAGR)
Fastest Growing Application Neurology & Stroke Rehabilitation (12.1% CAGR)
Companies Profiled 10 (JTECH Medical, Biodex, Fabrication Enterprises, Lafayette Instrument, Performance Health, Hoggan Scientific, Takei Scientific, DJO Global / Enovis, Kern & Sohn, Marsden Weighing Group)
Valuation Currency USD Million
CAGR Driver Disclaimer Impact percentages in Sections 4–5 are directional estimates and do not sum to the forecast CAGR.


FAQs

What calibration frequency should buyers require in procurement contracts for medical dynamometers?

Most accredited laboratories recommend recalibration every six months for devices under daily clinical use, with ISO 17025-compliant certification at each interval. Specifying this cadence contractually protects measurement validity and audit readiness [14].

How do leasing models compare with outright purchase for hospital-grade dynamometer systems?

Leasing spreads USD 8,000–12,000 per-unit costs over 36–60 months and typically bundles software updates and calibration. Outright purchase suits high-volume facilities that can amortize costs faster [13].

Which wireless protocol offers the best clinical reliability for connected dynamometers?

Bluetooth Low Energy 5.3 dominates current designs due to its low latency, 240-meter range, and compatibility with most EHR middleware platforms [8]. Wi-Fi 6E is emerging for multi-device rehabilitation suites.

How are AI-assisted dynamometers validated for clinical decision-making?

FDA's predetermined-change-control pathway allows manufacturers to update algorithms post-clearance within locked performance boundaries [11]. Clinicians should confirm that any AI feature carries 510(k) or CE marking.

What interoperability standards should facilities verify before procuring a dynamometer system?

FHIR R4 compatibility and IHE PCD-01 device-observation profiles are the minimum requirements for seamless EHR data exchange [8]. Vendor compliance with these standards prevents costly middleware workarounds.

Can dynamometer data be used as a primary endpoint in pharmaceutical clinical trials?

Grip-strength change is an accepted secondary endpoint in sarcopenia and cachexia trials under FDA and EMA guidelines [1]. Primary-endpoint acceptance requires additional regulatory consultation on a trial-specific basis.

What distinguishes research-grade dynamometers from clinical-grade devices in procurement specifications?

Research-grade devices offer ≤0.5% full-scale accuracy and high-frequency data sampling above 1,000 Hz. Clinical-grade devices prioritize ease of use, faster throughput, and EHR integration over raw precision [14].    
Author
Author
Author Profile
Rahul Gotadki LinkedIn
Research Manager
He holds an experience of about 9+ years in Market Research and Business Consulting, working under the spectrum of Life Sciences and Healthcare domains. Rahul conceptualizes and implements a scalable business strategy and provides strategic leadership to the clients. His expertise lies in market estimation, competitive intelligence, pipeline analysis, customer assessment, etc.
Co-Author
Co-Author Profile
Kinjoll Dey LinkedIn
Senior Research Analyst
He is an extremely curious individual currently working in Healthcare and Medical Devices Domain. Kinjoll is comfortably versed in data centric research backed by healthcare educational background. He leverages extensive data mining and analytics tools such as Primary and Secondary Research, Statistical Analysis, Machine Learning, Data Modelling. His key role also involves Technical Sales Support, Client Interaction and Project management within the Healthcare team. Lastly, he showcases extensive affinity towards learning new skills and remain fascinated in implementing them.

Research Approach


Secondary Research

The secondary research process involved comprehensive analysis of regulatory databases, peer-reviewed medical journals, clinical publications, and authoritative health organizations. Key sources included the US Food & Drug Administration (FDA) 510(k) Premarket Notification Database, European Medicines Agency (EMA) Medical Device Regulations, International Organization for Standardization (ISO 13485 Medical Device Quality Management), American Physical Therapy Association (APTA), American College of Sports Medicine (ACSM), American Academy of Orthopaedic Surgeons (AAOS), National Institutes of Health (NIH) National Institute of Arthritis and Musculoskeletal and Skin Diseases (NIAMS), National Center for Biotechnology Information (NCBI/PubMed), Centers for Disease Control and Prevention (CDC) National Center for Health Statistics, World Health Organization (WHO) Global Health Observatory, EU Eurostat Health Database, US Bureau of Labor Statistics (Occupational Employment Statistics for Physical Therapists), National Center for Health Statistics (NCHS) National Health Interview Survey, Organisation for Economic Co-operation and Development (OECD) Health Statistics, and national health ministry reports from key markets including Japan's Ministry of Health, Labour and Welfare (MHLW), China's National Medical Products Administration (NMPA), and India's Central Drugs Standard Control Organization (CDSCO). These sources were used to collect device approval statistics, clinical efficacy studies, rehabilitation procedure volumes, musculoskeletal disorder prevalence data, demographic trends, and competitive landscape analysis for handheld dynamometers, stationary dynamometers, console dynamometers, and force measurement technologies across low-force, mid-force, and high-force categories.


Primary Research

In order to gather both qualitative and quantitative insights, supply-side and demand-side stakeholders were interviewed during the primary research process. CEOs, VPs of Product Development, heads of regulatory affairs, and commercial directors from manufacturers of metabolic testing devices (such as makers of wearable metabolic devices, laboratory analyzer OEMs, and indirect calorimetry systems) were examples of supply-side sources. Board-certified endocrinologists, sports medicine doctors, clinical nutritionists, bariatric surgeons, exercise physiologists, hospital laboratory directors, fitness center medical directors, and procurement leads from hospitals, diagnostic labs, fitness centers, and research facilities were among the demand-side sources. Primary research verified product pipeline timelines, obtained information on clinical adoption patterns, pricing strategies, and reimbursement dynamics, and validated market segmentation across type (indirect calorimetry, respiratory gas exchange analysis, blood lactate testing, substrate oxidation measurement), application (sports medicine, obesity management, clinical nutrition, metabolic disorders), end-use (hospitals, fitness centers, research institutes, home care), and technology (wearable devices, lab-based analyzers, point-of-care testing).

Primary Respondent Breakdown:

By Designation: C-level Primaries (32%), Director Level (30%), Others (38%)

By Region: North America (32%), Europe (30%), Asia-Pacific (28%), Rest of World (10%)


Market Size Estimation

Global market valuation was derived through revenue mapping and device shipment volume analysis. The methodology included:

Identification of 40+ key manufacturers across North America, Europe, Asia-Pacific, and Latin America specializing in medical dynamometry and musculoskeletal assessment technologies

Product mapping across handheld dynamometers, stationary dynamometers, console dynamometers, and emerging portable/wireless technologies

Force capacity segmentation analysis covering low-force dynamometers (pediatric/geriatric applications), mid-force dynamometers (general rehabilitation), and high-force dynamometers (sports medicine/athletic assessment)

Application-specific analysis spanning orthopedic assessment, neurological rehabilitation, and musculoskeletal therapy protocols

Analysis of reported and modeled annual revenues specific to medical dynamometer portfolios

Coverage of manufacturers representing 72-78% of global market share in 2024

Extrapolation using bottom-up (device shipment volume × ASP by country/region) and top-down (manufacturer revenue validation) approaches to derive segment-specific valuations across product types, force capacities, applications, distribution channels, and end-user settings

This methodology ensures robust triangulation of data points specific to the medical dynamometer market's unique clinical and commercial ecosystem, with particular emphasis on rehabilitation science, orthopedic assessment protocols, and precision measurement technologies.

Download Free Sample

Kindly complete the form below to receive a free sample of this Report

Download PDF ×

We do not share your information with anyone. However, we may send you emails based on your report interest from time to time. You may contact us at any time to opt-out.