Segmentation Quick Reference
| Dimension | Sub-Segments | Dominant Segment | Fastest Growing Segment |
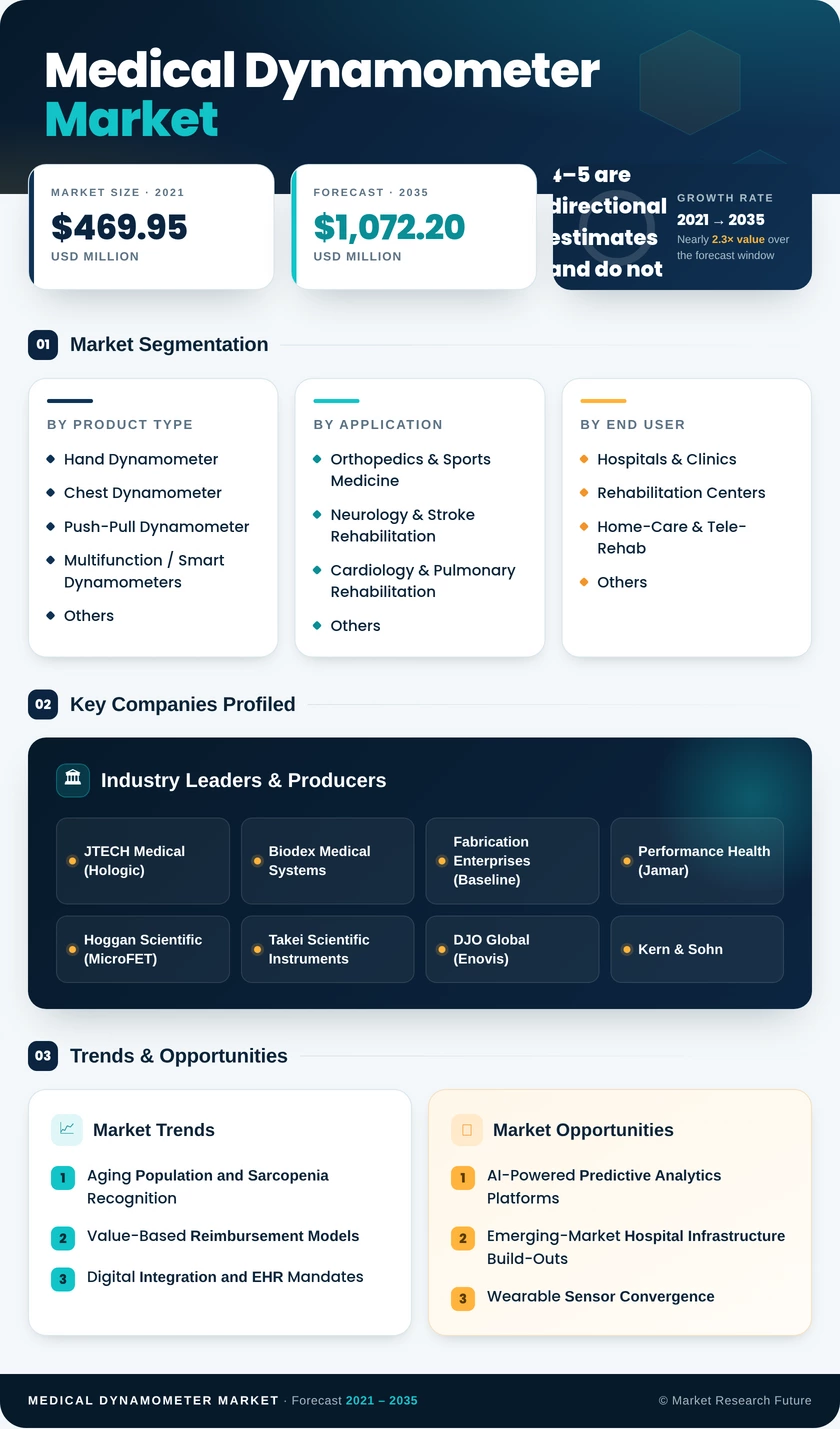
| By Product Type | Hand Dynamometer, Chest Dynamometer, Push-Pull Dynamometer, Multifunction / Smart Dynamometers, Others | Hand Dynamometer (34.0% share, 2025) | Multifunction / Smart Dynamometers (13.7% CAGR) |
| By Application | Orthopedics & Sports Medicine, Neurology & Stroke Rehabilitation, Cardiology & Pulmonary Rehabilitation, Others | Orthopedics & Sports Medicine (41.5% share, 2025) | Neurology & Stroke Rehabilitation (12.1% CAGR) |
| By End User | Hospitals & Clinics, Rehabilitation Centers, Home-Care & Tele-Rehab, Others | Hospitals & Clinics (50.8% share, 2025) | Home-Care & Tele-Rehab (14.9% CAGR) |
| By Region | North America, Europe, Asia-Pacific, South America, Middle East & Africa | North America (32.5% share, 2025) | Asia-Pacific (11.1% CAGR) |
Market Segmentation Overview
By Product Type
| Sub-Segment | Key Trend |
| Hand Dynamometer | Gold-standard grip-strength screening instrument; ubiquitous in sarcopenia and geriatric assessment protocols |
| Chest Dynamometer | Growing use in pulmonary rehabilitation and respiratory-function correlation studies |
| Push-Pull Dynamometer | Essential for orthopedic range-of-motion testing and occupational-therapy evaluations |
| Multifunction / Smart Dynamometers | Fastest-growing category driven by EHR connectivity mandates and tele-rehab platform integration |
| Others | Specialty research devices, veterinary-medicine applications, and custom industrial-ergonomics instruments |
Hand dynamometers remain the most widely procured product type due to their role as the primary sarcopenia screening tool recommended by global clinical guidelines. Multifunction and smart dynamometers are rapidly gaining ground as hospitals transition to connected-device ecosystems that require automated data capture and cloud-based analytics.
By Application
| Sub-Segment | Key Trend |
| Orthopedics & Sports Medicine | Return-to-play protocols and post-surgical strength monitoring drive consistent procurement cycles. |
| Neurology & Stroke Rehabilitation | Rising stroke incidence and motor-function recovery documentation are expanding demand rapidly. |
| Cardiology & Pulmonary Rehabilitation | Cardiac-rehab outcome documentation requirements and COPD management integrating strength data |
| Others | Geriatric wellness screening, occupational health, pediatric developmental assessment |
Orthopedics and sports medicine account for the largest application share, anchored by standardized strength-asymmetry benchmarks used in surgical recovery protocols. Neurology and stroke rehabilitation are the fastest-growing applications as aging demographics increase stroke burden globally.
By End User
| Sub-Segment | Key Trend |
| Hospitals & Clinics | Multi-department utilization across orthopedics, neurology, geriatrics, and pulmonology |
| Rehabilitation Centers | Accreditation-driven outcome tracking and specialized equipment investment |
| Home-Care & Tele-Rehab | Bluetooth-enabled devices enabling remote supervised therapy; fastest-growing end-user segment |
| Others | Academic research institutions, military fitness assessment programs and corporate wellness |
Hospitals and clinics dominate procurement volumes due to centralized purchasing power and multi-department device utilization. Home-care and tele-rehab are the fastest-growing end-user segments, driven by reimbursement parity between in-person and virtual rehabilitation sessions.