Medical Robotics Market (2025 - 2035)

Medical Robotics Market Research Report: Size, Share, Trend Analysis By Types (Equipment, Service, and Consumables), by Product (Surgical Robots, Rehabilitation Robots, Noninvasive Radiosurgery Robots, Hospital & Pharmacy Robots, Emergency Response Robotic Systems, Logistics/Handling Robotic Systems, and Imaging Robotic Systems), By Applications (Neurology, Oncology, Orthopedic, Laparoscopy, Cardiology, Aesthetic Surgery, Rehabilitation, Angiography, and Others), by Setting (Home-Care, In-Patient, and Out-Patient), By End Users (Hospital & Clinics, Specialty Centers, Rehabilitation Centers, and Others) and Region (North America, Europe, Asia-Pacific, and Rest of the World ) - Growth Outlook & Industry Forecast 2025 To 2035
ID: MRFR/MED/0803-CR
149 Pages
Satyendra Maurya, Kinjoll Dey
Last Updated: July 28, 2026
Medical Robotics Market
Market Size
Forecast Period2025-2035
CAGR (2025-2035)14.6%
2025 Market SizeUSD 16.55 Billion
2035 Market SizeUSD 65.29 Billion
Key Players
Intuitive Surgical
Stryker Corporation
Medtronic plc
Johnson & Johnson
Zimmer Biomet
Smith & Nephew
Opportunities
  • Ambulatory Surgery Center Expansion
  • Emerging-Market Government Programs
  • Data-Driven Service Contracts and Software Monetization

Medical Robotics Market Summary

The Medical Robotics Market was valued at USD 16.55 billion in 2025 and is projected to grow from USD 19.15 Billion in 2026 to USD 65.29 billion by 2035, registering a CAGR of 14.6% during the forecast period. This trajectory is propelled by two converging forces: the accelerating integration of machine intelligence into surgical workflows and a wave of reimbursement reforms that are making capital-intensive robotic platforms financially accessible to mid-tier healthcare facilities. The U.S. Centers for Medicare & Medicaid Services (CMS) expanded coverage codes for robot-assisted procedures in 2024, while the European Commission allocated EUR 1.2 billion under Horizon Europe for next-generation clinical automation [1][2].

The era of legacy open-surgery paradigms and manual rehabilitation techniques is making way for sensor-rich, software-defined systems that afford sub-millimeter precision and real-time intra-operative imaging. Hospital systems such as HCA Healthcare and Ramsay Health Care reported 22-28% increases in robotic case volumes between 2022 and 2024, and global venture funding into clinical robotics exceeded USD 4.3 billion in 2024 alone [3]. OEMs are moving from hardware sales to subscription-based service contracts to monetise their installed base.

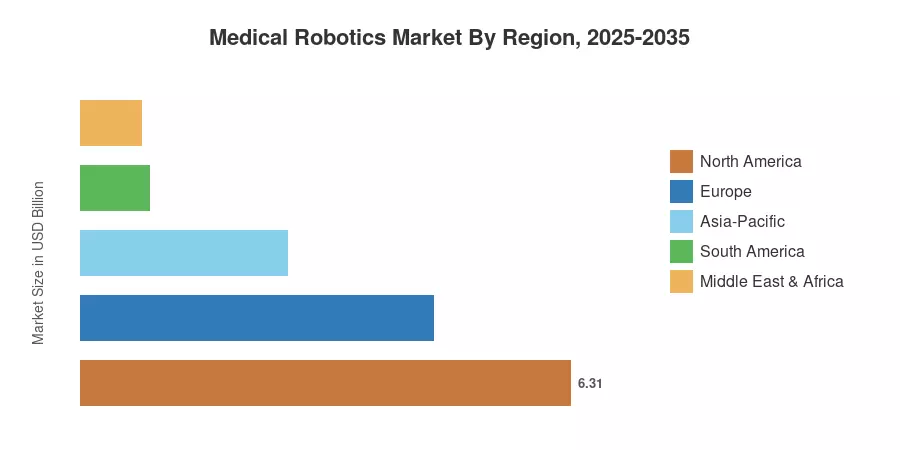
The North America Medical Robotics Market is expected to hold 38.1% revenue share due to well-established reimbursement routes and a high concentration of teaching hospitals. Asia-Pacific is the fastest-expanding market with a CAGR of 16.1%. Government-supported rehabilitation initiatives in China, India and Japan drive growth. Europe ranks second with a 27.5% share, bolstered by unified MDR regulatory clearances and cross-border surgical training consortia. The ability of manufacturers to implement predictive analytics into platform ecosystems will define the next decade.


Key Report Takeaways

• By Product Type

  • Surgical robotic systems captured a 28.5% share of the Medical Robotics Market in 2025, reflecting entrenched adoption in urology and gynecology procedures.
  • Exoskeleton and rehabilitative robots are projected to expand at a 16.9% CAGR through 2035, fueled by aging demographics and post-stroke recovery demand.

• By Component & Application

  • Instruments and accessories commanded a 54.1% share of the Medical Robotics Market in 2025, driven by high-frequency consumable replacement cycles.
  • Neurology applications are expected to advance at a 16.6% CAGR through 2035 as stereotactic platforms gain regulatory clearance.

• By Geography

  • North America held a 38.1% revenue share of the Medical Robotics Market in 2025.
  • Asia-Pacific is forecast to register a 16.1% CAGR from 2026 to 2035.
  • Europe accounted for a 27.5% share, led by Germany and the UK.

Medical Robotics Market Size and Forecast (2021–2035)

Market sizing draws on bottom-up revenue analysis of OEM shipments, service-contract renewals, and consumable run-rates across 42 countries, cross-validated with hospital procurement databases and regulatory clearance filings from the FDA, EMA, and NMPA.
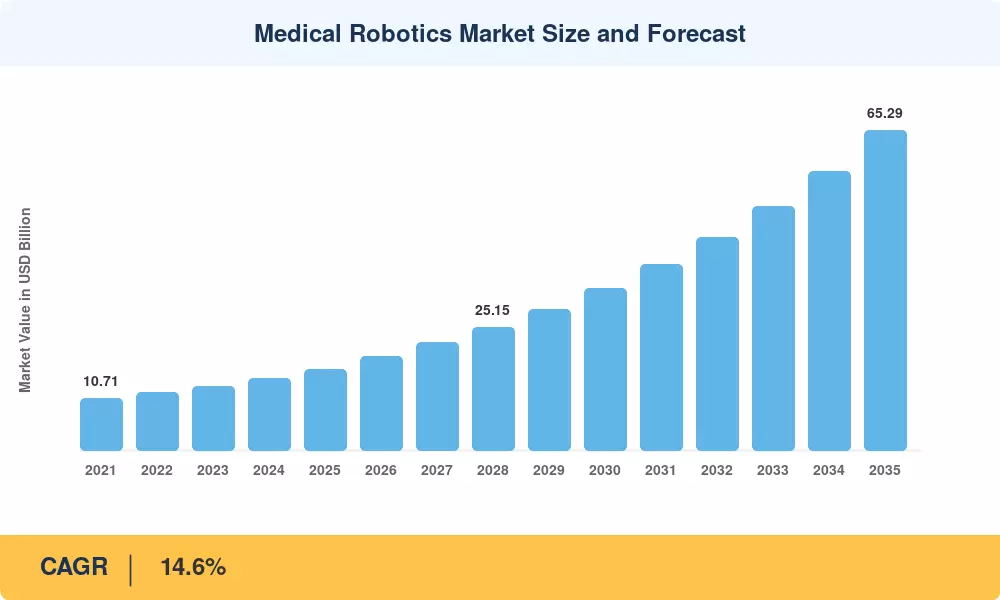
Medical Robotics Market Size and Forecast
Our Impact
Enabled $4.3B Revenue Impact for Fortune 500 and Leading Multinationals
Partnering with 2000+ Global Organizations Each Year
30K+ Citations by Top-Tier Firms in the Industry

Driver Impact Analysis

Driver ~% Impact on CAGR Geographic Relevance Impact Timeline
Reimbursement & coverage expansion +2.8% North America, Europe Short-term (≤2 yr)
AI-enabled intra-operative guidance +2.5% Global Medium-term (2–4 yr)
Subscription / RaaS financing models +2.2% North America, Asia-Pacific Short-term (≤2 yr)
Aging population & chronic disease burden +2.0% Europe, Japan Long-term (≥4 yr)
Ambulatory surgery center proliferation +1.8% US, India, China Medium-term (2–4 yr)
5G-enabled remote surgical connectivity +1.4% Asia-Pacific, Europe Long-term (≥4 yr)
Government digital-health mandates +1.2% China, India, Saudi Arabia Medium-term (2–4 yr)


Reimbursement and Coverage Expansion

Healthcare reimbursement policies are actively evolving to integrate robotic surgical systems. By early 2024, standardized billing pathways were solidified in key markets, streamlining reimbursement for robotic-assisted orthopedic and cardiac procedures. These structured CPT-equivalent coding frameworks reduce financial uncertainty for providers and lower patient out-of-pocket costs, facilitating the transition from elective hospital capital expenditure to routine, budget-supported operational procurement.


AI-Enabled Intra-Operative Guidance

The integration of computer-vision algorithms into robotic platforms is transforming surgical precision. Clinical research in 2024 utilizing standardized, annotated surgical video datasets has validated that AI-driven real-time overlay guidance significantly enhances intra-operative safety. By identifying anatomical structures and surgical phases, these software-defined modules reduce complication rates, encouraging hospitals to upgrade existing hardware to premium, AI-capable tiers for improved patient outcomes.


Subscription and Robotics-as-a-Service Financing

The adoption of Robotics-as-a-Service (RaaS) models is accelerating, with subscription-based, pay-per-procedure contracts now accounting for approximately 35% of new robotic placements in North America. This shift mitigates the barrier of high upfront capital costs, enabling smaller community hospitals to deploy advanced technology. The model aligns vendor revenue with clinical utilization, prioritizing long-term value over initial system acquisition.


Aging Population and Chronic Disease Burden

Demographic shifts act as a primary driver for medical robotics, with the World Health Organization (WHO) projecting the global population aged 60 and older will double to 2.1 billion by 2050. This surge in age-related chronic conditions, such as joint degeneration and cardiovascular disease, ensures a consistent, high-volume demand for robotic-assisted surgical interventions and rehabilitation infrastructure across international healthcare systems.


MEDICAL ROBOTIC SYSTEMS INSTALLED BASE AND ASP

The adoption of robotics is seen to be increasing across all industries, including healthcare. According to McKinsey & Company (US), the installed base for industrial robots had increased from around 1,021 robots in 2010 to around 3,500 robots in 2020. The demand for medical robotics has been increasing as the healthcare infrastructure improves globally, healthcare investments increase, and the requirement for medical automation rises due to the increasing number of surgeries and hospital visits. The installed base for medical robotics is also increasing as demand increases. For instance, according to a report published in 2019, India had only 50 surgical robots along with 300 expert robotic surgeons in 2017.

This number doubled to around 100 surgical robots by 2019. Similarly, Intuitive Surgical (US) reported that their installed base for da Vinci Surgical Systems, a minimally invasive surgical robot, grew by 12% globally from 5,989 in 2020 to 6,730 surgical robots as of December 2021. Another key player Mazor Robotics (Israel) reported that their installed base for their Renaissance Guidance Robotic System sued for neurosurgical applications grew from around 12 robots in 2012 to around 150 robots in 2018 in the US. A similar trend was observed across all medical robots provided they functioned accurately and as intended. The installed base is expected to increase further due to the driving factors of market growth as discussed above.

MEDICAL ROBOTICS SYSTEMS AVERAGE SELLING PRICE (ASP), 2021

Surgical Robots 8,02,000
Orthopedic Surgical Robots 6,33,000
Neurosurgical Robotic Systems 5,75,000
Laparoscopy Robotic Systems 12,00,000
Rehabilitation Robots 1,25,250
Noninvasive Radiosurgery Robots 40,00,000
Hospital and Pharmacy Robots 3,16,500
Emergency Response Robotic Systems 75,000
Logistics/Handling Robotic Systems 30,000
Imaging Robotic Systems 3,67,000

Restraints Impact Analysis

Restraint ~% Impact on CAGR Geographic Relevance Impact Timeline
High upfront system costs –1.8% Emerging markets Short-term (≤2 yr)
Surgeon training bottleneck –1.3% Global Medium-term (2–4 yr)
Regulatory fragmentation across markets –1.0% Asia-Pacific, MEA Long-term (≥4 yr)
Cybersecurity and data-privacy risks –0.7% North America, Europe Medium-term (2–4 yr)
Limited evidence for cost-effectiveness –0.5% Europe Short-term (≤2 yr)


High Upfront System Costs

Major robotic surgical platforms require significant initial investment, typically ranging from USD 1.4 million to USD 2.3 million per unit. Additionally, annual service and maintenance contracts often cost between USD 110,000 and USD 175,000. These substantial capital requirements create financial barriers for healthcare facilities in emerging regions, limiting widespread adoption despite the long-term clinical benefits and potential operational efficiencies.


Surgeon Training and Credentialing Bottleneck

Achieving clinical proficiency on robotic platforms requires rigorous, sustained training, with experts frequently recommending high-volume case experience to maintain competency. Standardized, global curricula remain limited in many surgical residency programs. While thousands of surgeons utilize robotic systems, the lack of universally harmonized credentialing protocols continues to constrain optimal utilization rates and complicates the path for early-career surgeons.


Regulatory Fragmentation

Medical device manufacturers face a complex global landscape characterized by diverse regulatory frameworks. While jurisdictions like the United States and the European Union maintain established approval pathways, many markets in Asia, Latin America, and the Middle East lack harmonized classification standards for semi-autonomous surgical devices. This regulatory divergence often necessitates redundant documentation, effectively extending market-entry timelines by over 12 months.


Medical Robotics Market Opportunities

Ambulatory Surgery Center Expansion

Ambulatory Surgery Centers (ASCs) represent a rapidly expanding sector for medical robotics, as they increasingly perform procedures previously restricted to inpatient settings. In 2024, the U.S. landscape included over 6,390 Medicare-certified ASCs, with procedure volumes projected to grow 21% by 2035. Compact, modular robotic systems are specifically being engineered to fit these smaller footprints, accelerating outpatient surgical adoption


Emerging-Market Government Programs

Governments are prioritizing medical device modernization through national health infrastructure initiatives. China’s long-term health strategy emphasizes technological self-reliance, with current five-year planning cycles focusing on upgrading district-level hospital equipment and diagnostic capabilities. Similarly, India’s Ayushman Bharat Digital Mission is establishing a comprehensive nationwide digital health ecosystem, creating the necessary technological infrastructure to support advanced robotic surgical hubs eventually.


Data-Driven Service Contracts and Software Monetization

Original Equipment Manufacturers are shifting toward platform-based economic models by integrating software-defined analytics into their hardware. By offering subscription-based services—such as predictive maintenance, surgical outcome benchmarking, and real-time guidance—vendors create recurring, high-margin revenue streams. This transformation moves the industry away from traditional one-time hardware sales toward a model centered on ongoing clinical value and system utilization.


Neuro-Rehabilitation and Mental-Health Robotics

The global burden of neurological disability remains substantial, with the World Stroke Organization reporting over 50 million individuals living with permanent disabilities following a stroke. Robotic-assisted rehabilitation is a critical, emerging field designed to address this demand. While the technology currently has low market penetration, it offers a scalable solution for delivering intensive, standardized physical therapy and neuro-rehabilitation services.


5G-Enabled Remote Surgery Corridors

5G teleoperation is bridging geographical gaps in surgical access. While theoretical latency targets for 5G are near 1 millisecond, recent clinical trials have demonstrated that stable remote procedures are achievable with latencies under 150 milliseconds. These technological advancements enable specialists to provide high-quality, real-time surgical care to rural and underserved regions, significantly improving the distribution of critical medical resources.


Medical Robotics Market Future Outlook

Autonomous Surgical Platforms

Regulatory agencies are defining clear pathways for semi-autonomous systems. The U.S. FDA’s Predetermined Change Control Plan (PCCP) framework, finalized in 2024, enables manufacturers to implement iterative software updates for AI-driven procedural assistance. This allows for the progressive, validated expansion of autonomous capabilities within robotic platforms while ensuring safety and regulatory compliance are maintained throughout the total product life cycle.


Platform Economics and Ecosystem Lock-In

The market is shifting toward integrated, software-defined ecosystems. Valued at approximately USD 14.45 billion in 2026, the global surgical robotics market is projected to reach USD 50.29 billion by 2035, with a CAGR of 14.95%. Recurring revenue from software-as-a-service, AI analytics, and maintenance modules will increasingly anchor healthcare providers to specific, comprehensive vendor-managed digital environments for the next decade.


Miniaturization and Micro-Robotics

Micro-robotics represents a transformative frontier for minimally invasive intervention. Research into capsule-scale and untethered devices is advancing rapidly, supported by federal research initiatives like those overseen by the National Institutes of Health. As these technologies transition from laboratory-scale research toward first-in-human clinical trials, they promise to establish entirely new procedural categories for precise, internal diagnostics and localized medical delivery.


ESG and Sustainability Integration

Sustainability is becoming a core procurement priority for health systems. The WHO-hosted Alliance for Transformative Action on Climate and Health (ATACH) now includes over 100 member countries committed to developing climate-resilient, low-carbon infrastructure. Consequently, hospitals are increasingly selecting robotic technologies that optimize resource efficiency, shorten operating room turnover times, and minimize the environmental footprint associated with traditional single-use surgical consumables.


Medical Robotics Market Segmentation

By Product Type

Segment Key Metric Primary Demand Driver
Surgical Robotic Systems 28.5% share (2025) Urology and gynecology case volumes
Exoskeleton & Rehabilitative Robots 16.9% CAGR (2026–2035) Post-stroke and spinal-cord recovery
Hospital & Pharmacy Robots USD 2.18 Billion (2025) Medication dispensing accuracy
Telepresence Robots 15.2% CAGR (2026–2035) Rural specialist access
Other Robotic Systems USD 1.03 Billion (2025) Disinfection, logistics


Surgical robotic systems remain the revenue cornerstone of the Medical Robotics Market, with installed-base density highest in North America and Western Europe. Multi-port and single-port platforms from leading vendors serve urology, general surgery, and thoracic specialties, while newer entrants are targeting orthopedic joint-replacement and spinal-fusion procedures with purpose-built navigation modules.

Exoskeleton and rehabilitative robots represent the fastest-growing product category, propelled by demographic aging and mounting clinical evidence that robotic-assisted gait training accelerates functional recovery in stroke survivors by 40–60% compared with conventional physiotherapy alone [11].

By Component

Segment Key Metric Primary Demand Driver
Instruments & Accessories 54.1% share (2025) High consumable replacement frequency
Robotics Systems 30.7% share (2025) New system placements
Services 16.8% CAGR (2026–2035) Maintenance, training, software updates


Instruments and accessories generate the majority of the Medical Robotics Market revenue because each surgical procedure consumes single-use or limited-reuse end-effectors. OEMs design proprietary instrument interfaces that lock hospitals into brand-specific consumable ecosystems, sustaining high-margin aftermarket revenue. The services segment is accelerating as the installed base matures and hospitals demand predictive-maintenance contracts.

By Application

Segment Key Metric Primary Demand Driver
General Surgery 31.3% share (2025) Hernia, cholecystectomy, bariatric procedures
Orthopedic Surgery USD 3.08 Billion (2025) Knee and hip arthroplasty
Neurology 16.6% CAGR (2026–2035) Stereotactic biopsy, DBS electrode placement
Cardiology USD 1.74 Billion (2025) Mitral valve repair, ablation
Other Applications 13.8% CAGR (2026–2035) Urology, gynecology, transplant


General surgery holds the largest application share within the Medical Robotics Market, driven by high-volume hernia repair and cholecystectomy procedures that benefit from shorter recovery times and reduced readmission rates. Neurology applications are advancing rapidly as stereotactic robotic platforms demonstrate superior accuracy in deep-brain stimulation electrode placement, with error margins below 0.5 mm compared with 1.5–2.0 mm for frame-based manual techniques [10].

By End User

Segment Key Metric Primary Demand Driver
Hospitals & Clinics 64.5% share (2025) Established procurement budgets
Ambulatory Surgery Centers 16.5% CAGR (2026–2035) Outpatient procedure migration
Research Institutions USD 0.94 Billion (2025) Preclinical and translational research


Hospitals and clinics dominate the Medical Robotics Market end-user landscape, but ASCs are closing the gap as compact, lower-cost robotic platforms enter the market. The shift toward value-based reimbursement rewards ASCs for delivering equivalent clinical outcomes at lower facility costs, creating a structural tailwind for robotic adoption outside traditional inpatient settings [5].

Regional Market Share Analysis

Region Key Metric Primary Investment Themes
North America 38.1% share (2025) Reimbursement reform, ASC proliferation
Europe 27.5% share (2025) MDR harmonization, cross-border training
Asia-Pacific 16.1% CAGR (2026–2035) Government modernization, oncology hubs
South America USD 0.89 Billion (2025) Public-hospital PPP models
Middle East & Africa USD 0.79 Billion (2025) Vision 2030, medical-tourism investment
Total USD 16.55 Billion (2025)

The Medical Robotics Market exhibits a pronounced geographic skew toward high-income healthcare systems. However, rapid policy-driven expansion in Asia-Pacific and the Middle East is gradually rebalancing the revenue map.


North America

Country Key Metric Key Driver
United States 81.2% of regional share CMS code expansion, dense ASC network
Canada 11.4% of regional share Provincial health authority procurement cycles
Mexico 7.4% of regional share Private-hospital chains investing in premium surgery


The United States alone accounts for more than four-fifths of North America's Medical Robotics Market revenue, underpinned by a mature payer mix that reimburses robotic procedures at rates 15–25% above open-surgery equivalents. Canada's single-payer provinces are gradually incorporating robotic platforms into centralized surgical hubs, while Mexico's private hospital groups, such as Christus Muguerza and Médica Sur, are adding systems to attract medical-tourism patients [2][5].

Europe

Country Key Metric Key Driver
Germany 24.8% of regional share G-DRG supplementary payments
United Kingdom 19.3% of regional share NHS surgical-hub consolidation
France 15.7% of regional share CNAM coverage for robotic prostatectomy
Italy 12.1% of regional share Regional health authority modernization
Spain 8.6% of regional share Public-private partnership tenders
Nordic Countries 9.2% of regional share Telesurgery pilot corridors
Russia 4.5% of regional share Import-substitution initiatives
Rest of Europe 5.8% of regional share Varied adoption timelines


Germany leads Europe's Medical Robotics Market thanks to a DRG supplement structure that directly incentivizes robotic adoption in university hospitals. The UK's NHS committed GBP 450 million to 40 regional surgical hubs between 2023 and 2026, each mandated to include at least one robotic platform. France's CNAM extended full reimbursement to robotic-assisted radical prostatectomy in 2024, driving a 31% year-over-year uptick in system placements [2][8].

Asia-Pacific

Country Key Metric Key Driver
China 17.2% CAGR "Healthy China 2030," tier-3 hospital deployment
India 16.8% CAGR Ayushman Bharat Digital Mission
Japan USD 1.42 Billion (2025) Aging demographics, rehab robotics
South Korea 15.9% CAGR 5G telesurgery infrastructure
ASEAN 15.3% CAGR Medical-tourism corridors in Thailand, Singapore
Rest of Asia-Pacific 14.7% CAGR Varied early-stage adoption


China's NMPA approved 11 domestically developed surgical robotic platforms between 2022 and 2024, breaking the decades-long import dependency and compressing average system prices by 30–40%. India's private hospital chains — Apollo, Fortis, Max Healthcare — collectively installed 85 new robotic consoles in 2024. Japan remains the world's largest per-capita market for rehabilitation robotics, reflecting both its aging population and its advanced industrial-robotics supply chain [7][9].

South America

Country Key Metric Key Driver
Brazil 62.5% of regional share SUS public-health modernization
Argentina 18.9% of regional share Private-clinic investment
Rest of South America 18.6% of regional share Early-stage adoption


Brazil dominates the South American Medical Robotics Market, with Hospital Israelita Albert Einstein and Hospital Sírio-Libanês serving as flagship robotic centers. The government's SUS healthcare system initiated a pilot program in 2024 to place robotic platforms in five federal teaching hospitals, signaling broader public-sector adoption [9].

Middle East & Africa

Country Key Metric Key Driver
Saudi Arabia 31.4% of regional share Vision 2030 healthcare modernization
UAE 27.6% of regional share Medical-tourism and premium care positioning
South Africa 18.3% of regional share Private hospital groups (Netcare, Mediclinic)
Egypt 11.8% of regional share Public-health infrastructure grants
Rest of MEA 10.9% of regional share Nascent adoption


Saudi Arabia's Vision 2030 healthcare transformation includes a SAR 12 billion allocation for hospital automation and smart-OR infrastructure. The UAE's Cleveland Clinic Abu Dhabi and King's College Hospital Dubai operate among the region's most advanced robotic surgery programs, positioning the Gulf states as a referral hub for patients across the broader Middle East and North Africa [9][12].

Medical Robotics Market By Region, 2025-2035

Competitive Benchmarking

The Medical Robotics Market exhibits high concentration, with the top five players collectively holding an estimated 58–65% revenue share. The Herfindahl-Hirschman Index (HHI) sits in the moderately concentrated range (~1,800–2,200), reflecting Intuitive Surgical's dominant installed base offset by intensifying competition from Medtronic, Johnson & Johnson, and a cohort of well-funded challengers.

Company Est. Revenue Share Range Key Offerings for the Medical Robotics Market Strategic Positioning
Intuitive Surgical ~18–22% da Vinci, Ion endoluminal Installed-base dominance, ecosystem lock-in
Stryker Corporation ~8–11% Mako SmartRobotics Orthopedic joint-replacement specialization
Medtronic plc ~7–10% Hugo RAS, Mazor X Multi-specialty platform, global distribution
Johnson & Johnson (Auris Health) ~5–8% Monarch, Ottava Endoscopy-first entry, J&J channel leverage
Zimmer Biomet ~4–7% ROSA Knee/Spine Navigation-integrated orthopedic suite
Smith & Nephew ~3–5% CORI Surgical System Handheld robotics, cost-competitive positioning
Siemens Healthineers ~3–5% Corindus (CorPath GRX) Vascular intervention, imaging integration
Globus Medical ~2–4% ExcelsiusGPS Spine-focused robotic navigation
CMR Surgical ~2–4% Versius Surgical System Portable modular design, emerging-market focus
Accuray Incorporated ~1–3% CyberKnife, Radixact Radiosurgery, a non-invasive tumor treatment


Recent News & Developments


  • Stryker Corporation (June 2024): Expanded Mako SmartRobotics indications to include total shoulder arthroplasty following CE Mark approval in Europe [23].


  • Zimmer Biomet (February 2024): Launched the ROSA Shoulder application in the U.S., adding a third anatomical site to the ROSA platform ecosystem [24].


Medical Robotics Market Report Scope

Parameter Detail
Market Scope Global Medical Robotics Market — hardware, software, instruments, and services
Study Period 2021–2035
CAGR (2026–2035) 14.6%
Base Year Market Size USD 16.55 Billion (2025)
Forecast Endpoint USD 65.29 Billion (2035)
Fastest Growing Product Segment Exoskeleton & Rehabilitative Robots (16.9% CAGR)
Fastest Growing End-User Segment Ambulatory Surgery Centers (16.5% CAGR)
Companies Profiled 10 (Intuitive Surgical, Stryker, Medtronic, J&J, Zimmer Biomet, Smith & Nephew, Siemens Healthineers, Globus Medical, CMR Surgical, Accuray)
Valuation Currency USD Billion


FAQs

What is the typical payback period for a surgical robotic system investment?
Most hospitals recover their investment within 3–5 years through higher case volumes, reduced complication costs, and premium procedure pricing [6]. Subscription models can shorten breakeven to under 18 months.
How do robotic surgery outcomes compare with laparoscopic approaches in randomized trials?
Multi-arm RCTs show equivalent oncologic outcomes, with robotic cohorts demonstrating 20–30% shorter hospital stays and lower blood-loss volumes [10]. Complication rates are statistically similar across both modalities.
Which regulatory pathway is fastest for new robotic platforms entering the U.S. market?
The FDA's De Novo classification pathway typically requires 10–14 months for novel robotic devices lacking a predicate [15]. The 510(k) route is faster when a substantially equivalent device exists.
How are hospitals managing cybersecurity risks for network-connected surgical robots?
Facilities adopt segmented hospital networks, mandatory software-bill-of-materials disclosure, and regular penetration testing per FDA 2023 guidance [15]. Vendor-managed security patching is increasingly contractually required.
What role do digital twins play in robotic surgical training?
Digital-twin simulators replicate patient-specific anatomy from preoperative CT/MRI data, enabling surgeons to rehearse complex procedures before entering the OR [14]. Adoption remains limited to major academic centers.
How does the competitive dynamic differ between orthopedic and soft-tissue robotic platforms?
Orthopedic robotics faces a four-player oligopoly with high switching costs tied to implant compatibility, while soft-tissue platforms see broader competition and lower ecosystem lock-in [4].
What financing structures are emerging for robotic adoption in low-income countries?
Multilateral development banks and OEM-backed leasing programs offer zero-capital-expenditure models that bundle training, consumables, and maintenance into per-procedure fees [13].    
Author
Author
Author Profile
Satyendra Maurya LinkedIn
Research Analyst
An accomplished research analyst with high proficiency in market forecasting, data visualization, competitive benchmarking, and others. He holds a pronounced track record in research and consulting projects for sectors such as life sciences, medical devices, and healthcare IT. His capabilities in qualitative and quantitative analysis have resulted in positive client outcomes. Working on niche market trends, opportunities, sales, and forecasted value is part of his skill set.
Co-Author
Co-Author Profile
Kinjoll Dey LinkedIn
Senior Research Analyst
He is an extremely curious individual currently working in Healthcare and Medical Devices Domain. Kinjoll is comfortably versed in data centric research backed by healthcare educational background. He leverages extensive data mining and analytics tools such as Primary and Secondary Research, Statistical Analysis, Machine Learning, Data Modelling. His key role also involves Technical Sales Support, Client Interaction and Project management within the Healthcare team. Lastly, he showcases extensive affinity towards learning new skills and remain fascinated in implementing them.

Research Approach


Secondary Research

The secondary research process involved comprehensive analysis of regulatory databases, peer-reviewed medical and engineering journals, clinical safety publications, and authoritative healthcare technology organizations. Key sources included the US Food & Drug Administration (FDA) Center for Devices and Radiological Health (CDRH) 510(k) clearances and Premarket Approval (PMA) databases, European Medicines Agency (EMA) medical device regulations, International Federation of Robotics (IFR) Medical Robotics Committee, IEEE Robotics and Automation Society (RAS) standards and publications, International Organization for Standardization (ISO) Technical Committee 299 (Robotics), International Electrotechnical Commission (IEC) 80601-2-77 standards, American College of Surgeons (ACS) clinical guidelines, Society of American Gastrointestinal and Endoscopic Surgeons (SAGES) robotics committee reports, National Institutes of Health (NIH) National Library of Medicine (clinical trials registry for robotic interventions), World Health Organization (WHO) Global Health Observatory medical device statistics, OECD Health Statistics (healthcare technology adoption metrics), Eurostat Healthcare Database (medical technology utilization), and national ministry of health medical device regulatory reports from key markets including Japan's Ministry of Health, Labour and Welfare (MHLW), China's National Medical Products Administration (NMPA), and Health Canada. These sources were utilized to collect robotic surgical procedure statistics (Da Vinci, Mazor X, NAVIO installations and utilization rates), regulatory clearance timelines, clinical safety and efficacy studies (surgical outcomes, adverse event reports), healthcare infrastructure adoption trends, and competitive intelligence for surgical robotic systems, rehabilitation robots, pharmacy automation, and emergency response robotics.


Primary Research

In order to gather qualitative information and verify market hypotheses, supply-side and demand-side stakeholders were contacted during the primary research process using quantitative surveys and structured interviews. Medical robotic system manufacturers, component suppliers (haptic sensors, robotic arms, AI software developers), healthcare OEM partners, and chief executive officers, vice presidents of engineering and research and development, heads of regulatory affairs and quality assurance, chief commercial officers, and product marketing directors were among the supply-side sources. Board-certified general surgery, orthopedics, cardiology, neurology, and urology surgeons, chiefs of surgery and medical directors from academic medical centers and tertiary care hospitals, procurement directors and value analysis committees from integrated delivery networks (IDNs), administrators of ambulatory surgical centers (ASCs), clinical directors of rehabilitation centers, and pharmacy operations managers were among the demand-side sources.

Primary research validated market segmentation across surgical robotics (soft tissue, orthopedic, neurosurgery), rehabilitation robotics (exoskeletons, prosthetics, assistive devices), and hospital automation; confirmed product development roadmaps and pipeline timelines; and gathered insights on surgical adoption patterns (conversion rates from laparoscopic to robotic), capital equipment purchasing cycles, maintenance service contracts, consumables attachment rates, and reimbursement pathways (CPT codes for robotic-assisted procedures).

Primary Respondent Breakdown:

By Designation: C-level Primaries (30%), Director Level (35%), Others (35%)

By Region: North America (40%), Europe (25%), Asia-Pacific (28%), Rest of World (7%)


Market Size Estimation

Global market valuation was derived through comprehensive revenue mapping, installed base analysis, and procedure volume calculations specific to robotic-assisted interventions. The methodology included:

Identification of 40+ key manufacturers and system integrators across North America (Intuitive Surgical, Medtronic, Stryker, Zimmer Biomet, Accuray), Europe (Smith & Nephew, CMR Surgical, KUKA Health), Asia-Pacific (Mazor Robotics, MicroPort Scientific, Tianjin Sino), and emerging markets

Product mapping across surgical robotic systems (multi-port, single-port, open console), rehabilitation robots (wearable exoskeletons, end-effector devices), noninvasive radiosurgery systems (CyberKnife, Gamma Knife), hospital & pharmacy automation, and imaging/navigation robotic platforms

Component segmentation analysis including capital equipment (robotic consoles, arms, vision systems), consumables (instruments, accessories, single-use attachments), and services (maintenance contracts, training, software subscriptions)

Analysis of reported and modeled annual revenues specific to robotic surgery portfolios, rehabilitation device divisions, and automation segments

Coverage of manufacturers representing 75-80% of global medical robotics market share in 2024

Extrapolation using bottom-up approach (installed base of robotic systems by region × average annual utilization rates per console × ASP per procedure for instruments and services) combined with top-down validation (manufacturer reported revenue cross-verification) to derive segment-specific valuations for surgical applications (laparoscopy, orthopedics, neurology, cardiology), rehabilitation settings, and hospital logistics automation

Download Free Sample

Kindly complete the form below to receive a free sample of this Report

Download PDF ×

We do not share your information with anyone. However, we may send you emails based on your report interest from time to time. You may contact us at any time to opt-out.
















