Request Free Sample ×

Kindly complete the form below to receive a free sample of this Report

* Please use a valid business email

Leading companies partner with us for data-driven Insights

clients tt-cursor
Hero Background

MENA Recycled Paper Pulp Tissue Market

ID: MRFR/CG/61748-CR
200 Pages
Pradeep Nandi
Last Updated: April 06, 2026
MEA Recycled Pulp Tissue Market Size, Share, Industry Trend & Analysis Research Report Information by Product Type (Toilet Paper, Facial Tissues, Napkins Tissues, Wet Tissues/Wipes, Specialty Tissues, Others), by Material Type (Cardboard, Newspaper and Magazine, Office Waste, Industrial Waste), by End User (Residential, Commercial (Hotels/Restaurants, Healthcare Facilities, Offices, Educational Institutes)), by Distribution Channel (Supermarkets/Hypermarkets, Convenience Stores, Online/E-Commerce, Specialty Stores, Wholesale Stores, Others (B2B, Distributors)) and Country (GCC Countries (UAE, Saudi Arabia, Kuwait and Oman), Algeria, Bahrain, Egypt, Iran, Iraq, South Africa, Nigeria, Kenya, Ghana, Turkey, Rest of Middle East & Africa)-Forecast till 2035
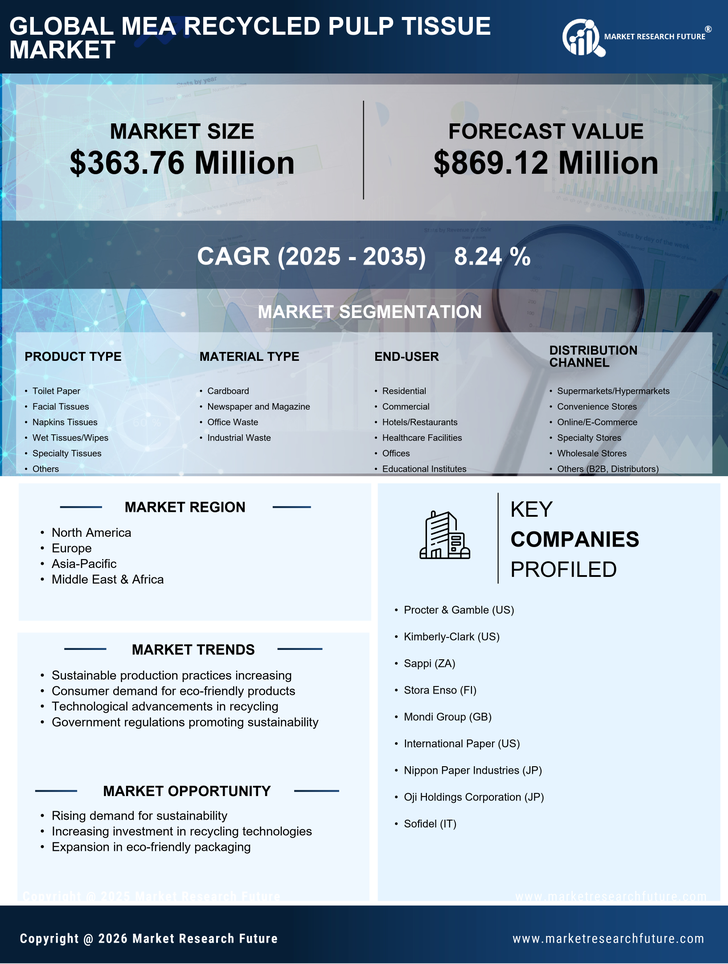
Download PDF ×

We do not share your information with anyone. However, we may send you emails based on your report interest from time to time. You may contact us at any time to opt-out.

  1. 1 SECTION I: EXECUTIVE SUMMARY AND KEY HIGHLIGHTS
    1. 1.1 EXECUTIVE SUMMARY
      1. 1.1.1 Market Overview
      2. 1.1.2 Key Findings
      3. 1.1.3 Market Segmentation
      4. 1.1.4 Competitive Landscape
      5. 1.1.5 Challenges and Opportunities
      6. 1.1.6 Future Outlook
  2. 2 SECTION II: SCOPING, METHODOLOGY AND MARKET STRUCTURE
    1. 2.1 MARKET INTRODUCTION
      1. 2.1.1 Definition
      2. 2.1.2 Scope of the study
        1. 2.1.2.1 Research Objective
        2. 2.1.2.2 Assumption
        3. 2.1.2.3 Limitations
    2. 2.2 RESEARCH METHODOLOGY
      1. 2.2.1 Overview
      2. 2.2.2 Data Mining
      3. 2.2.3 Secondary Research
      4. 2.2.4 Primary Research
        1. 2.2.4.1 Primary Interviews and Information Gathering Process
        2. 2.2.4.2 Breakdown of Primary Respondents
      5. 2.2.5 Forecasting Model
      6. 2.2.6 Market Size Estimation
        1. 2.2.6.1 Bottom-Up Approach
        2. 2.2.6.2 Top-Down Approach
      7. 2.2.7 Data Triangulation
      8. 2.2.8 Validation
  3. 3 SECTION III: QUALITATIVE ANALYSIS
    1. 3.1 MARKET DYNAMICS
      1. 3.1.1 Overview
      2. 3.1.2 Drivers
      3. 3.1.3 Restraints
      4. 3.1.4 Opportunities
    2. 3.2 MARKET FACTOR ANALYSIS
      1. 3.2.1 Value chain Analysis
      2. 3.2.2 Porter's Five Forces Analysis
        1. 3.2.2.1 Bargaining Power of Suppliers
        2. 3.2.2.2 Bargaining Power of Buyers
        3. 3.2.2.3 Threat of New Entrants
        4. 3.2.2.4 Threat of Substitutes
        5. 3.2.2.5 Intensity of Rivalry
      3. 3.2.3 COVID-19 Impact Analysis
        1. 3.2.3.1 Market Impact Analysis
        2. 3.2.3.2 Regional Impact
        3. 3.2.3.3 Opportunity and Threat Analysis
  4. 4 SECTION IV: QUANTITATIVE ANALYSIS
    1. 4.1 Consumer and Retail, BY Application (USD Billion)
      1. 4.1.1 Household
      2. 4.1.2 Commercial
      3. 4.1.3 Industrial
      4. 4.1.4 Institutional
    2. 4.2 Consumer and Retail, BY Product Type (USD Billion)
      1. 4.2.1 Facial Tissue
      2. 4.2.2 Toilet Tissue
      3. 4.2.3 Paper Towels
      4. 4.2.4 Napkins
    3. 4.3 Consumer and Retail, BY End Use (USD Billion)
      1. 4.3.1 Food Service
      2. 4.3.2 Healthcare
      3. 4.3.3 Hospitality
      4. 4.3.4 Retail
    4. 4.4 Consumer and Retail, BY Material Source (USD Billion)
      1. 4.4.1 Post-Consumer Waste
      2. 4.4.2 Post-Industrial Waste
      3. 4.4.3 Mixed Paper
  5. 5 SECTION V: COMPETITIVE ANALYSIS
    1. 5.1 Competitive Landscape
      1. 5.1.1 Overview
      2. 5.1.2 Competitive Analysis
      3. 5.1.3 Market share Analysis
      4. 5.1.4 Major Growth Strategy in the Consumer and Retail
      5. 5.1.5 Competitive Benchmarking
      6. 5.1.6 Leading Players in Terms of Number of Developments in the Consumer and Retail
      7. 5.1.7 Key developments and growth strategies
        1. 5.1.7.1 New Product Launch/Service Deployment
        2. 5.1.7.2 Merger & Acquisitions
        3. 5.1.7.3 Joint Ventures
      8. 5.1.8 Major Players Financial Matrix
        1. 5.1.8.1 Sales and Operating Income
        2. 5.1.8.2 Major Players R&D Expenditure. 2023
    2. 5.2 Company Profiles
      1. 5.2.1 Procter & Gamble (US)
        1. 5.2.1.1 Financial Overview
        2. 5.2.1.2 Products Offered
        3. 5.2.1.3 Key Developments
        4. 5.2.1.4 SWOT Analysis
        5. 5.2.1.5 Key Strategies
      2. 5.2.2 Kimberly-Clark (US)
        1. 5.2.2.1 Financial Overview
        2. 5.2.2.2 Products Offered
        3. 5.2.2.3 Key Developments
        4. 5.2.2.4 SWOT Analysis
        5. 5.2.2.5 Key Strategies
      3. 5.2.3 Sappi (ZA)
        1. 5.2.3.1 Financial Overview
        2. 5.2.3.2 Products Offered
        3. 5.2.3.3 Key Developments
        4. 5.2.3.4 SWOT Analysis
        5. 5.2.3.5 Key Strategies
      4. 5.2.4 Stora Enso (FI)
        1. 5.2.4.1 Financial Overview
        2. 5.2.4.2 Products Offered
        3. 5.2.4.3 Key Developments
        4. 5.2.4.4 SWOT Analysis
        5. 5.2.4.5 Key Strategies
      5. 5.2.5 Mondi Group (GB)
        1. 5.2.5.1 Financial Overview
        2. 5.2.5.2 Products Offered
        3. 5.2.5.3 Key Developments
        4. 5.2.5.4 SWOT Analysis
        5. 5.2.5.5 Key Strategies
      6. 5.2.6 International Paper (US)
        1. 5.2.6.1 Financial Overview
        2. 5.2.6.2 Products Offered
        3. 5.2.6.3 Key Developments
        4. 5.2.6.4 SWOT Analysis
        5. 5.2.6.5 Key Strategies
      7. 5.2.7 Smurfit Kappa (IE)
        1. 5.2.7.1 Financial Overview
        2. 5.2.7.2 Products Offered
        3. 5.2.7.3 Key Developments
        4. 5.2.7.4 SWOT Analysis
        5. 5.2.7.5 Key Strategies
      8. 5.2.8 Nippon Paper Industries (JP)
        1. 5.2.8.1 Financial Overview
        2. 5.2.8.2 Products Offered
        3. 5.2.8.3 Key Developments
        4. 5.2.8.4 SWOT Analysis
        5. 5.2.8.5 Key Strategies
      9. 5.2.9 Oji Holdings Corporation (JP)
        1. 5.2.9.1 Financial Overview
        2. 5.2.9.2 Products Offered
        3. 5.2.9.3 Key Developments
        4. 5.2.9.4 SWOT Analysis
        5. 5.2.9.5 Key Strategies
    3. 5.3 Appendix
      1. 5.3.1 References
      2. 5.3.2 Related Reports
  6. 6 LIST OF FIGURES
    1. 6.1 MARKET SYNOPSIS
    2. 6.2 MEA MARKET ANALYSIS BY APPLICATION
    3. 6.3 MEA MARKET ANALYSIS BY PRODUCT TYPE
    4. 6.4 MEA MARKET ANALYSIS BY END USE
    5. 6.5 MEA MARKET ANALYSIS BY MATERIAL SOURCE
    6. 6.6 KEY BUYING CRITERIA OF CONSUMER AND RETAIL
    7. 6.7 RESEARCH PROCESS OF MRFR
    8. 6.8 DRO ANALYSIS OF CONSUMER AND RETAIL
    9. 6.9 DRIVERS IMPACT ANALYSIS: CONSUMER AND RETAIL
    10. 6.10 RESTRAINTS IMPACT ANALYSIS: CONSUMER AND RETAIL
    11. 6.11 SUPPLY / VALUE CHAIN: CONSUMER AND RETAIL
    12. 6.12 CONSUMER AND RETAIL, BY APPLICATION, 2024 (% SHARE)
    13. 6.13 CONSUMER AND RETAIL, BY APPLICATION, 2024 TO 2035 (USD Billion)
    14. 6.14 CONSUMER AND RETAIL, BY PRODUCT TYPE, 2024 (% SHARE)
    15. 6.15 CONSUMER AND RETAIL, BY PRODUCT TYPE, 2024 TO 2035 (USD Billion)
    16. 6.16 CONSUMER AND RETAIL, BY END USE, 2024 (% SHARE)
    17. 6.17 CONSUMER AND RETAIL, BY END USE, 2024 TO 2035 (USD Billion)
    18. 6.18 CONSUMER AND RETAIL, BY MATERIAL SOURCE, 2024 (% SHARE)
    19. 6.19 CONSUMER AND RETAIL, BY MATERIAL SOURCE, 2024 TO 2035 (USD Billion)
    20. 6.20 BENCHMARKING OF MAJOR COMPETITORS
  7. 7 LIST OF TABLES
    1. 7.1 LIST OF ASSUMPTIONS
  8. 7.1.1
    1. 7.2 MEA MARKET SIZE ESTIMATES; FORECAST
      1. 7.2.1 BY APPLICATION, 2026-2035 (USD Billion)
      2. 7.2.2 BY PRODUCT TYPE, 2026-2035 (USD Billion)
      3. 7.2.3 BY END USE, 2026-2035 (USD Billion)
      4. 7.2.4 BY MATERIAL SOURCE, 2026-2035 (USD Billion)
    2. 7.3 PRODUCT LAUNCH/PRODUCT DEVELOPMENT/APPROVAL
  9. 7.3.1
    1. 7.4 ACQUISITION/PARTNERSHIP
  10. 7.4.1

MEA Consumer and Retail Market Segmentation

Consumer and Retail By Application (USD Billion, 2026-2035)

  • Household
  • Commercial
  • Industrial
  • Institutional

Consumer and Retail By Product Type (USD Billion, 2026-2035)

  • Facial Tissue
  • Toilet Tissue
  • Paper Towels
  • Napkins

Consumer and Retail By End Use (USD Billion, 2026-2035)

  • Food Service
  • Healthcare
  • Hospitality
  • Retail

Consumer and Retail By Material Source (USD Billion, 2026-2035)

  • Post-Consumer Waste
  • Post-Industrial Waste
  • Mixed Paper