• Cat-intel
  • MedIntelliX
  • Resources
  • About Us
  • Hero Background
    English
    Chinese
    French
    Japanese
    Korean
    German
    Spanish

    Multi Layer Cryogenic Insulation Market Analysis

    ID: MRFR/CnM/9308-HCR
    100 Pages
    Anshula Mandaokar
    October 2025

    Multi-Layer Cryogenic Insulation Market Research Report Information By PU & PIR, Cellular Glass, Polystrene, Fiberglass, Perlite, Others) End Use (Energy & Power, Chemicals, Metallurgical, Electronics, Shipping Others) Forecast till 2035

    Share:
    Download PDF ×

    We do not share your information with anyone. However, we may send you emails based on your report interest from time to time. You may contact us at any time to opt-out.

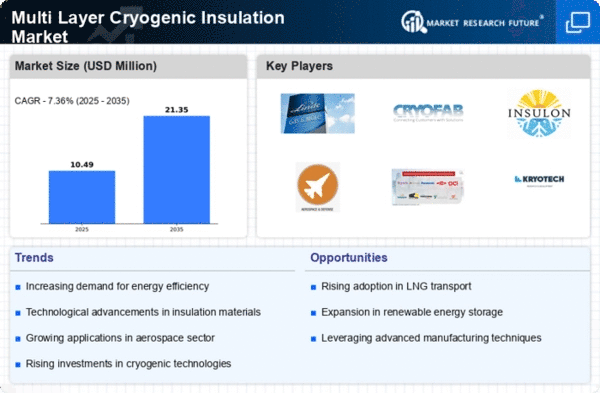
    Multi Layer Cryogenic Insulation Market Infographic
    $ 4,950.0
    $ 5,950.0
    $ 7,250.0

    Market Analysis

    In-depth Analysis of Multi Layer Cryogenic Insulation Market Industry Landscape

    The multi-layer cryogenic insulation marketplace is being propelled by rising demand for cryogenically cooled systems used in various industries such as aerospace medicine or even energy where efficient thermal management plays key role. Cryogenic insulations are essential for maintaining ultra-low temperatures required by liquefied gases like nitrogen oxide or methane. Owing to the increased space craft industry which uses this technology extensively hence promoting its growth; therefore, making it one of the most dynamic sectors within this space in “emerging” markets. Market adoption rates for advanced multilayered super-insulation concepts depend on how well constructors need to protect fragile components from severe changes in temperature while going through space exploration. The healthcare sector considerably influences changes in multi-layer cryogenic insulation market dynamics, especially in relation to storage and transportation of biological and medical gases. Cryogenic insulation helps in the conservation of cryopreserved tissues, stem cells, as well as medicines at temperatures below zero. Consequently, the increasing need for proper cryogenic insulation systems used in medical applications is expected to influence the market. Furthermore, the multi-layer cryogenic insulation market is also influenced by the energy sector due to LNG’s (liquefied natural gas) and other types of fuel that are kept under cryogenic temperatures. To prevent heat ingress while maintaining desired low temperatures, it is vital that the latter are efficiently insulated from their surroundings whenever they should be stored or transported. In addition, this gives rise to a growing demand for effective multi-layered super-insulation concepts within energy industrial which has been embracing LNG as an alternative clean source of power generation. The high-tech materials for coolers on the market have changed such dynamics in recent years. On-going development works are concentrating on novel insulating materials with high thermal resistance and optimization of multi-layer configurations. Innovations towards overall improvement into insulation systems include reflective foils, aerogels, vacuum isolation panels which can address various needs required in different areas applying subzero temperature technologies generally. Nevertheless, the multi-layer cryogenic insulation industry faces several challenges including cost implications, space limitations and constant need for innovation. Development and implementation of advanced insulation solutions can have higher initial costs especially for companies dealing with cryogenic system performances in critical industries. Further, there are design problems for compact and efficient multilayer insulation systems due to limited floor areas of satellite spacecrafts or medical storage facilities. Market pressure requires continuous innovation as a trade-off between performance and price efficiency is addressed. Research and development (R&D) activities significantly contribute to changing dynamics in the multi-layer cryogenic insulation market. Ongoing efforts focus on improving thermal conductivity within these materials, developing new aerogel formulations, and enhancing flexibility particularly in different applications of these insulation systems. Innovations in cryogenic testing methods coupled with simulation techniques facilitate the development of suitable insulation solutions that meet diverse industry requirements. The research into sustainable and eco-friendly insulating materials reflects the industry’s commitment towards responsible and green practices.

    Market Summary

    The Global Multi-layer cryogenic insulation market is projected to grow from 1.01 USD Billion in 2024 to 2.11 USD Billion by 2035.

    Key Market Trends & Highlights

    Multi-layer cryogenic insulation market Key Trends and Highlights

    • The market is expected to witness a compound annual growth rate (CAGR) of 6.91% from 2025 to 2035.
    • By 2035, the market valuation is anticipated to reach 2.11 USD Billion, indicating robust growth.
    • In 2024, the market is valued at 1.01 USD Billion, reflecting a strong starting point for future expansion.
    • Growing adoption of multi-layer cryogenic insulation due to increasing demand for energy-efficient solutions is a major market driver.

    Market Size & Forecast

    2024 Market Size 1.01 (USD Million)
    2035 Market Size 2.11 (USD Million)
    CAGR (2025-2035) 6.91%
    Largest Regional Market Share in 2024 latin_america)

    Major Players

    Armacell International Holding GmbH, Lydall Inc., Cabot Corporation, Technifab Products, Dunmore Corporation, NICHIAS Corporation, Aspen Aerogels, Owens Corning, Isolatie Combinatie Beverwijk B.V., Abhijit Enterprises

    Market Trends

    The increasing demand for energy-efficient solutions in various industries appears to drive the adoption of multi-layer cryogenic insulation technologies, which may enhance thermal performance and reduce energy consumption.

    U.S. Department of Energy

    Multi Layer Cryogenic Insulation Market Market Drivers

    Market Trends and Projections

    Growth in Cryogenic Applications

    The expansion of cryogenic applications in sectors like healthcare, aerospace, and energy is propelling the Global Multi-layer cryogenic insulation market Industry forward. For instance, the use of cryogenic technology in medical applications, such as the storage of biological samples, necessitates reliable insulation to maintain low temperatures. Additionally, the aerospace sector increasingly relies on cryogenic fuels, which require robust insulation systems to ensure safety and efficiency. This growing reliance on cryogenic applications is expected to contribute to the market's growth, with projections indicating a rise to 2.11 USD Billion by 2035.

    Rising Demand for Energy Efficiency

    The Global Multi-layer cryogenic insulation market Industry is experiencing a surge in demand driven by the increasing focus on energy efficiency across various sectors. Industries such as aerospace, liquefied natural gas, and cryogenic storage are adopting advanced insulation technologies to minimize energy losses. This trend is particularly evident as companies seek to comply with stringent energy regulations and reduce operational costs. The market is projected to reach 1.01 USD Billion in 2024, reflecting a growing recognition of the importance of effective insulation solutions in enhancing energy efficiency.

    Increasing Investments in LNG Infrastructure

    The Global Multi-layer cryogenic insulation market Industry is being bolstered by rising investments in liquefied natural gas (LNG) infrastructure. As countries aim to transition to cleaner energy sources, the demand for LNG is escalating, necessitating advanced insulation solutions for storage and transportation. The construction of new LNG terminals and expansion of existing facilities require effective cryogenic insulation to ensure safety and efficiency. This trend is expected to drive market growth, as investments in LNG infrastructure continue to rise, aligning with global energy transition goals.

    Regulatory Support for Cryogenic Technologies

    Government regulations promoting the use of cryogenic technologies are playing a crucial role in the Global Multi-layer cryogenic insulation market Industry. Policies aimed at reducing greenhouse gas emissions and enhancing energy efficiency are encouraging industries to adopt advanced insulation solutions. For example, regulations in the energy sector are pushing companies to implement better insulation in cryogenic applications to comply with environmental standards. This regulatory support is likely to foster market growth, as industries seek to align with governmental initiatives and invest in innovative insulation technologies.

    Technological Advancements in Insulation Materials

    Innovations in insulation materials are significantly influencing the Global Multi-layer cryogenic insulation market Industry. The development of advanced materials, such as aerogels and vacuum insulation panels, enhances thermal performance and reduces weight, making them ideal for cryogenic applications. These technological advancements not only improve insulation efficiency but also expand the range of applications across various industries. As manufacturers continue to invest in research and development, the market is likely to benefit from these innovations, potentially leading to a compound annual growth rate of 6.91% from 2025 to 2035.

    Market Segment Insights

    Regional Insights

    Key Companies in the Multi Layer Cryogenic Insulation Market market include

    Industry Developments

    Future Outlook

    Multi Layer Cryogenic Insulation Market Future Outlook

    The Multi-layer cryogenic insulation market is projected to grow at a 6.91% CAGR from 2024 to 2035, driven by advancements in aerospace applications, energy efficiency demands, and increased LNG transportation.

    New opportunities lie in:

    • Develop innovative insulation materials for aerospace applications to enhance performance.
    • Expand production capabilities to meet rising demand in LNG transport sectors.
    • Invest in R&D for sustainable insulation solutions to capture eco-conscious markets.

    By 2035, the Multi-layer cryogenic insulation market is expected to achieve robust growth, reflecting evolving industry needs.

    Market Segmentation

    Report Overview:

    Intended Audience
    • Energy & Power Companies
    • Metallurgical Companies
    • Shipping Companies
    • Space Companies
    • Research Institutes
    • Academic Institutes
    • Government Organizations
    Objectives of the Study
    • To get a comprehensive overview of the global Multi-layer cryogenic insulation market
    • To get wide-ranging information about the key factors driving the market and market opportunities
    • To gain information regarding the key players in the industry, their product portfolio, strategies, and key developments
    • To gain insights about the key country/region in which the market is growing

    Report Scope

    Report Attribute/Metric Details
      Market Size   2030: USD 1,522.78 Million
      CAGR   6.70% CAGR (2022-2030)
      Base Year   2021
      Forecast Period   2022-2030
      Historical Data   2018
      Forecast Units    Value (USD Million)
      Report Coverage  Revenue Forecast, Competitive Landscape, Growth Factors, and Trends
      Segments Covered   Type and End-use
      Geographies Covered   North America, Europe, Asia-Pacific, Latin America, and the Middle East and Africa
      Key Vendors   Armacell International Holding GmbH (Germany), Lydall Inc. (US), Cabot Corporation (US), Technifab Products (US), Dunmore Corporation (US), NICHIAS Corporation (Japan), Aspen Aerogels (US), Owens Corning (US), Isolatie Combinatie Beverwijk B.V. (Netherland), and Abhijit Enterprises (India)
      Key Market Opportunities   • Increasing use of cryogenic insulation in space application
      Key Market Drivers   • Rising demand for LNG as fuel • Use of superinsulation in storage and transportation of gases such as oxygen and nitrogen • Use of cryogenic insulation in the shipping industry Increasing environmental regulations • Degrading quality of crude oil

    Market Highlights

    Author

    Anshula Mandaokar
    Team Lead - Research

    She holds an experience of about 6+ years in market research and business consulting, working under the spectrum of information communication technology, telecommunications and semiconductor domains. aarti conceptualizes and implements a scalable business strategy and provides strategic leadership to the clients. her expertise lies in market estimation, competitive intelligence, pipeline analysis, customer assessment, etc.

    Leave a Comment

    Latest Comments

    John Doe
    john@example.com

    This is a great article! Really helped me understand the topic better.

    Posted on July 23, 2025, 10:15 AM
    Jane Smith
    jane@domain.com

    Thanks for sharing this. I’ve bookmarked it for later reference.

    Posted on July 22, 2025, 7:45 PM

    FAQs

    What growth rate global Multi-layer cryogenic insulation market would register in the future?

    The global Multi-layer cryogenic insulation market would register a growth of 6.70%.

    Which industry will play a crucial role in taking the Multi-layer cryogenic insulation market ahead??

    The energy & power industry will play a prominent role in taking the market forward.

    What is the key restraining factor for the global Multi-layer cryogenic insulation market?

    Volatile raw material prices could restrain the market.

    Which region would enjoy the upper hand in the Multi-layer cryogenic insulation market?

    North America would enjoy the upper hand in the Multi-layer cryogenic insulation market.

    Which Asia-Pacific country would set the trend in the Multi-layer cryogenic insulation market?

    China, as the largest consumer, would set the trend.

    1. Table of Contents
    2. Executive Summary 16
      1. MARKET ATTRACTIVENESS ANALYSIS 18
        1. GLOBAL MULTI-LAYER CRYOGENIC INSULATION MARKET, BY TYPE 19
        2. GLOBAL MULTI-LAYER CRYOGENIC INSULATION MARKET, BY END USE 20
        3. GLOBAL MULTI-LAYER CRYOGENIC INSULATION MARKET, BY REGION 21
    3. Market Introduction 22
      1. DEFINITION 22
      2. Scope of the Study 22
      3. MARKET STRUCTURE 23
    4. Research Methodology 24
      1. RESEARCH PROCESS 24
      2. PRIMARY RESEARCH 25
      3. SECONDARY RESEARCH 26
      4. MARKET SIZE ESTIMATION 27
      5. TOP-DOWN AND Bottom-up Approach 27
      6. FORECAST MODEL 28
      7. LIST OF ASSUMPTIONS & LIMITATIONS 29
    5. MARKET DYNAMICS 30
      1. INTRODUCTION 30
      2. DRIVERS 31
        1. RISING DEMAND FOR LNG AS FUEL 31
        2. USE OF SUPERINSULATION IN STORAGE AND TRANSPORTATION OF GASES SUCH AS OXYGEN AND NITROGEN 31
        3. USE OF CRYOGENIC INSULATION IN THE SHIPPING INDUSTRY 32
      3. RESTRAINTS 33
        1. VOLATILE RAW MATERIAL PRICES 33
      4. OPPORTUNITIES 34
        1. INCREASING USE OF CRYOGENIC INSULATION IN SPACE APPLICATIONS 34
      5. TREND 35
        1. APPLICATIONS IN SUPERCONDUCTING DEVICES 35
    6. MARKET FACTOR ANALYSIS 36
      1. SUPPLY CHAIN ANALYSIS 36
        1. RAW MATERIAL SUPPLIERS 37
        2. MULTI-LAYER CRYOGENIC INSULATION PRODUCERS 38
        3. DISTRIBUTION & SALES CHANNEL 38
        4. END USE 38
      2. Porter's Five Forces Analysis 40
        1. THREAT OF NEW ENTRANTS 41
        2. BARGAINING POWER OF SUPPLIERS 41
        3. THREAT OF SUBSTITUTES 41
        4. BARGAINING POWER OF BUYERS 41
        5. INTENSITY OF RIVALRY 41
      3. AVERAGE SELLING PRICING OVERVIEW, 2019-2021 (USD/SQ. METERS) 42
        1. AVERAGE SELLING PRICING OVERVIEW, BY REGION 42
      4. IMPACT OF COVID 19 OUTBREAK ON GLOBAL MULTI-LAYER CRYOGENIC INSULATION MARKET 42
        1. IMPACT ON GLOBAL ECONOMY 42
        2. IMPACT ON SUPPLY CHAIN OF MULTI-LAYER CRYOGENIC INSULATION MARKET 42
        3. MAJOR GOVERNMENT POLICIES TO COUNTER THE IMPACT OF COVID-19 43
        4. QUALITATIVE ANALYSIS ON CHANGES IN DEMAND FROM END USERS 47
    7. GLOBAL MULTI-LAYER CRYOGENIC INSULATION MARKET, BY TYPE 49
      1. INTRODUCTION 49
      2. PU & PIR 52
      3. CELLULAR GLASS 54
      4. POLYSTYRENE 55
      5. FIBERGLASS 56
      6. PERLITE 57
      7. OTHERS 58
    8. GLOBAL MULTI-LAYER CRYOGENIC INSULATION MARKET, BY END USE 59
      1. INTRODUCTION 59
      2. ENERGY & POWER 62
      3. CHEMICALS 64
      4. METALLURGICAL 65
      5. ELECTRONICS 66
      6. SHIPPING 67
      7. OTHERS 68
    9. GLOBAL MULTI-LAYER CRYOGENIC INSULATION MARKET, BY REGION 69
      1. INTRODUCTION 69
      2. NORTH AMERICA 73
        1. US 77
        2. CANADA 79
      3. EUROPE 81
        1. GERMANY 85
        2. UK 87
        3. FRANCE 89
        4. SPAIN 91
        5. ITALY 93
        6. REST OF EUROPE 95
      4. ASIA-PACIFIC 97
        1. CHINA 101
        2. JAPAN 103
        3. INDIA 105
        4. SOUTH KOREA 107
        5. AUSTRALIA & NEW ZEALAND 109
        6. REST OF ASIA-PACIFIC 111
      5. LATIN AMERICA 113
        1. BRAZIL 117
        2. MEXICO 119
        3. ARGENTINA 121
        4. REST OF LATIN AMERICA 123
      6. MIDDLE EAST & AFRICA 125
        1. GCC COUNTRIES 129
        2. SOUTH AFRICA 131
        3. REST OF THE MIDDLE EAST & AFRICA 133
    10. Competitive Landscape 135
      1. COMPETITIVE OVERVIEW 135
      2. MARKET STRATEGY ANALYSIS 135
      3. KEY DEVELOPMENTS 136
      4. COMPETITIVE BENCHMARKING 137
    11. COMPANY PROFILES 138
      1. ARMACELL INTERNATIONAL HOLDING GMBH 138
        1. COMPANY OVERVIEW 138
        2. FINANCIAL OVERVIEW 139
        3. PRODUCTS OFFERED 139
        4. KEY DEVELOPMENTS 140
        5. SWOT ANALYSIS 140
        6. KEY STRATEGIES 140
      2. LYDALL INC. 141
        1. COMPANY OVERVIEW 141
        2. FINANCIAL OVERVIEW 142
        3. PRODUCTS OFFERED 142
        4. KEY DEVELOPMENTS 143
        5. SWOT ANALYSIS 143
        6. KEY STRATEGIES 143
      3. CABOT CORPORATION 144
        1. COMPANY OVERVIEW 144
        2. FINANCIAL OVERVIEW 145
        3. PRODUCTS OFFERED 145
        4. KEY DEVELOPMENTS 146
        5. SWOT ANALYSIS 146
        6. KEY STRATEGIES 146
      4. TECHNIFAB PRODUCTS 147
        1. COMPANY OVERVIEW 147
        2. FINANCIAL OVERVIEW 147
        3. PRODUCTS OFFERED 147
        4. KEY DEVELOPMENTS 148
        5. SWOT ANALYSIS 148
        6. KEY STRATEGIES 148
      5. OWENS CORNING 149
        1. COMPANY OVERVIEW 149
        2. FINANCIAL OVERVIEW 150
        3. PRODUCTS OFFERED 151
        4. KEY DEVELOPMENTS 151
        5. SWOT ANALYSIS 151
        6. KEY STRATEGIES 152
      6. NICHIA CORPORATION 153
        1. COMPANY OVERVIEW 153
        2. FINANCIAL OVERVIEW 153
        3. PRODUCT OFFERINGS 153
        4. KEY DEVELOPMENTS 153
        5. SWOT ANALYSIS 154
        6. KEY STRATEGIES 154
      7. DUNMORE 155
        1. COMPANY OVERVIEW 155
        2. FINANCIAL OVERVIEW 156
        3. PRODUCT OFFERINGS 157
        4. KEY DEVELOPMENTS 157
        5. SWOT ANALYSIS 158
        6. KEY STRATEGIES 158
      8. ASPEN AEROGELS 159
        1. COMPANY OVERVIEW 159
        2. FINANCIAL OVERVIEW 160
        3. PRODUCT OFFERINGS 160
        4. KEY DEVELOPMENTS 161
        5. SWOT ANALYSIS 161
        6. KEY STRATEGIES 161
      9. ISOLATIE COMBINATIE BEVERWIJK B.V. 162
        1. COMPANY OVERVIEW 162
        2. FINANCIAL OVERVIEW 162
        3. PRODUCT OFFERINGS 162
        4. KEY DEVELOPMENTS 162
        5. SWOT ANALYSIS 163
        6. KEY STRATEGIES 163
      10. ABHIJIT ENTERPRISES 164
        1. COMPANY OVERVIEW 164
        2. FINANCIAL OVERVIEW 164
        3. PRODUCT OFFERINGS 164
        4. KEY DEVELOPMENTS 164
        5. SWOT ANALYSIS 165
        6. KEY STRATEGIES 165
    12. APPENDIX 166
      1. REFERENCES 166
      2. RELATED REPORTS 167
    13. List of Tables and Figures
      1. LIST OF TABLES
      2. TABLE 1 LIST OF ASSUMPTIONS & LIMITATIONS 29
      3. TABLE 2 LIST OF END USES, BY REGION 39
      4. TABLE 3 PRICING OVERVIEW, BY REGION 42
      5. TABLE 4 GLOBAL MULTI-LAYER CRYOGENIC INSULATION, BY TYPE, 2019–2028 (USD MILLION) 50
      6. TABLE 5 GLOBAL MULTI-LAYER CRYOGENIC INSULATION MARKET, BY TYPE, 2019–2028 (MILLION SQ. METERS) 51
      7. TABLE 6 GLOBAL MULTI-LAYER CRYOGENIC INSULATION MARKET FOR PU & PIR, BY REGION, 2019–2028 (USD MILLION) 52
      8. TABLE 7 GLOBAL MULTI-LAYER CRYOGENIC INSULATION MARKET FOR PU & PIR, BY REGION, 2019–2028 (MILLION SQ. METERS) 53
      9. TABLE 8 GLOBAL MULTI-LAYER CRYOGENIC INSULATION MARKET FOR CELLULAR GLASS, BY REGION, 2019–2028 (USD MILLION) 54
      10. TABLE 9 GLOBAL MULTI-LAYER CRYOGENIC INSULATION MARKET FOR CELLULAR GLASS, BY REGION, 2019–2028 (MILLION SQ. METERS) 54
      11. TABLE 10 GLOBAL MULTI-LAYER CRYOGENIC INSULATION MARKET FOR POLYSTYRENE, BY REGION, 2019–2028 (USD MILLION) 55
      12. TABLE 11 GLOBAL MULTI-LAYER CRYOGENIC INSULATION MARKET FOR POLYSTYRENE, BY REGION, 2019–2028 (MILLION SQ. METERS) 55
      13. TABLE 12 GLOBAL MULTI-LAYER CRYOGENIC INSULATION MARKET FOR FIBERGLASS, BY REGION, 2019–2028 (USD MILLION) 56
      14. TABLE 13 GLOBAL MULTI-LAYER CRYOGENIC INSULATION MARKET FOR FIBERGLASS, BY REGION, 2019–2028 (MILLION SQ. METERS) 56
      15. TABLE 14 GLOBAL MULTI-LAYER CRYOGENIC INSULATION MARKET FOR PERLITE, BY REGION, 2019–2028 (USD MILLION) 57
      16. TABLE 15 GLOBAL MULTI-LAYER CRYOGENIC INSULATION MARKET FOR PERLITE, BY REGION, 2019–2028 (MILLION SQ. METERS) 57
      17. TABLE 16 GLOBAL MULTI-LAYER CRYOGENIC INSULATION MARKET FOR OTHERS, BY REGION, 2019–2028 (USD MILLION) 58
      18. TABLE 17 GLOBAL MULTI-LAYER CRYOGENIC INSULATION MARKET FOR OTHERS, BY REGION, 2019–2028 (MILLION SQ. METERS) 58
      19. TABLE 18 GLOBAL MULTI-LAYER CRYOGENIC INSULATION, BY END USE, 2019–2028 (USD MILLION) 60
      20. TABLE 19 GLOBAL MULTI-LAYER CRYOGENIC INSULATION MARKET, BY END USE, 2019–2028 (MILLION SQ. METERS) 61
      21. TABLE 20 GLOBAL MULTI-LAYER CRYOGENIC INSULATION MARKET FOR ENERGY & POWER, BY REGION, 2019–2028 (USD MILLION) 62
      22. TABLE 21 GLOBAL MULTI-LAYER CRYOGENIC INSULATION MARKET FOR ENERGY & POWER, BY REGION, 2019–2028 (MILLION SQ. METERS) 63
      23. TABLE 22 GLOBAL MULTI-LAYER CRYOGENIC INSULATION MARKET FOR CHEMICALS, BY REGION, 2019–2028 (USD MILLION) 64
      24. TABLE 23 GLOBAL MULTI-LAYER CRYOGENIC INSULATION MARKET FOR CHEMICALS, BY REGION, 2019–2028 (MILLION SQ. METERS) 64
      25. TABLE 24 GLOBAL MULTI-LAYER CRYOGENIC INSULATION MARKET FOR METALLURGICAL, BY REGION, 2019–2028 (USD MILLION) 65
      26. TABLE 25 GLOBAL MULTI-LAYER CRYOGENIC INSULATION MARKET FOR METALLURGICAL, BY REGION, 2019–2028 (MILLION SQ. METERS) 65
      27. TABLE 26 GLOBAL MULTI-LAYER CRYOGENIC INSULATION MARKET FOR ELECTRONICS, BY REGION, 2019–2028 (USD MILLION) 66
      28. TABLE 27 GLOBAL MULTI-LAYER CRYOGENIC INSULATION MARKET FOR ELECTRONICS, BY REGION, 2019–2028 (MILLION SQ. METERS) 66
      29. TABLE 28 GLOBAL MULTI-LAYER CRYOGENIC INSULATION MARKET FOR SHIPPING, BY REGION, 2019–2028 (USD MILLION) 67
      30. TABLE 29 GLOBAL MULTI-LAYER CRYOGENIC INSULATION MARKET FOR SHIPPING, BY REGION, 2019–2028 (MILLION SQ. METERS) 67
      31. TABLE 30 GLOBAL MULTI-LAYER CRYOGENIC INSULATION MARKET FOR OTHERS, BY REGION, 2019–2028 (USD MILLION) 68
      32. TABLE 31 GLOBAL MULTI-LAYER CRYOGENIC INSULATION MARKET FOR OTHERS, BY REGION, 2019–2028 (MILLION SQ. METERS) 68
      33. TABLE 32 GLOBAL MULTI-LAYER CRYOGENIC INSULATION MARKET, BY REGION, 2019–2028 (USD MILLION) 71
      34. TABLE 33 GLOBAL MULTI-LAYER CRYOGENIC INSULATION MARKET, BY REGION, 2019–2028 (MILLION SQ. METERS) 72
      35. TABLE 34 NORTH AMERICA MULTI-LAYER CRYOGENIC INSULATION MARKET, BY COUNTRY, 2019–2028 (USD MILLION) 74
      36. TABLE 35 NORTH AMERICA MULTI-LAYER CRYOGENIC INSULATION MARKET, BY COUNTRY, 2019–2028 (MILLION SQ. METERS) 74
      37. TABLE 36 NORTH AMERICA MULTI-LAYER CRYOGENIC INSULATION MARKET, BY TYPE, 2019–2028 (USD MILLION) 75
      38. TABLE 37 NORTH AMERICA MULTI-LAYER CRYOGENIC INSULATION MARKET, BY TYPE, 2019–2028 (MILLION SQ. METERS) 75
      39. TABLE 38 NORTH AMERICA MULTI-LAYER CRYOGENIC INSULATION MARKET, BY END USE, 2019–2028 (USD MILLION) 76
      40. TABLE 39 NORTH AMERICA MULTI-LAYER CRYOGENIC INSULATION MARKET, BY END USE, 2019–2028 (MILLION SQ. METERS) 76
      41. TABLE 40 US MULTI-LAYER CRYOGENIC INSULATION MARKET, BY TYPE, 2019–2028 (USD MILLION) 77
      42. TABLE 41 US MULTI-LAYER CRYOGENIC INSULATION MARKET, BY TYPE, 2019–2028 (MILLION SQ. METERS) 77
      43. TABLE 42 US MULTI-LAYER CRYOGENIC INSULATION MARKET, BY END USE, 2019–2028 (USD MILLION) 78
      44. TABLE 43 US MULTI-LAYER CRYOGENIC INSULATION MARKET, BY END USE, 2019–2028 (MILLION SQ. METERS) 78
      45. TABLE 44 CANADA MULTI-LAYER CRYOGENIC INSULATION MARKET, BY TYPE, 2019–2028 (USD MILLION) 79
      46. TABLE 45 CANADA MULTI-LAYER CRYOGENIC INSULATION MARKET, BY TYPE, 2019–2028 (MILLION SQ. METERS) 79
      47. TABLE 46 CANADA MULTI-LAYER CRYOGENIC INSULATION MARKET, BY END USE, 2019–2028 (USD MILLION) 80
      48. TABLE 47 CANADA MULTI-LAYER CRYOGENIC INSULATION MARKET, BY END USE, 2019–2028 (MILLION SQ. METERS) 80
      49. TABLE 48 EUROPE MULTI-LAYER CRYOGENIC INSULATION MARKET, BY COUNTRY, 2019–2028 (USD MILLION) 82
      50. TABLE 49 EUROPE MULTI-LAYER CRYOGENIC INSULATION MARKET, BY COUNTRY, 2019–2028 (MILLION SQ. METERS) 82
      51. TABLE 50 EUROPE MULTI-LAYER CRYOGENIC INSULATION MARKET, BY TYPE, 2019–2028 (USD MILLION) 83
      52. TABLE 51 EUROPE MULTI-LAYER CRYOGENIC INSULATION MARKET, BY TYPE, 2019–2028 (MILLION SQ. METERS) 83
      53. TABLE 52 EUROPE MULTI-LAYER CRYOGENIC INSULATION MARKET, BY END USE, 2019–2028 (USD MILLION) 84
      54. TABLE 53 EUROPE MULTI-LAYER CRYOGENIC INSULATION MARKET, BY END USE, 2019–2028 (MILLION SQ. METERS) 84
      55. TABLE 54 GERMANY MULTI-LAYER CRYOGENIC INSULATION MARKET, BY TYPE, 2019–2028 (USD MILLION) 85
      56. TABLE 55 GERMANY MULTI-LAYER CRYOGENIC INSULATION MARKET, BY TYPE, 2019–2028 (MILLION SQ. METERS) 85
      57. TABLE 56 GERMANY MULTI-LAYER CRYOGENIC INSULATION MARKET, BY END USE, 2019–2028 (USD MILLION) 86
      58. TABLE 57 GERMANY MULTI-LAYER CRYOGENIC INSULATION MARKET, BY END USE, 2019–2028 (MILLION SQ. METERS) 86
      59. TABLE 58 UK MULTI-LAYER CRYOGENIC INSULATION MARKET, BY TYPE, 2019–2028 (USD MILLION) 87
      60. TABLE 59 UK MULTI-LAYER CRYOGENIC INSULATION MARKET, BY TYPE, 2019–2028 (MILLION SQ. METERS) 87
      61. TABLE 60 UK MULTI-LAYER CRYOGENIC INSULATION MARKET, BY END USE, 2019–2028 (USD MILLION) 88
      62. TABLE 61 UK MULTI-LAYER CRYOGENIC INSULATION MARKET, BY END USE, 2019–2028 (MILLION SQ. METERS) 88
      63. TABLE 62 FRANCE MULTI-LAYER CRYOGENIC INSULATION MARKET, BY TYPE, 2019–2028 (USD MILLION) 89
      64. TABLE 63 FRANCE MULTI-LAYER CRYOGENIC INSULATION MARKET, BY TYPE, 2019–2028 (MILLION SQ. METERS) 89
      65. TABLE 64 FRANCE MULTI-LAYER CRYOGENIC INSULATION MARKET, BY END USE, 2019–2028 (USD MILLION) 90
      66. TABLE 65 FRANCE MULTI-LAYER CRYOGENIC INSULATION MARKET, BY END USE, 2019–2028 (MILLION SQ. METERS) 90
      67. TABLE 66 SPAIN MULTI-LAYER CRYOGENIC INSULATION MARKET, BY TYPE, 2019–2028 (USD MILLION) 91
      68. TABLE 67 SPAIN MULTI-LAYER CRYOGENIC INSULATION MARKET, BY TYPE, 2019–2028 (MILLION SQ. METERS) 91
      69. TABLE 68 SPAIN MULTI-LAYER CRYOGENIC INSULATION MARKET, BY END USE, 2019–2028 (USD MILLION) 92
      70. TABLE 69 SPAIN MULTI-LAYER CRYOGENIC INSULATION MARKET, BY END USE, 2019–2028 (MILLION SQ. METERS) 92
      71. TABLE 70 ITALY MULTI-LAYER CRYOGENIC INSULATION MARKET, BY TYPE, 2019–2028 (USD MILLION) 93
      72. TABLE 71 ITALY MULTI-LAYER CRYOGENIC INSULATION MARKET, BY TYPE, 2019–2028 (MILLION SQ. METERS) 93
      73. TABLE 72 ITALY MULTI-LAYER CRYOGENIC INSULATION MARKET, BY END USE, 2019–2028 (USD MILLION) 94
      74. TABLE 73 ITALY MULTI-LAYER CRYOGENIC INSULATION MARKET, BY END USE, 2019–2028 (MILLION SQ. METERS) 94
      75. TABLE 74 REST OF EUROPE MULTI-LAYER CRYOGENIC INSULATION MARKET, BY TYPE, 2019–2028 (USD MILLION) 95
      76. TABLE 75 REST OF EUROPE MULTI-LAYER CRYOGENIC INSULATION MARKET, BY TYPE, 2019–2028 (MILLION SQ. METERS) 95
      77. TABLE 76 REST OF EUROPE MULTI-LAYER CRYOGENIC INSULATION MARKET, BY END USE, 2019–2028 (USD MILLION) 96
      78. TABLE 77 REST OF EUROPE MULTI-LAYER CRYOGENIC INSULATION MARKET, BY END USE, 2019–2028 (MILLION SQ. METERS) 96
      79. TABLE 78 ASIA-PACIFIC MULTI-LAYER CRYOGENIC INSULATION MARKET, BY COUNTRY, 2019–2028 (USD MILLION) 98
      80. TABLE 79 ASIA-PACIFIC MULTI-LAYER CRYOGENIC INSULATION MARKET, BY COUNTRY, 2019–2028 (MILLION SQ. METERS) 98
      81. TABLE 80 ASIA-PACIFIC MULTI-LAYER CRYOGENIC INSULATION MARKET, BY TYPE, 2019–2028 (USD MILLION) 99
      82. TABLE 81 ASIA-PACIFIC MULTI-LAYER CRYOGENIC INSULATION MARKET, BY TYPE, 2019–2028 (MILLION SQ. METERS) 99
      83. TABLE 82 ASIA-PACIFIC MULTI-LAYER CRYOGENIC INSULATION MARKET, BY END USE, 2019–2028 (USD MILLION) 100
      84. TABLE 83 ASIA-PACIFIC MULTI-LAYER CRYOGENIC INSULATION MARKET, BY END USE, 2019–2028 (MILLION SQ. METERS) 100
      85. TABLE 84 CHINA MULTI-LAYER CRYOGENIC INSULATION MARKET, BY TYPE, 2019–2028 (USD MILLION) 101
      86. TABLE 85 CHINA MULTI-LAYER CRYOGENIC INSULATION MARKET, BY TYPE, 2019–2028 (MILLION SQ. METERS) 101
      87. TABLE 86 CHINA MULTI-LAYER CRYOGENIC INSULATION MARKET, BY END USE, 2019–2028 (USD MILLION) 102
      88. TABLE 87 CHINA MULTI-LAYER CRYOGENIC INSULATION MARKET, BY END USE, 2019–2028 (MILLION SQ. METERS) 102
      89. TABLE 88 JAPAN MULTI-LAYER CRYOGENIC INSULATION MARKET, BY TYPE, 2019–2028 (USD MILLION) 103
      90. TABLE 89 JAPAN MULTI-LAYER CRYOGENIC INSULATION MARKET, BY TYPE, 2019–2028 (MILLION SQ. METERS) 103
      91. TABLE 90 JAPAN MULTI-LAYER CRYOGENIC INSULATION MARKET, BY END USE, 2019–2028 (USD MILLION) 104
      92. TABLE 91 JAPAN MULTI-LAYER CRYOGENIC INSULATION MARKET, BY END USE, 2019–2028 (MILLION SQ. METERS) 104
      93. TABLE 92 INDIA MULTI-LAYER CRYOGENIC INSULATION MARKET, BY TYPE, 2019–2028 (USD MILLION) 105
      94. TABLE 93 INDIA MULTI-LAYER CRYOGENIC INSULATION MARKET, BY TYPE, 2019–2028 (MILLION SQ. METERS) 105
      95. TABLE 94 INDIA MULTI-LAYER CRYOGENIC INSULATION MARKET, BY END USE, 2019–2028 (USD MILLION) 106
      96. TABLE 95 INDIA MULTI-LAYER CRYOGENIC INSULATION MARKET, BY END USE, 2019–2028 (MILLION SQ. METERS) 106
      97. TABLE 96 SOUTH KOREA MULTI-LAYER CRYOGENIC INSULATION MARKET, BY TYPE, 2019–2028 (USD MILLION) 107
      98. TABLE 97 SOUTH KOREA MULTI-LAYER CRYOGENIC INSULATION MARKET, BY TYPE, 2019–2028 (MILLION SQ. METERS) 107
      99. TABLE 98 SOUTH KOREA MULTI-LAYER CRYOGENIC INSULATION MARKET, BY END USE, 2019–2028 (USD MILLION) 108
      100. TABLE 99 SOUTH KOREA MULTI-LAYER CRYOGENIC INSULATION MARKET, BY END USE, 2019–2028 (MILLION SQ. METERS) 108
      101. TABLE 100 AUSTRALIA & NEW ZEALAND MULTI-LAYER CRYOGENIC INSULATION MARKET, BY TYPE, 2019–2028 (USD MILLION) 109
      102. TABLE 101 AUSTRALIA & NEW ZEALAND MULTI-LAYER CRYOGENIC INSULATION MARKET, BY TYPE, 2019–2028 (MILLION SQ. METERS) 109
      103. TABLE 102 AUSTRALIA & NEW ZEALAND MULTI-LAYER CRYOGENIC INSULATION MARKET, BY END USE, 2019–2028 (USD MILLION) 110
      104. TABLE 103 AUSTRALIA & NEW ZEALAND MULTI-LAYER CRYOGENIC INSULATION MARKET, BY END USE, 2019–2028 (MILLION SQ. METERS) 110
      105. TABLE 104 REST OF ASIA-PACIFIC MULTI-LAYER CRYOGENIC INSULATION MARKET, BY TYPE, 2019–2028 (USD MILLION) 111
      106. TABLE 105 REST OF ASIA-PACIFIC MULTI-LAYER CRYOGENIC INSULATION MARKET, BY TYPE, 2019–2028 (MILLION SQ. METERS) 111
      107. TABLE 106 REST OF ASIA-PACIFIC MULTI-LAYER CRYOGENIC INSULATION MARKET, BY END USE, 2019–2028 (USD MILLION) 112
      108. TABLE 107 REST OF ASIA-PACIFIC MULTI-LAYER CRYOGENIC INSULATION MARKET, BY END USE, 2019–2028 (MILLION SQ. METERS) 112
      109. TABLE 108 LATIN AMERICA MULTI-LAYER CRYOGENIC INSULATION MARKET, BY COUNTRY, 2019–2028 (USD MILLION) 114
      110. TABLE 109 LATIN AMERICA MULTI-LAYER CRYOGENIC INSULATION MARKET, BY COUNTRY, 2019–2028 (MILLION SQ. METERS) 114
      111. TABLE 110 LATIN AMERICA MULTI-LAYER CRYOGENIC INSULATION MARKET, BY TYPE, 2019–2028 (USD MILLION) 115
      112. TABLE 111 LATIN AMERICA MULTI-LAYER CRYOGENIC INSULATION MARKET, BY TYPE, 2019–2028 (MILLION SQ. METERS) 115
      113. TABLE 112 LATIN AMERICA MULTI-LAYER CRYOGENIC INSULATION MARKET, BY END USE, 2019–2028 (USD MILLION) 116
      114. TABLE 113 LATIN AMERICA MULTI-LAYER CRYOGENIC INSULATION MARKET, BY END USE, 2019–2028 (MILLION SQ. METERS) 116
      115. TABLE 114 BRAZIL MULTI-LAYER CRYOGENIC INSULATION MARKET, BY TYPE, 2019–2028 (USD MILLION) 117
      116. TABLE 115 BRAZIL MULTI-LAYER CRYOGENIC INSULATION MARKET, BY TYPE, 2019–2028 (MILLION SQ. METERS) 117
      117. TABLE 116 BRAZIL MULTI-LAYER CRYOGENIC INSULATION MARKET, BY END USE, 2019–2028 (USD MILLION) 118
      118. TABLE 117 BRAZIL MULTI-LAYER CRYOGENIC INSULATION MARKET, BY END USE, 2019–2028 (MILLION SQ. METERS) 118
      119. TABLE 118 MEXICO MULTI-LAYER CRYOGENIC INSULATION MARKET, BY TYPE, 2019–2028 (USD MILLION) 119
      120. TABLE 119 MEXICO MULTI-LAYER CRYOGENIC INSULATION MARKET, BY TYPE, 2019–2028 (MILLION SQ. METERS) 119
      121. TABLE 120 MEXICO MULTI-LAYER CRYOGENIC INSULATION MARKET, BY END USE, 2019–2028 (USD MILLION) 120
      122. TABLE 121 MEXICO MULTI-LAYER CRYOGENIC INSULATION MARKET, BY END USE, 2019–2028 (MILLION SQ. METERS) 120
      123. TABLE 122 ARGENTINA MULTI-LAYER CRYOGENIC INSULATION MARKET, BY TYPE, 2019–2028 (USD MILLION) 121
      124. TABLE 123 ARGENTINA MULTI-LAYER CRYOGENIC INSULATION MARKET, BY TYPE, 2019–2028 (MILLION SQ. METERS) 121
      125. TABLE 124 ARGENTINA MULTI-LAYER CRYOGENIC INSULATION MARKET, BY END USE, 2019–2028 (USD MILLION) 122
      126. TABLE 125 ARGENTINA MULTI-LAYER CRYOGENIC INSULATION MARKET, BY END USE, 2019–2028 (MILLION SQ. METERS) 122
      127. TABLE 126 REST OF LATIN AMERICA MULTI-LAYER CRYOGENIC INSULATION MARKET, BY TYPE, 2019–2028 (USD MILLION) 123
      128. TABLE 127 REST OF LATIN AMERICA MULTI-LAYER CRYOGENIC INSULATION MARKET, BY TYPE, 2019–2028 (MILLION SQ. METERS) 123
      129. TABLE 128 REST OF LATIN AMERICA MULTI-LAYER CRYOGENIC INSULATION MARKET, BY END USE, 2019–2028 (USD MILLION) 124
      130. TABLE 129 REST OF LATIN AMERICA MULTI-LAYER CRYOGENIC INSULATION MARKET, BY END USE, 2019–2028 (MILLION SQ. METERS) 124
      131. TABLE 130 MIDDLE EAST & AFRICA MULTI-LAYER CRYOGENIC INSULATION MARKET, BY COUNTRY, 2019–2028 (USD MILLION) 126
      132. TABLE 131 MIDDLE EAST & AFRICA MULTI-LAYER CRYOGENIC INSULATION MARKET, BY COUNTRY, 2019–2028 (MILLION SQ. METERS) 126
      133. TABLE 132 MIDDLE EAST & AFRICA MULTI-LAYER CRYOGENIC INSULATION MARKET, BY TYPE, 2019–2028 (USD MILLION) 127
      134. TABLE 133 MIDDLE EAST & AFRICA MULTI-LAYER CRYOGENIC INSULATION MARKET, BY TYPE, 2019–2028 (MILLION SQ. METERS) 127
      135. TABLE 134 MIDDLE EAST & AFRICA MULTI-LAYER CRYOGENIC INSULATION MARKET, BY END USE, 2019–2028 (USD MILLION) 128
      136. TABLE 135 MIDDLE EAST & AFRICA MULTI-LAYER CRYOGENIC INSULATION MARKET, BY END USE, 2019–2028 (MILLION SQ. METERS) 128
      137. TABLE 136 GCC COUNTRIES MULTI-LAYER CRYOGENIC INSULATION MARKET, BY TYPE, 2019–2028 (USD MILLION) 129
      138. TABLE 137 GCC COUNTRIES MULTI-LAYER CRYOGENIC INSULATION MARKET, BY TYPE, 2019–2028 (MILLION SQ. METERS) 129
      139. TABLE 138 GCC COUNTRIES MULTI-LAYER CRYOGENIC INSULATION MARKET, BY END USE, 2019–2028 (USD MILLION) 130
      140. TABLE 139 GCC COUNTRIES MULTI-LAYER CRYOGENIC INSULATION MARKET, BY END USE, 2019–2028 (MILLION SQ. METERS) 130
      141. TABLE 140 SOUTH AFRICA MULTI-LAYER CRYOGENIC INSULATION MARKET, BY TYPE, 2019–2028 (USD MILLION) 131
      142. TABLE 141 SOUTH AFRICA MULTI-LAYER CRYOGENIC INSULATION MARKET, BY TYPE, 2019–2028 (MILLION SQ. METERS) 131
      143. TABLE 142 SOUTH AFRICA MULTI-LAYER CRYOGENIC INSULATION MARKET, BY END USE, 2019–2028 (USD MILLION) 132
      144. TABLE 143 SOUTH AFRICA MULTI-LAYER CRYOGENIC INSULATION MARKET, BY END USE, 2019–2028 (MILLION SQ. METERS) 132
      145. TABLE 144 REST OF THE MIDDLE EAST & AFRICA MULTI-LAYER CRYOGENIC INSULATION MARKET, BY TYPE, 2019–2028 (USD MILLION) 133
      146. TABLE 145 REST OF THE MIDDLE EAST & AFRICA MULTI-LAYER CRYOGENIC INSULATION MARKET, BY TYPE, 2019–2028 (MILLION SQ. METERS) 133
      147. TABLE 146 REST OF THE MIDDLE EAST & AFRICA MULTI-LAYER CRYOGENIC INSULATION MARKET, BY END USE, 2019–2028 (USD MILLION) 134
      148. TABLE 147 REST OF THE MIDDLE EAST & AFRICA MULTI-LAYER CRYOGENIC INSULATION MARKET, BY END USE, 2019–2028 (MILLION SQ. METERS) 134
      149. TABLE 148 KEY DEVELOPMENTS 136
      150. TABLE 149 ARMACELL INTERNATIONAL HOLDING GMBHS: PRODUCTS OFFERED 139
      151. TABLE 150 ARMACELL INTERNATIONAL HOLDING GMBH: KEY DEVELOPMENTS 140
      152. TABLE 151 LYDALL INC.: PRODUCTS OFFERED 142
      153. TABLE 152 CABOT CORPORATION: PRODUCTS OFFERED 145
      154. TABLE 153 TECHNIFAB PRODUCTS: PRODUCTS OFFERED 147
      155. TABLE 154 TECHNIFAB PRODUCTS: KEY DEVELOPMENTS 148
      156. TABLE 155 OWENS CORNING: PRODUCTS OFFERED 151
      157. TABLE 156 NICHIA CORPORATION: PRODUCT OFFERINGS 153
      158. TABLE 157 DUNMORE: PRODUCT OFFERINGS 157
      159. TABLE 158 ASPEN AEROGELS: PRODUCT OFFERINGS 160
      160. TABLE 159 ASPEN AEROGELS: KEY DEVELOPMENTS 161
      161. TABLE 160 ISOLATIE COMBINATIE BEVERWIJK B.V.: PRODUCT OFFERINGS 162
      162. TABLE 161 ABHIJIT ENTERPRISES: PRODUCT OFFERINGS 164   LIST OF FIGURES
      163. FIGURE 1 MARKET SYNOPSIS 17
      164. FIGURE 2 MARKET ATTRACTIVENESS ANALYSIS: GLOBAL MULTI-LAYER CRYOGENIC INSULATION MARKET, 2020 18
      165. FIGURE 3 GLOBAL MULTI-LAYER CRYOGENIC INSULATION MARKET ANALYSIS BY TYPE 19
      166. FIGURE 4 GLOBAL MULTI-LAYER CRYOGENIC INSULATION MARKET ANALYSIS BY END USE 20
      167. FIGURE 5 GLOBAL MULTI-LAYER CRYOGENIC INSULATION MARKET ANALYSIS BY REGION 21
      168. FIGURE 6 GLOBAL MULTI-LAYER CRYOGENIC INSULATION MARKET: MARKET STRUCTURE 23
      169. FIGURE 7 RESEARCH PROCESS OF MRFR 24
      170. FIGURE 8 MARKET DYNAMICS OVERVIEW 30
      171. FIGURE 9 DRIVERS IMPACT ANALYSIS 33
      172. FIGURE 10 RESTRAINTS IMPACT ANALYSIS 34
      173. FIGURE 11 SUPPLY CHAIN ANALYSIS FOR GLOBAL MULTI-LAYER CRYOGENIC INSULATION MARKET 36
      174. FIGURE 12 Porter's Five Forces Analysis OF THE GLOBAL MULTI-LAYER CRYOGENIC INSULATION MARKET 40
      175. FIGURE 13 GLOBAL MULTI-LAYER CRYOGENIC INSULATION MARKET, BY TYPE, 2019–2028 (USD MILLION) 49
      176. FIGURE 14 GLOBAL MULTI-LAYER CRYOGENIC INSULATION MARKET, BY TYPE, 2019–2028 (MILLION SQ. METERS) 51
      177. FIGURE 15 GLOBAL MULTI-LAYER CRYOGENIC INSULATION MARKET, BY END USE, 2019–2028 (USD MILLION) 59
      178. FIGURE 16 GLOBAL MULTI-LAYER CRYOGENIC INSULATION MARKET, BY END USE, 2019–2028 (MILLION SQ. METERS) 61
      179. FIGURE 17 GLOBAL MULTI-LAYER CRYOGENIC INSULATION MARKET BY REGION, 2019–2028 (USD MILLION) 70
      180. FIGURE 18 GLOBAL MULTI-LAYER CRYOGENIC INSULATION MARKET BY REGION, 2019–2028 (MILLION SQ. METERS) 71
      181. FIGURE 19 NORTH AMERICA MULTI-LAYER CRYOGENIC INSULATION MARKET, BY COUNTRY, 2020 (%SHARE) 73
      182. FIGURE 20 EUROPE MULTI-LAYER CRYOGENIC INSULATION MARKET, BY COUNTRY, 2020 (%SHARE) 81
      183. FIGURE 21 ASIA-PACIFIC MULTI-LAYER CRYOGENIC INSULATION MARKET, BY COUNTRY, 2020 (%SHARE) 97
      184. FIGURE 22 LATIN AMERICA MULTI-LAYER CRYOGENIC INSULATION MARKET, BY COUNTRY, 2020 (%SHARE) 113
      185. FIGURE 23 MIDDLE EAST & AFRICA MULTI-LAYER CRYOGENIC INSULATION MARKET, BY COUNTRY, 2020 (%SHARE) 125
      186. FIGURE 24 BENCHMARKING OF MAJOR COMPETITORS 137
      187. FIGURE 25 ARMACELL INTERNATIONAL HOLDING GMBH: FINANCIAL OVERVIEW SNAPSHOT 139
      188. FIGURE 26 ARMACELL INTERNATIONAL HOLDING GMBHS: SWOT ANALYSIS 140
      189. FIGURE 27 LYDALL INC.: FINANCIAL OVERVIEW SNAPSHOT 142
      190. FIGURE 28 LYDALL INC.: SWOT ANALYSIS 143
      191. FIGURE 29 CABOT CORPORATION: FINANCIAL OVERVIEW SNAPSHOT 145
      192. FIGURE 30 CABOT CORPORATION: SWOT ANALYSIS 146
      193. FIGURE 31 TECHNIFAB PRODUCTS: SWOT ANALYSIS 148
      194. FIGURE 32 OWENS CORNING: FINANCIAL OVERVIEW SNAPSHOT 150
      195. FIGURE 33 OWENS CORNING: SWOT ANALYSIS 151
      196. FIGURE 34 NICHIA CORPORATION: SWOT ANALYSIS 154
      197. FIGURE 35 DUNMORE: FINANCIAL OVERVIEW SNAPSHOT 156
      198. FIGURE 36 DUNMORE: SWOT ANALYSIS 158
      199. FIGURE 37 ASPEN AEROGELS: FINANCIAL OVERVIEW SNAPSHOT 160
      200. FIGURE 38 ASPEN AEROGELS: SWOT ANALYSIS 161
      201. FIGURE 39 ISOLATIE COMBINATIE BEVERWIJK B.V.: SWOT ANALYSIS 163
      202. FIGURE 40 ABHIJIT ENTERPRISES: SWOT ANALYSIS 165

    Multi-Layer Cryogenic Insulation Market Segmentation

    Market Segmentation Overview

    • Detailed segmentation data will be available in the full report
    • Comprehensive analysis by multiple parameters
    • Regional and country-level breakdowns
    • Market size forecasts by segment
    Infographic

    Free Sample Request

    Kindly complete the form below to receive a free sample of this Report

    Get Free Sample

    Customer Strories

    “I am very pleased with how market segments have been defined in a relevant way for my purposes (such as "Portable Freezers & refrigerators" and "last-mile"). In general the report is well structured. Thanks very much for your efforts.”

    Victoria Milne

    Founder
    Case Study
    Chemicals and Materials