Natural Stone Market (2025 - 2035)

Natural Stone Market Research Report: By Type of Stone (Granite, Marble, Travertine, Limestone, Sandstone, Quartzite, Slate), By Application (Flooring, Wall cladding, Countertops, Landscaping, Architecture, Sculptures), By Finish (Polished, Honed, Brushed, Flamed, Tumbled, Antiqued), By Color (White, Black, Gray, Beige, Brown, Green, Red, Blue) and By Regional (North America, Europe, South America, Asia Pacific, Middle East and Africa) - Forecast to 2035.
ID: MRFR/PCM/24200-HCR
111 Pages
Snehal Singh
Last Updated: July 08, 2026
Natural Stone Market
Market Size
Forecast Period2025-2035
CAGR (2025-2035)4.95%
2025 Market SizeUSD 40.52 Billion
2035 Market SizeUSD 65.70 Billion
Key Players
Cosentino Group
Levantina y Asociados de Minerales
Polycor Inc.
Pokarna Limited
Antolini Luigi & C. S.p.A.
Coldspring
Opportunities
  • Thin-Stone Veneer and Ultra-Compact Slab Innovation
  • Digital Traceability and Blockchain-Based Provenance
  • Emerging-Market Urbanization in Sub-Saharan Africa

Natural Stone Market Summary

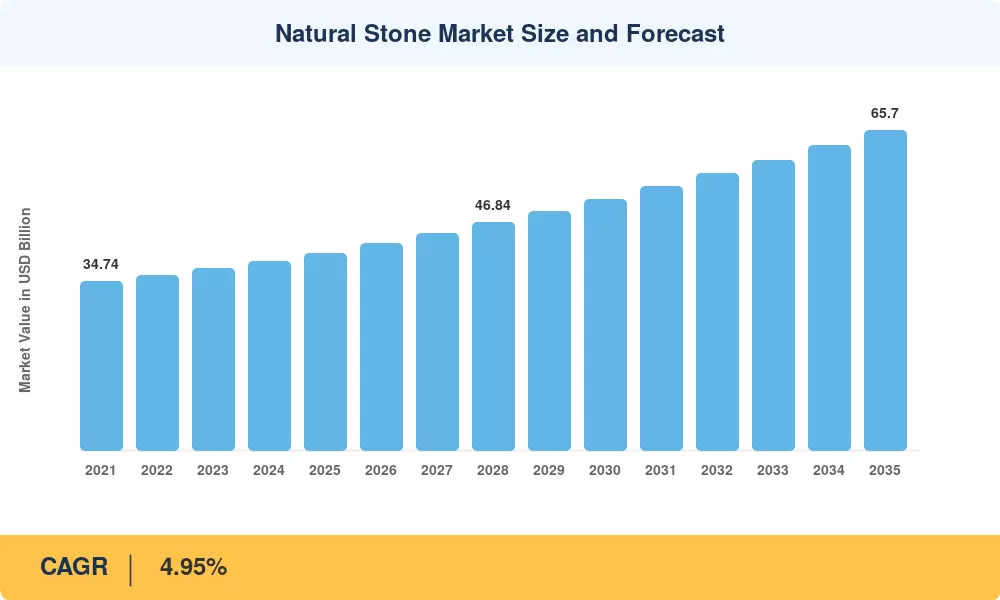
The natural stone market reached a valuation of USD 40.52 billion in 2025 and is projected to expand from USD 42.53 billion in 2026 to USD 65.70 billion by 2035, registering a CAGR of 4.95% across the forecast window. This trajectory draws power from two interlinked catalysts: an estimated USD 94 trillion global infrastructure pipeline earmarked through 2040, and escalating middle-class demand for premium residential finishes in emerging economies [2]. Together, these forces anchor the natural stone market well beyond cyclical housing swings.

On the technical side, quarrying is shifting away from conventional manual extraction, toward digital terrain mapping, AI-driven yield optimisation and electric wire-cutting equipment. According to the European Stone Federation, quarries using digital solutions minimize raw-block waste by 18–22%, directly increasing unit economics and meeting tighter EU carbon-reporting standards [3]. With such progress, manufacturers can match engineered alternatives for cost and ecological qualities.

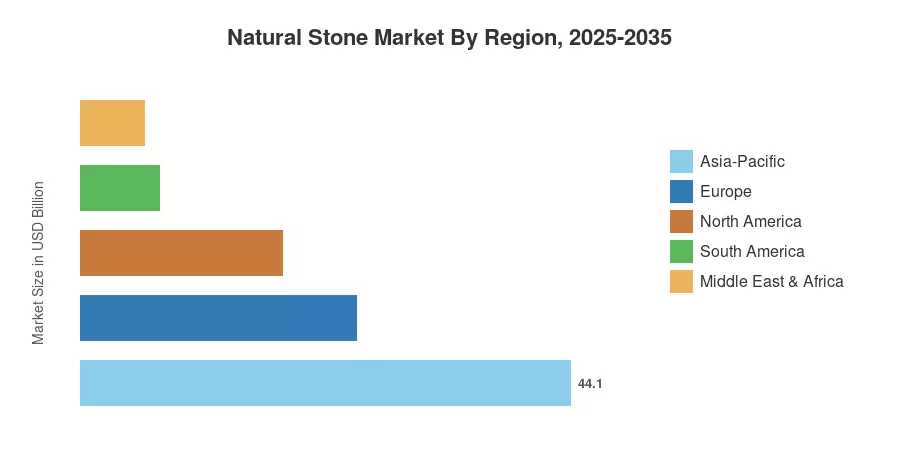
Asia-Pacific accounts for a 44.1% share of the natural stone market, being the largest consuming region, and the quickest CAGR at 6.35% through 2035. Europe accounts for the second-largest percentage, 24.8%, attributed to the need to restore heritage architecture and incentive schemes for green buildings [4]. North America continues to be the largest regional market with 18.2% share of the global highway resurfacing and commercial renovation market. The growth is supported by steady highway resurfacing and commercial renovation cycles. As digital processing technology advances and supply chains tighten around traceability, the natural stone sector is well set to remain competitively relevant against synthetics in the coming decade.


Key Report Takeaways

• By Type

  • Granite captured the leading position in the natural stone market in 2025, commanding 28.5% revenue share.
  • Marble is the fastest-expanding type segment, advancing at a 6.25% CAGR through 2035.

• By Form

  • Slabs represented 41.2% of the natural stone market in the base year, driven by countertop and façade demand.
  • Tiles are growing at 6.30% CAGR, propelled by modular construction methods and thinner-profile cutting technology.

• By Region

  • Asia-Pacific led with 44.1% share of the natural stone market in 2025.
  • The Middle East & Africa is accelerating at a 5.52% CAGR, supported by mega-project pipelines across the Gulf Cooperation Council.


Natural Stone Market Size and Forecast (2021–2035)

Market Research Future employs a triangulated sizing methodology combining top-down trade-flow analysis from UN Comtrade data, bottom-up quarry production surveys across 32 countries, and demand-side validation through construction-permit databases and distributor channel audits. Historical values (2021–2024) reflect actual trade data; forecast values (2026–2035) apply a calibrated 4.95% CAGR with adjustments for identified macro-risk scenarios[5].
Natural Stone Market Size and Forecast
Our Impact
Enabled $4.3B Revenue Impact for Fortune 500 and Leading Multinationals
Partnering with 2000+ Global Organizations Each Year
30K+ Citations by Top-Tier Firms in the Industry

Driver Impact Analysis

Driver ~% Impact on CAGR Geographic Relevance Impact Timeline
Public infrastructure investment programs ~22% Global Long-term (≥4 yr)
Middle-class housing premiumization ~18% Asia-Pacific, South America Medium-term (2–4 yr)
Green-building certification mandates ~16% Europe, North America Medium-term (2–4 yr)
Digital quarry and AI yield optimization ~14% Europe, Asia-Pacific Short-term (≤2 yr)
Heritage and monument restoration spending ~12% Europe, MEA Long-term (≥4 yr)
Urbanization in emerging economies ~10% Asia-Pacific, Africa Long-term (≥4 yr)
E-commerce and direct-to-fabricator channels ~8% North America, Europe Short-term (≤2 yr)


Public Infrastructure Investment Programs

Global infrastructure needs are substantial, with a G20-backed report from the Global Infrastructure Hub projecting a cumulative investment requirement of $94 trillion through 2040 to support global development. In the United States, the Infrastructure Investment and Jobs Act allocates over $670 billion to transportation, while China’s recent transport investment reached 15.2 trillion yuan, driving consistent demand for durable stone materials


Middle-Class Housing Premiumization

India’s construction sector is a major economic driver, recording a 9.4% growth rate in the 2024–25 fiscal year, supported by government initiatives like the Pradhan Mantri Awas Yojana, which targets housing for millions. Rising disposable incomes across South and Southeast Asia are shifting consumer preferences toward natural stone finishes, particularly for premium residential interior applications like kitchen and bathroom surfaces.

Green-Building Certification Mandates

The European Union’s 2024 Energy Performance of Buildings Directive mandates that all new buildings be zero-emission by 2030, accelerating the demand for materials with low environmental footprints. Because natural stone requires significantly less energy for extraction and processing than synthetic alternatives, it is increasingly favored by architects to secure credits under rigorous international green-building certification systems like LEED and BREEAM.


Digital Quarry and AI Yield Optimization

The integration of 3D LiDAR scanning and machine-learning algorithms is revolutionizing quarry efficiency by enabling high-precision volume calculations and block-geometry optimization. These digital advancements, combined with modernized electric cutting systems, significantly reduce energy consumption and waste volumes. These improvements lower production costs, directly enhancing the competitive market position of natural stone against engineered quartz and sintered-surface products.


Restraints Impact Analysis

Restraint ~% Negative Impact on CAGR Geographic Relevance Impact Timeline
Competition from engineered quartz and sintered surfaces ~–25% Global Long-term (≥4 yr)
Environmental permitting and quarry-access restrictions ~–20% Europe, North America Medium-term (2–4 yr)
High logistics costs and breakage during transit ~–20% Global Ongoing
Skilled-labor shortages in stone fabrication ~–18% Europe, North America Medium-term (2–4 yr)
Price volatility of energy inputs ~–17% Global Short-term (≤2 yr)


Competition from Engineered Alternatives

The global market for engineered quartz surfaces has seen rapid expansion, with the sector's total valuation reaching approximately $17.08 billion by 2024. The material’s ability to offer uniform aesthetic consistency at a lower price point has secured significant market share. This creates a challenging competitive environment for natural stone producers, particularly within the price-sensitive mid-tier residential and commercial construction segments.


Environmental Permitting and Quarry-Access Restrictions

Regulatory frameworks for environmental protection, such as the EU’s Natura 2000 initiative, increasingly prioritize biodiversity, often resulting in prolonged permitting timelines for industrial extraction sites. Simultaneously, in regions like India, judicial interventions—including Supreme Court-monitored oversight of mining in ecologically sensitive zones like the Aravalli range—have led to periodic operational halts, injecting notable uncertainty into global supply chains.


Logistics Costs and Breakage

Natural stone is characterized by high volume and density, often resulting in significant transportation expenses that account for up to 20% of total construction project costs. Vulnerability to breakage during transit, coupled with volatile global maritime freight rates—which surged to five times pre-pandemic levels in 2021 according to UNCTAD—creates structural cost disadvantages against lighter, more durable synthetic building materials.


Natural Stone Market Opportunities

Thin-Stone Veneer and Ultra-Compact Slab Innovation

Advances in waterjet and diamond-wire splitting now enable the production of calibrated stone panels as thin as 3 mm backed by fiberglass or aluminum honeycomb [10]. These lightweight composites unlock façade applications on high-rise structures where traditional 30 mm slabs would exceed load-bearing limits, opening an addressable segment estimated at USD 2.8 billion globally by 2030.

Digital Traceability and Blockchain-Based Provenance

Consumer and regulatory demand for supply-chain transparency is creating opportunities for quarry-to-site digital passports. The EU Construction Products Regulation revision mandates environmental product declarations for stone by 2028, and blockchain-verified chain-of-custody platforms can command a 5–8% price premium for certified-origin slabs in premium European and North American channels [12].

Emerging-Market Urbanization in Sub-Saharan Africa

Sub-Saharan Africa's urban population is projected to double to 1.2 billion by 2050, according to UN-Habitat forecasts [11]. Countries such as Nigeria, Kenya, and Ethiopia are seeing rapid commercial-construction growth that currently relies on imported stone. Local quarry development supported by African Development Bank financing can capture this demand within the natural stone market at a lower delivered cost than imports.

Reclaimed and Recycled Stone Circular-Economy Models

Post-demolition stone reclamation is gaining traction in Europe, where salvaged limestone and sandstone from heritage renovations sell at 20–30% premiums in the bespoke residential segment [4]. Establishing certified reclamation supply chains enables producers to diversify revenue and align with circular-economy scoring under LEED and BREEAM, strengthening the natural stone market's sustainability narrative.

Direct-to-Fabricator E-Commerce Platforms

Online stone-sourcing marketplaces that connect quarries directly with fabrication shops are compressing traditional distribution chains by eliminating one or two intermediary steps [13]. Platforms offering 3D slab visualization, real-time inventory, and automated freight quoting have grown transaction volumes by an estimated 35% year-over-year since 2022, signaling a structural shift in procurement behavior within the natural stone market.


Natural Stone Market Future Outlook

Autonomous Quarrying and Robotics Integration

By 2030, leading quarry operators are expected to deploy semi-autonomous extraction systems combining GPS-guided drill rigs with AI-optimized block-separation algorithms [10]. These systems can reduce on-site labor requirements by 30–40% while improving dimensional accuracy, addressing both the skilled-labor shortage and the rising cost of workplace-safety compliance in the natural stone market. Early adopters in Italy and Brazil have demonstrated 15% throughput gains in pilot programs running since 2024.

Sustainability Reporting and EPD Standardization

The global push toward mandatory environmental product declarations will reshape competitive dynamics in the natural stone market through 2035. The EU's updated Construction Products Regulation requires digital EPDs for all stone sold in the single market by 2028, and similar frameworks are under development in California and New South Wales [3][12]. Producers who invest in life-cycle assessment infrastructure early will secure preferential specification from architects targeting LEED v5 Platinum and BREEAM Outstanding ratings.

Platform Economics and Digital Marketplaces

Stone-sourcing platforms that aggregate slab inventories from hundreds of quarries into searchable, visually inspectable catalogs are restructuring the natural stone market's distribution model [13]. By 2032, an estimated 20–25% of commercial-project stone procurement could flow through digital channels, compressing margins for traditional distributors while expanding market access for smaller quarry operators in Brazil, India, and Turkey. Real-time pricing transparency will also dampen the regional arbitrage that has historically characterized cross-border stone trade.

Circular Economy and Carbon-Neutral Stone

Industry-backed initiatives such as the Natural Stone Sustainability Standard (NSC 373) and the Responsible Stone Initiative are establishing audit frameworks for quarry rehabilitation, water recycling, and carbon-offset integration [12]. By the early 2030s, carbon-neutral-certified stone products could command 10–15% price premiums in European and North American specification channels, creating a differentiated tier within the natural stone market that rewards vertically integrated producers with on-site renewable energy and closed-loop water systems.


Natural Stone Market Segmentation

By Type

Segment Key Metric Primary Demand Driver
Granite 28.5% share (2025) Countertops, exterior paving, infrastructure
Marble 6.25% CAGR (2026–2035) Luxury residential and hospitality interiors
Limestone USD 6.92 Billion (2025) Heritage restoration, landscape walling
Sandstone, Slate & Others 4.48% CAGR (2026–2035) Roofing, artisanal masonry, monument work


Granite maintains the largest type-level share in the natural stone market due to its hardness, stain resistance, and broad color palette — attributes that make it the default choice for high-traffic commercial flooring and outdoor paving. The segment's maturity, however, means growth rates trail the overall market as substitution from engineered quartz intensifies in residential countertop applications.

Marble is the fastest-growing type segment in the natural stone market, benefiting from renewed demand in luxury hospitality projects and ultra-premium residential developments across the Gulf states, Southern Europe, and East Asia. Italian Carrara and Turkish Afyon white varieties command the highest price premiums, and thinning technology is extending marble's reach into lightweight façade panels previously dominated by aluminum composites [10].

By Form

Segment Key Metric Primary Demand Driver
Slabs 41.2% share (2025) Kitchen countertops, accent walls, façades
Blocks USD 8.64 Billion (2025) Monument carving, export raw material trade
Tiles 6.30% CAGR (2026–2035) Modular flooring, bathroom installations


Slabs dominate the natural stone market by form, as they represent the highest-value-added product stage between raw quarry output and finished installation. Countertop fabricators in North America and Europe drive consistent slab demand, with average slab thicknesses trending downward from 30 mm to 20 mm as waterjet bridge-saw technology improves precision.

Tiles are the fastest-growing form segment, propelled by modular construction practices and the adoption of calibrated thin-tile formats (10–12 mm) that reduce weight and installation time. Large-format tiles (600 × 1200 mm and above) are gaining share in commercial lobbies and retail spaces, directly competing with porcelain alternatives on both aesthetic and lifecycle-cost grounds.

By Color Group

Segment Key Metric Primary Demand Driver
White and Light 27.3% share (2025) Contemporary interior design, Carrara aesthetic
Dark 5.85% CAGR (2026–2035) High-contrast luxury design, commercial lobbies
Colored USD 11.48 Billion (2025) Regional architectural traditions, custom projects


White and light-toned stones lead the natural stone market by color group, reflecting the sustained popularity of Carrara-white and Calacatta-inspired aesthetics in residential and hospitality design globally.

By Application

Segment Key Metric Primary Demand Driver
Flooring and Wall Cladding 36.5% share (2025) Commercial and residential interior finishing
Exterior Applications 5.18% CAGR (2026–2035) Façade cladding, paving and landscape hardscaping
Monuments and Statues USD 3.24 Billion (2025) Heritage preservation, memorial projects
Countertops and Vanities 5.02% CAGR (2026–2035) Residential renovation and new construction


Flooring and wall cladding constitute the largest application segment in the natural stone market, spanning everything from hotel-lobby marble floors to office-tower limestone accent walls.

By End-User Industry

Segment Key Metric Primary Demand Driver
Residential 37.8% share (2025) Kitchen and bath renovation, premium new builds
Commercial 5.48% CAGR (2026–2035) Hospitality, retail, corporate office fit-outs
Industrial USD 3.04 Billion (2025) Factory flooring, chemical-resistant surfaces
Others 4.15% CAGR (2026–2035) Landscape, public infrastructure, religious sites


Residential end users account for the largest share of the natural stone market by industry, reflecting the breadth of countertop, flooring, and exterior hardscape demand across single-family and multi-family housing segments globally.


Regional Market Share Analysis

Region Key Metric Primary Investment Themes
Asia-Pacific 44.1% share (2025) Infrastructure mega-projects, residential premiumization
Europe 24.8% share (2025) Heritage restoration, green-building mandates
North America 18.2% share (2025) Commercial renovation, highway resurfacing
South America 7.1% share (2025) Mining-sector growth, housing programs
Middle East & Africa 5.8% share (2025) GCC mega-projects, African urbanization
Total 100%


North America

Country Key Metric Key Driver
US 72.4% of regional revenue Commercial renovation and IIJA-funded transit projects
Canada 16.8% of regional revenue Residential housing starts and the condominium market
Mexico 10.8% of regional revenue Nearshoring-driven industrial park construction


The North American natural stone market benefits from a mature fabrication ecosystem anchored in the US, where the Infrastructure Investment and Jobs Act is channeling sustained demand into transit-station cladding, bridge abutments, and highway median walls [7]. Canada's condominium cycle in Toronto and Vancouver supports steady countertop consumption, while Mexico's manufacturing nearshoring trend is generating new demand for commercial-grade flooring in industrial campuses.

Europe

Country Key Metric Key Driver
Germany 4.18% CAGR (2026–2035) Energy-efficient renovation stimulus
UK 4.02% CAGR (2026–2035) London commercial refurbishment pipeline
France 3.88% CAGR (2026–2035) Heritage monument restoration mandates
Italy 28.6% of European revenue Carrara and Verona quarry production hub
Spain 14.2% of European revenue Costa del Sol hospitality construction
Nordic Countries 3.75% CAGR (2026–2035) Green-building BREEAM adoption
Russia 7.3% of European revenue Domestic quarry self-sufficiency programs
Rest of Europe 5.1% of European revenue Balkan and Eastern European capacity growth


Italy remains the epicenter of the European natural stone market, home to the Carrara marble district and Verona limestone corridor that collectively supply roughly one-quarter of the continent's processed stone output [4]. Germany's KfW building-renovation subsidies and the UK's post-Brexit infrastructure push add incremental demand. At the same time, Spain's tourism-driven hospitality sector sustains a stable consumption base for high-end cladding and flooring.

Asia-Pacific

Country Key Metric Key Driver
China 38.2% of regional revenue Belt and Road infrastructure, domestic urbanization
India 6.85% CAGR (2026–2035) PMAY housing program, Rajasthan quarry expansion
Japan 8.4% of regional revenue Seismic-retrofit commercial renovations
South Korea 5.52% CAGR (2026–2035) Smart-city development initiatives
ASEAN 12.6% of regional revenue Hospitality and resort construction
Rest of Asia-Pacific 4.8% of regional revenue Emerging quarry development in Central Asia


China's dominance in the Asia-Pacific natural stone market reflects both massive domestic consumption for residential high-rises and its role as the world's largest stone-processing hub, re-exporting polished slabs and tiles globally [8]. India is the fastest-growing country-level segment, driven by the government's target of 20 million affordable urban housing units and the expansion of granite and sandstone quarrying in Rajasthan, Tamil Nadu, and Karnataka [6].

South America

Country Key Metric Key Driver
Brazil 64.5% of regional revenue Espirito Santo granite export cluster
Argentina 5.12% CAGR (2026–2035) Residential renovation uptick
Rest of South America 14.3% of regional revenue Chile and Colombia commercial projects


Brazil anchors the South American natural stone market through its Espirito Santo state quarry complex, which produces a significant share of the world's exported granite blocks [5]. Rising domestic real-estate activity in São Paulo and expanding export corridors to North American fabricators underpin medium-term growth prospects for Brazilian producers.

Middle East & Africa

Country Key Metric Key Driver
Saudi Arabia 32.8% of regional revenue NEOM and Vision 2030 mega-projects
UAE 24.1% of regional revenue Expo-legacy commercial developments
South Africa 5.38% CAGR (2026–2035) Residential construction recovery
Egypt 18.2% of regional revenue New Administrative Capital construction
Rest of MEA 10.6% of regional revenue East African urbanization corridors


The Middle East & Africa natural stone market is propelled by Saudi Arabia's Vision 2030 program, which includes NEOM, The Line, and Jeddah Tower — all specifying large volumes of marble and granite cladding [9]. Egypt's New Administrative Capital, east of Cairo, represents another anchor project, with over 170 high-rise towers under development. In Sub-Saharan Africa, nascent local quarrying operations are beginning to displace imports in Kenya and Tanzania.


Natural Stone Market By Region, 2025-2035

Competitive Benchmarking

The natural stone market exhibits low concentration, with an estimated HHI below 250 and the top five producers collectively holding approximately 12–16% of global revenue. This fragmentation stems from the geological dispersion of quarry assets and the localized nature of stone fabrication and distribution networks. Competition is intensifying, however, as larger players pursue vertical integration from quarry ownership through finished-slab distribution.

Company Est. Revenue Share Range Key Offerings Strategic Positioning
Cosentino Group ~2–4% Engineered and natural stone surfaces, Silestone, Dekton Vertically integrated with global distribution
Levantina y Asociados de Minerales ~2–3% Marble, granite, limestone slabs and tiles Major Iberian quarry operator with export focus
Polycor Inc. ~1–3% Granite, marble, limestone; architectural-grade slabs Largest North American quarry owner
Pokarna Limited ~1–2% Granite slabs and tiles for export Indian granite export leader
Antolini Luigi & C. S.p.A. ~1–2% Premium marble and exotic stone slabs Luxury niche with proprietary finishing
Coldspring ~1–2% Granite, limestone, and bronze memorial products Monument and memorial market specialist
Temmer Marble ~1–2% Turkish marble blocks and processed products Vertically integrated Turkish producer
Fox Marble Holdings ~0.5–1.5% Balkan marble and decorative stone Emerging producer with Kosovo quarry assets
Indiana Limestone Company ~0.5–1.5% Dimensional limestone for architecture Heritage US limestone brand
R.E.D. Graniti S.p.A. ~0.5–1% Italian granite processing and distribution European granite processing specialist


Recent News & Developments


NSSA(July 2026): The Natural Stone Strategic Alliance (NSSA) expanded its governance and global cooperation projects, aligning eleven member organizations to standardize Environmental Product Declarations (EPD).

Centrorochas(June 2026): The Brazilian Natural Stone Association hosted the "Stone Core 2026" event, bringing together industry executives to address international trade tariffs and strategic export expansion.

India Stonemart(February 2026): The 13th edition of India Stonemart, organized by the Centre for Development of Stones, showcased new extraction technologies and facilitated international buyer-seller networking partnerships.


Natural Stone Market Report Scope

Parameter Detail
Market Scope Global natural stone market covering quarrying, processing, and distribution of dimensional stone
Study Period 2021–2035
Historical Period 2021–2024
Base Year 2025
Forecast Period 2026–2035
CAGR (2026–2035) 4.95%
Market Size (2025) USD 40.52 Billion
Market Size (2035) USD 65.70 Billion
Fastest Growing Segment Marble (by type); Tiles (by form); Asia-Pacific (by region)
Companies Profiled 10 major players, including Cosentino, Polycor, Levantina, Pokarna, Antolini, and others
Valuation Currency USD Billion


FAQs

How does natural stone compare to engineered quartz on total installed cost for commercial lobbies?
Natural stone typically costs 10–20% more per installed square meter than engineered quartz, but delivers longer lifecycle value due to superior abrasion resistance in high-traffic zones [14]. Commercial specifiers increasingly factor 30-year maintenance savings into total cost assessments.
What quarry certification standards should procurement teams require from suppliers?
Buyers should verify NSC 373 certification for environmental stewardship and request ISO 14001-compliant quarry management documentation [22]. These credentials ensure responsible extraction practices and simplify green-building credit accumulation.
How are tariffs affecting cross-border stone pricing in 2025?
US Section 301 tariffs on Chinese processed stone remain at 25%, pushing fabricators toward Brazilian, Indian, and Turkish supply sources [7]. This tariff environment has reshaped global trade flows and elevated delivered costs for Chinese-origin products.
What thickness specifications are trending for exterior façade panels?
Architects are specifying reinforced panels as thin as 6–8 mm for ventilated façade systems, reducing dead-load requirements by up to 70% versus traditional 30 mm installations [10]. Honeycomb-backed composites dominate this format.
How do seismic codes influence stone-cladding specification in earthquake-prone regions?
Updated IBC and Eurocode 8 provisions require mechanical anchor systems for stone panels exceeding 20 kg per square meter in seismic zones III and above [15]. Compliance adds 8–12% to installation costs but is non-negotiable.
What role does water recycling play in modern quarry economics?
Closed-loop water systems can recover 90–95% of process water used in sawing and polishing, reducing freshwater intake costs by roughly USD 0.40 per square meter of finished product [22]. Regulatory pressure is accelerating adoption.
Are small-format mosaic and split-face products gaining or losing share?
Small-format natural stone mosaics are growing at roughly 3% annually, primarily driven by residential bathroom and backsplash renovations in North America and Europe [10]. They remain a niche but stable sub-segment.    
Author
Author
Author Profile
Snehal Singh LinkedIn
Manager - Research
High acumen in analyzing complex macro & micro markets with more than 6 years of work experience in the field of market research. By implementing her analytical skills in forecasting and estimation into market research reports, she has expertise in Packaging, Construction, and Equipment domains. She handles a team size of 20-25 resources and ensures smooth running of the projects, associated marketing activities, and client servicing.

Research Approach


Secondary Research

The secondary research process involved comprehensive analysis of geological surveys, construction industry databases, mining regulatory publications, and authoritative trade organizations. Key sources included the US Geological Survey (USGS), European Association of Craft, Small and Medium-sized Enterprises (UEAPME), Natural Stone Institute (NSI), Marble Institute of America (MIA+BSI), British Geological Survey (BGS), Indian Bureau of Mines (IBM), China National Building Material Association (CNBM), International Union of Geological Sciences (IUGS), US Census Bureau Construction Spending Reports, Eurostat Construction Statistics, World Bank Infrastructure Data, UN Comtrade Database, National Stone, Sand & Gravel Association (NSSGA), Brazilian Mining Association (Ibram), Turkish Natural Stone Committee (IMIB), and national mining ministry reports from key producing regions. These sources were used to collect quarry production statistics, trade flow data, extraction technology trends, building permit analytics, and market landscape analysis for granite, marble, travertine, limestone, sandstone, quartzite, and slate segments.


Primary Research

In order to gather both qualitative and quantitative insights, supply-side and demand-side stakeholders were interviewed during the primary research process. CEOs, vice presidents of quarry operations, directors of sustainability, and commercial heads from distributors, processing plants, and firms that extract natural stone were examples of supply-side sources. Chief architects, project developers, procurement managers from construction companies, interior designers, and facilities managers from the commercial real estate, hotel, and residential development industries were examples of demand-side sources. Market segmentation, quarry growth schedules, and information on material specification trends, pricing volatility, and sustainability certification dynamics were all corroborated by primary research.

Primary Respondent Breakdown:

By Designation: C-level Primaries (28%), Director Level (32%), Others (40%)

By Region: North America (32%), Europe (30%), Asia-Pacific (28%), Rest of World (10%)


Market Size Estimation

Global market valuation was derived through production volume mapping and trade value analysis. The methodology included:

Identification of 60+ key quarrying and processing companies across North America, Europe, Asia-Pacific, Latin America, and Middle East & Africa

Product mapping across granite, marble, travertine, limestone, sandstone, quartzite, and slate categories

Analysis of reported and modeled annual revenues specific to natural stone portfolios

Coverage of manufacturers representing 75-80% of global market share in 2024

Extrapolation using bottom-up (extraction volume × ASP by country/region) and top-down (manufacturer revenue validation) approaches to derive segment-specific valuations

Download Free Sample

Kindly complete the form below to receive a free sample of this Report

Download PDF ×

We do not share your information with anyone. However, we may send you emails based on your report interest from time to time. You may contact us at any time to opt-out.
















