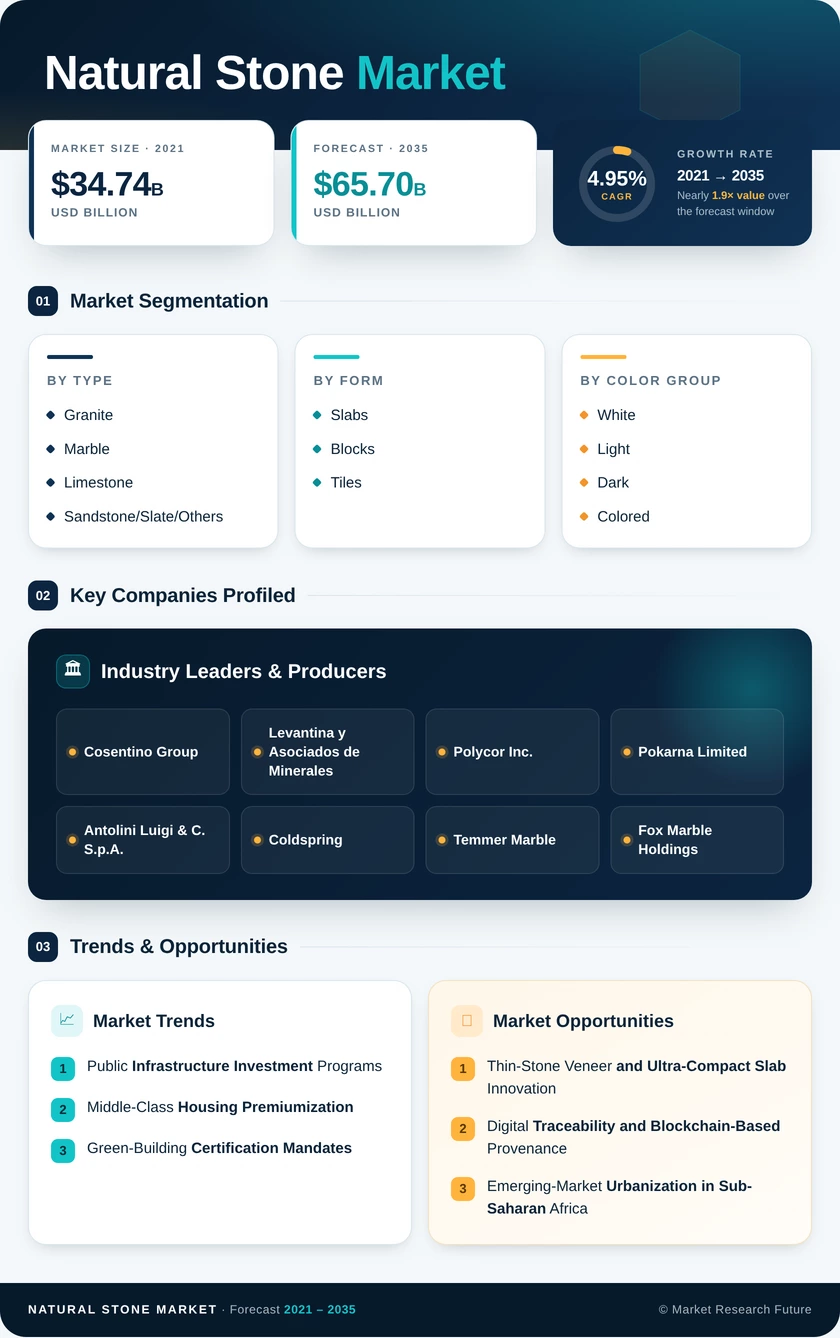
Natural Stone Market (2025 - 2035)

ID: MRFR/PCM/24200-HCR
111 Pages
Snehal Singh
Last Updated: July 08, 2026
Natural Stone Market Research Report: By Type of Stone (Granite, Marble, Travertine, Limestone, Sandstone, Quartzite, Slate), By Application (Flooring, Wall cladding, Countertops, Landscaping, Architecture, Sculptures), By Finish (Polished, Honed, Brushed, Flamed, Tumbled, Antiqued), By Color (White, Black, Gray, Beige, Brown, Green, Red, Blue) and By Regional (North America, Europe, South America, Asia Pacific, Middle East and Africa) - Forecast to 2035.
Natural Stone Market
Market Size
Forecast Period2025-2035
CAGR (2025-2035)4.95%
2025 Market SizeUSD 40.52 Billion
2035 Market SizeUSD 65.70 Billion
Key Players
Cosentino Group
Levantina y Asociados de Minerales
Polycor Inc.
Pokarna Limited
Antolini Luigi & C. S.p.A.
Coldspring
Opportunities
  • Thin-Stone Veneer and Ultra-Compact Slab Innovation
  • Digital Traceability and Blockchain-Based Provenance
  • Emerging-Market Urbanization in Sub-Saharan Africa
  1. 1 Market Overview |
    1. 1.1 Study Assumptions & Market Definition |
    2. 1.2 Scope of the Study |
    3. 1.3 Research Methodology
  2. 2 Market Summary & Key Takeaways
  3. 3 Market Dynamics |
    1. 3.1 Market Drivers Analysis | |
      1. 3.1.1 Public Infrastructure Investment Programs | |
      2. 3.1.2 Middle-Class Housing Premiumization | |
      3. 3.1.3 Green-Building Certification Mandates | |
      4. 3.1.4 Digital Quarry and AI Yield Optimization | |
      5. 3.1.5 Heritage and Monument Restoration Spending | |
      6. 3.1.6 Urbanization in Emerging Economies | |
      7. 3.1.7 E-Commerce and Direct-to-Fabricator Channels |
    2. 3.2 Market Restraints Analysis | |
      1. 3.2.1 Competition from Engineered Quartz and Sintered Surfaces | |
      2. 3.2.2 Environmental Permitting and Quarry-Access Restrictions | |
      3. 3.2.3 High Logistics Costs and Breakage During Transit | |
      4. 3.2.4 Skilled-Labor Shortages in Stone Fabrication | |
      5. 3.2.5 Price Volatility of Energy Inputs |
    3. 3.3 Market Opportunity Analysis | |
      1. 3.3.1 Thin-Stone Veneer and Ultra-Compact Slab Innovation | |
      2. 3.3.2 Digital Traceability and Blockchain-Based Provenance | |
      3. 3.3.3 Emerging-Market Urbanization in Sub-Saharan Africa | |
      4. 3.3.4 Reclaimed and Recycled Stone Circular-Economy Models | |
      5. 3.3.5 Direct-to-Fabricator E-Commerce Platforms |
    4. 3.4 Industry Value Chain Analysis |
    5. 3.5 Porter's Five Forces Analysis
  4. 4 Global Natural Stone Market Size & Forecast (2021–2035) |
    1. 4.1 Historical Market Size (2021–2025) |
    2. 4.2 Current & Forecast Market Size (2026–2035) |
    3. 4.3 Market Size by Revenue (USD Billion) |
    4. 4.4 Year-over-Year Growth Analysis
  5. 5 Segmentation Analysis |
    1. 5.1 By Type | |
      1. 5.1.1 Granite | |
      2. 5.1.2 Marble | |
      3. 5.1.3 Limestone | |
      4. 5.1.4 Sandstone, Slate & Others |
    2. 5.2 By Form | |
      1. 5.2.1 Slabs | |
      2. 5.2.2 Blocks | |
      3. 5.2.3 Tiles |
    3. 5.3 By Color Group | |
      1. 5.3.1 White and Light | |
      2. 5.3.2 Dark | |
      3. 5.3.3 Colored |
    4. 5.4 By Application | |
      1. 5.4.1 Flooring and Wall Cladding | |
      2. 5.4.2 Exterior Applications | |
      3. 5.4.3 Monuments and Statues | |
      4. 5.4.4 Countertops and Vanities |
    5. 5.5 By End-User Industry | |
      1. 5.5.1 Residential | |
      2. 5.5.2 Commercial | |
      3. 5.5.3 Industrial | |
      4. 5.5.4 Others
  6. 6 Regional Analysis |
    1. 6.1 North America | |
      1. 6.1.1 United States | |
      2. 6.1.2 Canada | |
      3. 6.1.3 Mexico |
    2. 6.2 Europe | |
      1. 6.2.1 Germany | |
      2. 6.2.2 United Kingdom | |
      3. 6.2.3 France | |
      4. 6.2.4 Italy | |
      5. 6.2.5 Spain | |
      6. 6.2.6 Nordic Countries | |
      7. 6.2.7 Russia | |
      8. 6.2.8 Rest of Europe |
    3. 6.3 Asia-Pacific | |
      1. 6.3.1 China | |
      2. 6.3.2 India | |
      3. 6.3.3 Japan | |
      4. 6.3.4 South Korea | |
      5. 6.3.5 ASEAN | |
      6. 6.3.6 Rest of Asia-Pacific |
    4. 6.4 South America | |
      1. 6.4.1 Brazil | |
      2. 6.4.2 Argentina | |
      3. 6.4.3 Rest of South America |
    5. 6.5 Middle East & Africa | |
      1. 6.5.1 Saudi Arabia | |
      2. 6.5.2 UAE | |
      3. 6.5.3 South Africa | |
      4. 6.5.4 Egypt | |
      5. 6.5.5 Rest of MEA
  7. 7 Competitive Landscape |
    1. 7.1 Market Share Analysis (2025) |
    2. 7.2 Competitive Benchmarking Matrix |
    3. 7.3 Company Profiles | |
      1. 7.3.1 Cosentino Group | |
      2. 7.3.2 Levantina y Asociados de Minerales | |
      3. 7.3.3 Polycor Inc. | |
      4. 7.3.4 Pokarna Limited | |
      5. 7.3.5 Antolini Luigi & C. S.p.A. | |
      6. 7.3.6 Coldspring | |
      7. 7.3.7 Temmer Marble | |
      8. 7.3.8 Fox Marble Holdings | |
      9. 7.3.9 Indiana Limestone Company | |
      10. 7.3.10 R.E.D. Graniti S.p.A.
  8. 8 Future Outlook & Strategic Recommendations (2026–2035) |
    1. 8.1 Autonomous Quarrying and Robotics Integration |
    2. 8.2 Sustainability Reporting and EPD Standardization |
    3. 8.3 Platform Economics and Digital Marketplaces |
    4. 8.4 Circular Economy and Carbon-Neutral Stone
  9. 9 Recent Developments & News
  10. 10 Frequently Asked Questions (FAQs)
  11. 11 Report Scope & Methodology |
    1. 11.1 Study Period & Base Year |
    2. 11.2 Data Sources & Citations |
    3. 11.3 Abbreviations
  12. 12 LIST OF TABLES |
  13. TABLE 1 Global Natural Stone Market Size & Forecast, by Revenue (USD Billion), 2021–2035 |
  14. TABLE 2 Global Natural Stone Market — Year-over-Year Growth Analysis, 2021–2035 |
  15. TABLE 3 Driver Impact Analysis — Global Natural Stone Market |
  16. TABLE 4 Restraint Impact Analysis — Global Natural Stone Market |
  17. TABLE 5 Global Natural Stone Market Size, by Type, 2021–2035 (USD Billion) |
  18. TABLE 6 Global Natural Stone Market Size, by Form, 2021–2035 (USD Billion) |
  19. TABLE 7 Global Natural Stone Market Size, by Color Group, 2021–2035 (USD Billion) |
  20. TABLE 8 Global Natural Stone Market Size, by Application, 2021–2035 (USD Billion) |
  21. TABLE 9 Global Natural Stone Market Size, by End-User Industry, 2021–2035 (USD Billion) |
  22. TABLE 10 Global Natural Stone Market Size, by Region, 2021–2035 (USD Billion) |
  23. TABLE 11 North America Natural Stone Market Size, by Country, 2021–2035 (USD Billion) |
  24. TABLE 12 Europe Natural Stone Market Size, by Country, 2021–2035 (USD Billion) |
  25. TABLE 13 Asia-Pacific Natural Stone Market Size, by Country, 2021–2035 (USD Billion) |
  26. TABLE 14 South America Natural Stone Market Size, by Country, 2021–2035 (USD Billion) |
  27. TABLE 15 Middle East & Africa Natural Stone Market Size, by Country, 2021–2035 (USD Billion) |
  28. TABLE 16 Competitive Benchmarking Matrix — Global Natural Stone Market, 2025 |
  29. TABLE 17 Company Profiles — Key Players, Global Natural Stone Market |
  30. TABLE 18 Recent Developments & Strategic Announcements, 2023–2025 |
  31. TABLE 19 Report Scope & Methodology Summary |
  32. TABLE 20 Detailed Sources and Citations |
  33. TABLE 21 North America Natural Stone Market Size, by Type, 2021–2035 (USD Billion) |
  34. TABLE 22 North America Natural Stone Market Size, by Form, 2021–2035 (USD Billion) |
  35. TABLE 23 North America Natural Stone Market Size, by Color Group, 2021–2035 (USD Billion) |
  36. TABLE 24 North America Natural Stone Market Size, by Application, 2021–2035 (USD Billion) |
  37. TABLE 25 North America Natural Stone Market Size, by End-User Industry, 2021–2035 (USD Billion) |
  38. TABLE 26 Europe Natural Stone Market Size, by Type, 2021–2035 (USD Billion) |
  39. TABLE 27 Europe Natural Stone Market Size, by Form, 2021–2035 (USD Billion) |
  40. TABLE 28 Europe Natural Stone Market Size, by Color Group, 2021–2035 (USD Billion) |
  41. TABLE 29 Europe Natural Stone Market Size, by Application, 2021–2035 (USD Billion) |
  42. TABLE 30 Europe Natural Stone Market Size, by End-User Industry, 2021–2035 (USD Billion) |
  43. TABLE 31 Asia-Pacific Natural Stone Market Size, by Type, 2021–2035 (USD Billion) |
  44. TABLE 32 Asia-Pacific Natural Stone Market Size, by Form, 2021–2035 (USD Billion) |
  45. TABLE 33 Asia-Pacific Natural Stone Market Size, by Color Group, 2021–2035 (USD Billion) |
  46. TABLE 34 Asia-Pacific Natural Stone Market Size, by Application, 2021–2035 (USD Billion) |
  47. TABLE 35 Asia-Pacific Natural Stone Market Size, by End-User Industry, 2021–2035 (USD Billion) |
  48. TABLE 36 South America Natural Stone Market Size, by Type, 2021–2035 (USD Billion) |
  49. TABLE 37 South America Natural Stone Market Size, by Form, 2021–2035 (USD Billion) |
  50. TABLE 38 South America Natural Stone Market Size, by Color Group, 2021–2035 (USD Billion) |
  51. TABLE 39 South America Natural Stone Market Size, by Application, 2021–2035 (USD Billion) |
  52. TABLE 40 South America Natural Stone Market Size, by End-User Industry, 2021–2035 (USD Billion) |
  53. TABLE 41 Middle East & Africa Natural Stone Market Size, by Type, 2021–2035 (USD Billion) |
  54. TABLE 42 Middle East & Africa Natural Stone Market Size, by Form, 2021–2035 (USD Billion) |
  55. TABLE 43 Middle East & Africa Natural Stone Market Size, by Color Group, 2021–2035 (USD Billion) |
  56. TABLE 44 Middle East & Africa Natural Stone Market Size, by Application, 2021–2035 (USD Billion) |
  57. TABLE 45 Middle East & Africa Natural Stone Market Size, by End-User Industry, 2021–2035 (USD Billion)
  58. 13 LIST OF FIGURES |
  59. FIGURE 1 Global Natural Stone Market Dynamics — Drivers, Restraints, and Opportunities |
  60. FIGURE 2 Industry Value Chain Analysis — Natural Stone Market |
  61. FIGURE 3 Porter's Five Forces Analysis — Natural Stone Market |
  62. FIGURE 4 Global Natural Stone Market Size Trend (USD Billion), 2021–2035 |
  63. FIGURE 5 Natural Stone Market Share, by Type (%), 2025 |
  64. FIGURE 6 Natural Stone Market Share, by Form (%), 2025 |
  65. FIGURE 7 Natural Stone Market Share, by Color Group (%), 2025 |
  66. FIGURE 8 Natural Stone Market Share, by Application (%), 2025 |
  67. FIGURE 9 Natural Stone Market Share, by End-User Industry (%), 2025 |
  68. FIGURE 10 Natural Stone Market Share, by Region (%), 2025 |
  69. FIGURE 11 North America Natural Stone Market Size Trend (USD Billion), 2021–2035 |
  70. FIGURE 12 Europe Natural Stone Market Size Trend (USD Billion), 2021–2035 |
  71. FIGURE 13 Asia-Pacific Natural Stone Market Size Trend (USD Billion), 2021–2035 |
  72. FIGURE 14 South America Natural Stone Market Size Trend (USD Billion), 2021–2035 |
  73. FIGURE 15 Middle East & Africa Natural Stone Market Size Trend (USD Billion), 2021–2035 |
  74. FIGURE 16 Competitive Landscape — Market Share Analysis, 2025

Segmentation Quick Reference

DimensionSub-SegmentsDominant SegmentFastest Growing Segment
By TypeGranite, Marble, Limestone, Sandstone/Slate/OthersGranite (28.5% share, 2025)Marble (6.25% CAGR)
By FormSlabs, Blocks, TilesSlabs (41.2% share, 2025)Tiles (6.30% CAGR)
By Color GroupWhite and Light, Dark, ColoredWhite and Light (27.3% share, 2025)Dark (5.85% CAGR)
By ApplicationFlooring & Wall Cladding, Exterior, Monuments & Statues, Countertops & VanitiesFlooring & Wall Cladding (36.5% share, 2025)Exterior Applications (5.18% CAGR)
By End-User IndustryResidential, Commercial, Industrial, OthersResidential (37.8% share, 2025)Commercial (5.48% CAGR)
By RegionNorth America, Europe, Asia-Pacific, South America, Middle East & AfricaAsia-Pacific (44.1% share, 2025)Asia-Pacific (6.35% CAGR)


Market Segmentation Overview

By Type

Sub-SegmentKey Trend
GraniteSteady demand from infrastructure and commercial paving; price-competitive against engineered alternatives
MarbleLuxury-hospitality specification growth; thin-panel technology expanding addressable applications
LimestoneHeritage-restoration mandates in Europe sustain specification rates
Sandstone, Slate & OthersNiche artisanal and monument demand; slate roofing stable in Northern Europe and Northeast US


Granite remains the workhorse material for large-scale infrastructure and commercial installations. At the same time, marble captures the premium end of the spectrum with its aesthetic versatility and growing applicability through lightweight composite backing systems.

By Form

Sub-SegmentKey Trend
SlabsCountertop fabrication and façade panels drive volume; average thickness declining toward 20 mm
BlocksRaw-material export trade between quarry-origin and processing-hub countries remains robust.
TilesModular construction and large-format tile adoption accelerating across commercial interiors


Slabs represent the highest-value processing stage and anchor the revenue mix, while tiles are gaining ground as calibrated thin formats offer weight and installation-cost advantages over traditional thick-cut products.

By Color Group

Sub-SegmentKey Trend
White and LightSustained by Carrara-white and Calacatta design trends in residential and hospitality sectors
DarkGrowing demand for high-contrast interior design in luxury commercial spaces
ColoredRegional architectural traditions and custom heritage projects support stable demand


White and light stones benefit from enduring consumer preference for minimalist and Scandinavian-inspired interiors, while dark-toned varieties are gaining traction in statement-wall and luxury-lobby applications.

By Application

Sub-SegmentKey Trend
Flooring and Wall CladdingLargest application; stable demand across residential and commercial interior finishing
Exterior ApplicationsFastest growth driven by façade cladding, paving, and landscape hardscaping
Monuments and StatuesHeritage and memorial project pipelines provide stable niche demand
Countertops and VanitiesResidential renovation cycles in North America and Europe drive consistent replacement demand


Flooring and wall cladding remain the backbone of stone consumption globally, while exterior applications are accelerating as architects adopt ventilated-façade systems and lightweight composite panels.

By End-User Industry

Sub-SegmentKey Trend
ResidentialKitchen and bathroom renovation surge; premium new-build specification in emerging markets
CommercialHospitality, retail, and corporate office fit-outs favor natural stone for brand differentiation
IndustrialChemical-resistant and heavy-duty flooring applications in manufacturing environments
OthersPublic landscape projects, religious structures, and government buildings


Residential consumption leads the end-user mix globally, though commercial projects are growing fastest as hotel chains and corporate developers specify natural stone for its perceived permanence and brand-enhancing aesthetic.


 

Download PDF ×

We do not share your information with anyone. However, we may send you emails based on your report interest from time to time. You may contact us at any time to opt-out.