Next Generation Sequencing Market (2026 - 2035)

Next Generation Sequencing Market Research Report: Size, Share, Trend Analysis By Technology (Sequencing by Synthesis, Ion Semiconductor Sequencing, Single-Molecule Real-Time Sequencing, Nanopore Sequencing, Other Technologies), By Product Type (Reagents, Instruments, Software, Services), By Applications (Diagnostics, Research, Personalized Medicine, Agrigenomics), By End Use (Academic Institutes, Pharmaceutical Companies, Biotechnology Companies, Hospitals and Clinics) and By Regional (North America, Europe, South America, Asia Pacific, Middle East and Africa) - Growth Outlook & Industry Forecast 2025 To 2035

Forecast Period
2026-2035
CAGR
14.7%
2025 Market Size
USD 11.02 Billion
2035 Market Size
USD 42.61 Billion
Healthcare ● Updated August 24, 2026 Report ID: MRFR/HC/4893-HCR | Pages: 200 | Author: Rahul Gotadki, Nidhi Mandole

Next Generation Sequencing Market Summary

The Next Generation Sequencing (NGS) Market reached USD 11.02 billion in 2025 and is projected to grow to USD 42.61 billion by 2035, expanding at a compound annual growth rate (CAGR) of 14.7% between 2026 and 2035. Market value is expected to reach USD 12.40 billion in 2026 as the first year of the forecast period. This growth is being driven primarily by expanding clinical reimbursement for genomic profiling and large-scale public sequencing initiatives, alongside a broader shift toward faster, higher-output sequencing instruments.

Precision-medicine reimbursement expansion across the United States and Japan has moved comprehensive genomic profiling from research budgets into routine clinical line items, significantly widening the population of patients receiving genomic testing as part of standard care. At the same time, sovereign genomics programs, including the European Union's 1+ Million Genomes initiative, have committed public capital to sequencing capacity that private demand alone would not have justified.

Instrument fleets in sequencing laboratories are also turning over faster than at any point since short-read chemistry displaced capillary electrophoresis. Laboratories are retiring mid-life benchtop platforms in favor of high-output systems and on-cartridge workflows that compress turnaround time from days to hours. Cost per genome has fallen below the USD 200 threshold on flagship platforms, a decline the National Human Genome Research Institute has tracked as steeper than Moore's Law across two decades, reinforcing the pace at which older instruments are becoming economically obsolete.

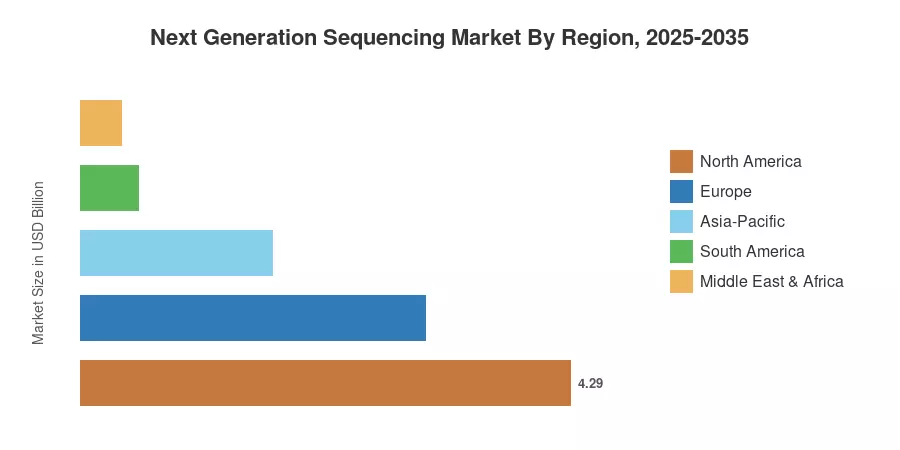
By region, North America holds the largest share of the Next Generation Sequencing Market, at 38.9% of 2025 revenue, supported by deep clinical reimbursement and a dense academic core-lab base. Asia-Pacific is the fastest-growing region, with a projected CAGR of 15.2% through 2035, propelled by China's domestic instrument manufacturers and India's GenomeIndia programme. Europe holds the second-largest position, where IVDR compliance is consolidating demand toward validated, audit-ready sequencing platforms. Over the decade ahead, vendors that decouple consumables revenue from hardware sales are expected to be best positioned for growth.


Key Report Takeaways

• By Type of Sequencing


  • Targeted resequencing led the Next Generation Sequencing Market with a 35.4% revenue share in 2025, reflecting oncology panel volumes in hospital pathology labs.
  • Whole exome sequencing is the fastest-expanding sequencing type at a 15.2% CAGR through 2035


• By Application


  • Drug discovery and personalized medicine contributed USD 3.61 billion in 2025
  • Genetic screening is advancing at a 15.3% CAGR, the highest among applications.


• By Region

  • North America commanded 38.9% of the Next Generation Sequencing Market in 2025
  • Asia-Pacific is set to register a 15.2% CAGR from 2026 to 2035
  • Europe generated USD 3.02 billion in 2025 revenue


Market Size and Forecast (2021–2035)

Estimates below blend bottom-up instrument installed-base modelling with top-down revenue triangulation from public filings of ten leading suppliers, cross-checked against reagent consumption per installed sequencer and reported run volumes at national biobanks. Historical years are reconciled to audited segment disclosures where available; forecast years apply adoption-curve modelling by clinical indication.
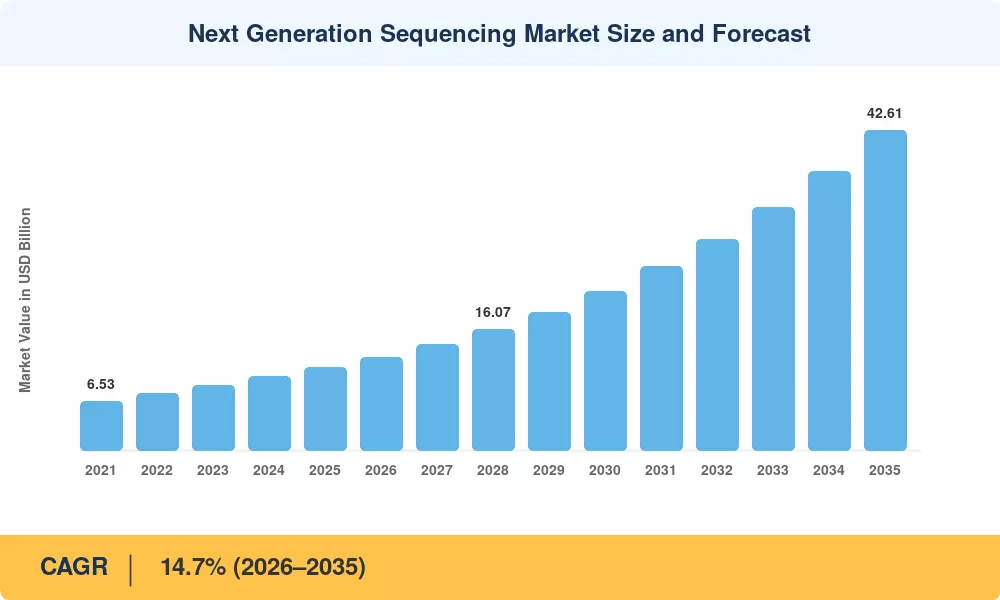
Next Generation Sequencing Market Size and Forecast
Our Impact
Enabled $4.3B Revenue Impact for Fortune 500 and Leading Multinationals
Partnering with 2000+ Global Organizations Each Year
30K+ Citations by Top-Tier Firms in the Industry

Driver Impact Analysis

Impact percentages express each driver's directional contribution to headline growth. They are modelled independently and should not be summed against the 14.7% CAGR; overlapping effects and offsetting restraints are reconciled separately in the composite forecast.

Driver ~% Impact on CAGR Geographic Relevance Impact Timeline
Precision oncology and companion diagnostics +2.6 North America, Europe, Japan Medium-term (2–4 yr)
National population genomics programmes +2.1 UK, EU, China, Gulf, India Long-term (≥4 yr)
Falling cost per genome and open chemistry +1.9 Global Short-term (≤2 yr)
Reimbursement expansion for genomic profiling +1.5 US, Japan Medium-term (2–4 yr)
Rare disease and newborn screening adoption +1.3 Europe, Asia-Pacific Long-term (≥4 yr)
Biopharma multiomics R&D pipelines +1.1 Global Medium-term (2–4 yr)
Pathogen genomic surveillance mandates +0.8 Global Short-term (≤2 yr)


Precision Oncology Moves Into Standard of Care

Comprehensive genomic profiling has crossed from tertiary cancer centres into community oncology. The Centers for Medicare & Medicaid Services national coverage determination for sequencing-based cancer diagnostics established reimbursement for FDA-approved companion diagnostics in advanced solid tumours, converting a discretionary test into a billable one [8]. That single policy shift underwrites much of the Next Generation Sequencing Market's clinical volume growth, and hospital pathology departments now run panel workflows on fixed weekly schedules rather than batching for cost efficiency.

Sovereign Genomics Programmes Anchor Baseline Demand

Public commitments have created a demand floor insulated from research funding cycles. The European Union's 1+ Million Genomes initiative brought together participating member states around cross-border genomic data access [17], while Genomics England's Generation Study began sequencing newborns at population scale in late 2024 [3]. India's GenomeIndia project completed reference sequencing across thousands of individuals spanning the country's population groups [20]. Procurement under these programmes runs on multi-year frameworks, giving suppliers revenue visibility that commercial channels rarely offer.

Cost Curves Keep Rewriting the Addressable Base

Sequencing economics remain the strongest structural driver. NHGRI cost tracking shows per-genome pricing falling by orders of magnitude since 2008, far outpacing semiconductor cost curves [2]. Each step down converts a previously uneconomic application — routine carrier screening, minimal residual disease monitoring, agricultural trait selection — into a viable one. Vendors offering open-chemistry instruments have accelerated this by unbundling reagents from hardware, pressuring proprietary ecosystem margins.

Biopharma Rebuilds Discovery Around Sequence Data

Pharmaceutical R&D organisations have restructured target identification around large-scale genomic datasets. Roche, Thermo Fisher Scientific, and Qiagen each report sequencing-linked revenue growth tied to pharma service contracts and translational research programmes [9][10][11]. Single-cell and spatial workflows layered onto existing sequencers have raised reagent consumption per instrument without requiring new capital purchases.


Restraints Impact Analysis

Restraint ~% Impact on CAGR Geographic Relevance Impact Timeline
Reagent supply chain and export-control exposure −1.4 Global; acute in China, US Short-term (≤2 yr)
Coverage gaps outside oncology indications −1.2 Europe, Latin America Medium-term (2–4 yr)
Bioinformatics and clinical genomics talent shortage −1.0 Global Long-term (≥4 yr)
Genomic data privacy and localisation rules −0.8 EU, China, Gulf Medium-term (2–4 yr)
Academic capital budget compression −0.6 North America, Europe Short-term (≤2 yr)


Supply Chains Reclassified as Strategic Vulnerabilities

Trade policy has become a first-order commercial risk in the Next Generation Sequencing Market. Export controls administered through the U.S. Bureau of Industry and Security cover semiconductor components embedded in sequencing optics and flow-cell fabrication [21], while China's countermeasures during 2025 restricted imports of certain foreign-manufactured sequencers. Laboratories running single-vendor fleets now face procurement committees demanding dual-sourcing plans before capital approval.

Reimbursement Stops at the Oncology Boundary

Once you get beyond cancer testing, coverage is still spotty. [7] Rare illness exome sequencing, pharmacogenomic panels and carrier screening are inconsistently treated by payers across European health systems, and IVDR conformity standards have increased the cost of compliance to bring assays to market. Laboratories thus either pay the cost of testing or restrict access, capping volume growth for indications where therapeutic usefulness is clearly established.


Interpretation Capacity Lags Sequencing Capacity

The bottleneck is not in producing reads anymore, but in understanding them. OECD health workforce analysis indicates chronic shortages of specialized diagnostic roles in member nations [15], with clinical genomics being one of the tightest. Credentialed workers with training pipelines that can’t grow at instrument-shipment speed are needed for variant curation, tertiary analysis and reporting.


Next Generation Sequencing Market Opportunities

Decentralised Clinical Sequencing at the Point of Care

On-cartridge library prep benchtop equipment, at under $50,000, open community hospitals and regional labs that could never finance a core facility. Vendors that place here trade instrument margin for ongoing consumable revenue, and the Next Generation Sequencing Market rewards that trade as placement density increases.


Genomic Data Monetisation and Federated Analytics

Sequence data are valuable beyond the experiment that generated them. Biobank-pharma collaborations licensing access to de-identified cohorts have generated a services revenue stream separate from instrument sales, and federated architectures enable analysis without transferring data across borders – aligning commercial demand with localization rules.


Emerging-Market Capacity Build-Out

Gulf states, Southeast Asia, and Latin America represent the clearest geographic gap. Saudi Arabia's national genome programme and comparable Emirati initiatives fund sequencing infrastructure alongside clinical training [18], and suppliers who bundle installation, informatics, and workforce development capture share that pure hardware bidders cannot.

Multiomics Convergence on Existing Fleets

Spatial transcriptomics, single-cell profiling, and proteogenomic workflows run on installed sequencers, raising utilisation without new capital. This is the highest-margin growth vector available to incumbents in the Next Generation Sequencing Market.

Carbon-Accounted Procurement

Public biobanks have begun embedding energy footprint per terabase into vendor scorecards. Suppliers who publish verified consumption data and reduce plastic consumable waste will win tenders on non-price criteria.


Next Generation Sequencing Market Future Outlook

Machine Learning Absorbs the Interpretation Layer

Variant calling and tertiary analysis are migrating to model-based pipelines that flag clinically actionable findings before human review. This compresses reporting turnaround and partially relieves the workforce constraint identified in Section 5.3. Vendors bundling validated informatics with instruments will defend pricing better than hardware-only competitors as the Next Generation Sequencing Market matures.

Platform Economics Shift From Razor-Blade to Open Systems

Proprietary consumable lock-in delivered decades of margin. Open-chemistry entrants have broken that model in the mid-throughput tier, and reagent gross margins are compressing accordingly. Incumbents are responding with service contracts, informatics subscriptions, and application-specific kits rather than defending consumable exclusivity outright.

Clinical Sequencing Displaces Research as the Volume Driver

Academic spending still leads share today, but clinical indications compound faster. Hereditary cancer risk, minimal residual disease monitoring, and prenatal screening each carry recurring test volumes tied to patient populations rather than grant cycles, shifting the demand base toward predictability by the early 2030s.

Sustainability Reporting Enters Procurement Scoring

Public research funders have begun requiring supplier environmental disclosure. OECD health system analysis has raised laboratory resource efficiency as a policy concern [15], and biobanks are translating that into tender criteria covering energy per terabase and single-use plastic reduction. Suppliers without audited data will lose points before price is compared.


Next Generation Sequencing Market Segmentation

Segmentation in the Next Generation Sequencing Market follows four commercially meaningful dimensions: type of sequencing, product type, application, and end user.

By Type of Sequencing

Segment Metric (2025) Primary Demand Driver
Targeted Resequencing 35.4% share Oncology panel volumes in hospital pathology
Whole Genome Sequencing USD 2.71 Billion Population cohorts and rare disease diagnosis
Whole Exome Sequencing 15.2% CAGR (2026–2035) Undiagnosed paediatric disease pathways
RNA Sequencing 12.8% share Transcriptomic profiling in drug discovery
ChIP Sequencing USD 0.62 Billion Epigenetic regulation research
Methyl Sequencing 14.9% CAGR (2026–2035) Early cancer detection assay development


Targeted resequencing leads because it matches clinical workflow economics. Panels covering fifty to five hundred genes deliver actionable results at a price payers will reimburse, and turnaround fits treatment decision timelines. Whole exome sequencing grows fastest as diagnostic odysseys for rare disease shift toward broader first-line testing — Genomics England and comparable European programmes have demonstrated diagnostic yields that justify the incremental cost [3].

By Product Type

Segment Metric (2025) Primary Demand Driver
Reagents and Consumables 65.0% share Recurring run volume across installed fleets
Instruments 15.4% CAGR (2026–2035) Fleet replacement and benchtop decentralisation
Services USD 1.34 Billion Outsourced sequencing for biopharma and biobanks


Consumables dominate revenue because installed instruments consume kits continuously, and this is where open-chemistry competition bites hardest. Instruments nonetheless grow fastest through 2035 as the replacement cycle for platforms purchased during the pandemic surveillance build-out arrives simultaneously with a new generation of benchtop systems priced for decentralised placement.

By Application

Segment Metric (2025) Primary Demand Driver
Drug Discovery and Personalized Medicine USD 3.61 Billion Target identification and patient stratification
Diagnostics 24.1% share Reimbursed oncology and infectious disease testing
Genetic Screening 15.3% CAGR (2026–2035) Newborn and carrier screening programmes
Agriculture and Animal Research 12.3% share Trait selection and livestock breeding
Reproductive Health and Other 14.4% CAGR (2026–2035) Non-invasive prenatal testing expansion


Drug discovery and personalized medicine remain the dominant application within the Next Generation Sequencing market, driven by expanding adoption in target identification, companion diagnostics, and precision oncology trial stratification. Genetic screening is the fastest-growing application, propelled by scaled population initiatives, declining sequencing expenses, and broader clinical inclusion of routine carrier and newborn screening protocols.

By End User

Segment Metric (2025) Primary Demand Driver
Academics 45.1% share Grant-funded research and core facility capacity
Pharmaceutical and Biotechnology Companies USD 3.04 Billion Translational research and companion diagnostics
Hospitals and Healthcare Institutions 15.6% CAGR (2026–2035) In-house clinical sequencing adoption
Clinics and Other End Users 6.9% share Specialty testing and direct-to-consumer channels


Academic institutions retain the largest share, but hospitals grow fastest as clinical laboratories bring testing in-house rather than sending specimens to reference providers. That transition depends on benchtop instrument economics and validated informatics arriving together — where either is missing, send-out models persist.


Regional Market Share Analysis

Region Metric (2025) Primary Investment Themes
North America 38.9% share Clinical reimbursement, oncology panels, biopharma R&D
Europe USD 3.02 Billion IVDR compliance, 1+MG cross-border data, rare disease
Asia-Pacific 15.2% CAGR (2026–2035) Domestic instruments, national cohorts, agrigenomics
South America USD 0.51 Billion Public health labs, oncology access expansion
Middle East & Africa 3.3% share Sovereign genome programmes, consanguinity screening
Total USD 11.02 Billion

Regional performance in the Next Generation Sequencing Market reflects the interaction of reimbursement depth, sovereign programme funding, and domestic manufacturing capability rather than population size alone.


North America

Country Share of Region Key Driver
US 84.5% CMS coverage for genomic profiling in advanced cancers
Canada 8.2% Provincial rare disease sequencing programmes
Mexico 7.3% Private oncology laboratory network expansion


The United States dominates the Next Generation Sequencing Market through payer infrastructure rather than instrument density alone. The FDA's laboratory developed test framework published in 2024 reshaped how reference laboratories validate assays [6], pushing volume toward platforms with regulatory clearance. Canada's provincial health systems fund exome sequencing for undiagnosed paediatric cases, while Mexican private hospital groups have built oncology panel capacity to serve cross-border demand.

Europe

Country Share of Region Key Driver
Germany 22.1% University hospital genomics networks
UK 19.4% Generation Study and NHS Genomic Medicine Service
France 13.6% Plan France Médecine Génomique sequencing platforms
Italy 9.2% Regional oncology network consolidation
Spain 7.1% Rare disease reference centre designations
Nordic Countries 8.4% Population biobank linkage to health records
Russia 4.3% Domestic sequencing capacity substitution
Rest of Europe 15.9% EU cohesion funding for laboratory modernisation


European demand is regulation-shaped. IVDR transition timelines have forced laboratories to replace in-house assays with conformity-assessed products or seek exemptions, concentrating spend on validated platforms [7]. Genomics England's newborn sequencing study represents the largest single clinical cohort commitment in the region [3], and Nordic biobanks continue to differentiate through registry linkage rather than raw volume.

Asia-Pacific

Country Share of Region Key Driver
China 33.8% Domestic instrument manufacturing and provincial cohorts
Japan 20.2% AMED-funded genomic medicine and cancer gene panel coverage
India 13.1% GenomeIndia reference cohort and diagnostics affordability
South Korea 10.4% National bio big data project
ASEAN 9.7% Infectious disease surveillance networks
Rest of Asia-Pacific 12.8% Agrigenomics and livestock breeding programmes


Asia-Pacific is the growth engine of the Next Generation Sequencing Market, and domestic supply is the reason. Chinese manufacturers have scaled ultra-high-throughput platforms that undercut imported systems on cost per gigabase, while Japan's AMED programmes fund genomic medicine implementation across designated core hospitals [19]. India pairs the GenomeIndia reference dataset with a price-sensitive diagnostics sector that rewards benchtop economics [20].

South America

Country Share of Region Key Driver
Brazil 54.9% SUS oncology diagnostics and private laboratory chains
Argentina 18.6% Academic sequencing cores and rare disease networks
Rest of South America 26.5% Public health genomic surveillance capacity


Brazil anchors regional demand through a two-tier structure: public system oncology testing at controlled prices alongside private laboratory networks serving insured populations. Currency volatility complicates capital purchases, pushing buyers toward reagent-rental and managed-service contracts. Surveillance infrastructure funded during the pandemic period has been repurposed for arbovirus and antimicrobial resistance monitoring across the region [16].

Middle East & Africa

Country Share of Region Key Driver
Saudi Arabia 29.4% National genome programme and consanguinity screening
UAE 21.7% Emirati Genome Programme and medical tourism diagnostics
South Africa 18.3% TB and HIV genomic surveillance platforms
Egypt 11.2% University hospital capacity expansion
Rest of MEA 19.4% Donor-funded pathogen sequencing networks


Gulf sovereign programmes have compressed a decade of capacity building into a few procurement cycles. Saudi Arabia's national genome initiative, coordinated through state research institutions, funds instruments, informatics, and clinical training as a single package [18]. Sub-Saharan demand is driven differently — pathogen sequencing networks built around tuberculosis and HIV drug resistance monitoring operate on donor budgets aligned to WHO surveillance strategy [16].


Next Generation Sequencing Market By Region, 2025-2035

Competitive Benchmarking

Concentration is moderate and softening. Estimated HHI sits near 1,650, with the top five suppliers holding roughly 62–70% of global revenue. A single incumbent still anchors the high-throughput tier, but open-chemistry entrants and Chinese manufacturers have fragmented the mid-throughput and regional segments materially since 2023. Revenue share ranges below are analyst estimates and will not sum precisely.

Company Est. Revenue Share Range Key Offerings for Next Generation Sequencing Market Strategic Positioning
Illumina, Inc. ~34–40% NovaSeq X series, NextSeq, MiSeq i100, DRAGEN informatics Scale incumbent defending consumable ecosystem [1]
Thermo Fisher Scientific ~10–13% Ion Torrent Genexus, Oncomine assays, sample prep Clinical workflow breadth and pharma services [9]
BGI Genomics / MGI Tech ~7–10% DNBSEQ platforms, ultra-high-throughput systems Cost leadership; strongest in Asia-Pacific [14]
F. Hoffmann-La Roche AG ~5–8% Sequencing chemistry development, diagnostics portfolio Re-entering platform tier via novel chemistry [10]
QIAGEN N.V. ~4–6% QIAseq panels, sample-to-insight workflows, informatics Sample prep and interpretation specialist [11]
Oxford Nanopore Technologies ~3–5% MinION, GridION, PromethION long-read systems Real-time, portable long-read differentiation [12]
Pacific Biosciences ~2–4% Revio and Vega HiFi long-read platforms Accuracy-led long-read positioning [13]
Agilent Technologies ~2–4% SureSelect target enrichment, quality control systems Enrichment and upstream workflow depth
Element Biosciences ~1–3% AVITI benchtop sequencing systems Open-chemistry disruptor in mid-throughput tier
Ultima Genomics ~1–2% UG 100 high-scale sequencing platform Ultra-low cost per genome for large cohorts
10x Genomics ~1–3% Single-cell and spatial workflow solutions Application layer riding installed sequencer base
Eurofins Genomics ~1–3% Outsourced sequencing and analysis services Service-model access without capital outlay


Recent News & Developments

  • Pacific Biosciences (2023): Commercial shipments of the Revio long-read system began, sharply increasing HiFi output per instrument and expanding long-read viability for population-scale projects [13]
  • MGI Tech (2023): Introduced ultra-high-throughput DNBSEQ systems positioned for national cohort programmes, intensifying cost-per-gigabase competition outside Western markets [14]
  • Illumina (June 2024): Completed the separation of GRAIL as an independent public company, refocusing capital on core sequencing platforms and informatics [1]
  • U.S. FDA (May 2024): Published its final rule on laboratory-developed tests, phasing in device-framework oversight and reshaping validation economics for reference laboratories [6]
  • Thermo Fisher Scientific (July 2024): Closed its acquisition of Olink, extending multiomics capability adjacent to sequencing workflows and deepening pharma research relationships [9]
  • Genomics England (October 2024): Launched the Generation Study to sequence newborn genomes at population scale, establishing the largest clinical newborn sequencing cohort to date [3]
  • Roche (February 2025): Unveiled its sequencing-by-expansion chemistry, signalling a credible new entrant into the platform tier for the first time in over a decade [10]
  • China Ministry of Commerce (2025): Imposed restrictions affecting imports of certain foreign-manufactured sequencing instruments, accelerating domestic substitution across Chinese laboratories [21]


Next Generation Sequencing Market Report Scope

Parameter Detail
Market Scope Global sequencing instruments, reagents and consumables, and services across research, clinical, and applied end markets
Study Period 2021–2035 (Historical 2021–2024; Base Year 2025; Forecast 2026–2035)
CAGR 14.7% (2026–2035)
Market Size Checkpoints USD 11.02 Billion (2025); USD 12.40 Billion (2026); USD 42.61 Billion (2035)
Fastest Growing Segments Whole exome sequencing; instruments; genetic screening; hospitals and healthcare institutions
Fastest Growing Region Asia-Pacific (15.2% CAGR, 2026–2035)
Companies Profiled Illumina, Thermo Fisher Scientific, BGI Genomics/MGI Tech, Roche, QIAGEN, Oxford Nanopore, Pacific Biosciences, Agilent, Element Biosciences, Ultima Genomics, 10x Genomics, Eurofins Genomics
Valuation Currency USD Billion (constant 2025 dollars)
Estimation Basis Figures represent Market Research Future modelled estimates derived from public filings, programme disclosures, and installed-base analysis; they are not audited industry totals

FAQs

What procurement criteria matter most when buying into the Next Generation Sequencing Market today?
Total cost per sample matters more than instrument list price. Evaluate reagent contract terms, informatics licensing, service response guarantees, and whether the chemistry is open or proprietary. Dual-sourcing feasibility has become a standard requirement in institutional tenders [21].
How should buyers weigh short-read against long-read platforms?
Short-read systems remain cheaper per base and suit panels, exomes, and resequencing. Long-read platforms resolve structural variants, repeat expansions, and phasing that short reads miss. Many well-funded labs now run both rather than choosing [12][13].
Is vendor lock-in still a material risk in the Next Generation Sequencing Market?
Less than it was. Open-chemistry entrants have made mid-throughput fleets genuinely mixable, though informatics migration remains the harder switching cost. Negotiate data portability terms before signing multi-year reagent commitments.
What regulatory nuance most often surprises new clinical entrants?
IVDR conformity assessment in Europe applies to in-house assays, not just commercial kits, and exemption conditions are narrower than many laboratories assume [7]. Budget compliance timelines of twelve to eighteen months before launch.
Which emerging application will scale fastest outside oncology?
Newborn and carrier screening. Population programmes have moved from pilots to standing services, and per-test economics now clear reimbursement thresholds in several European systems [3].
How do integration challenges affect returns in the Next Generation Sequencing Market?
Laboratory information system integration and variant curation capacity determine realised throughput far more than instrument specifications. Underinvesting here leaves expensive fleets running well below rated capacity [15].
What competitive shift should investors watch through 2028?
Reagent gross margin compression at the incumbent tier. If open-chemistry share gains continue, the razor-blade model that funded a decade of platform R&D weakens, changing how new instrument development gets financed [1].    
Author
Author
Author Profile
Rahul Gotadki LinkedIn
Research Manager
He holds an experience of about 9+ years in Market Research and Business Consulting, working under the spectrum of Life Sciences and Healthcare domains. Rahul conceptualizes and implements a scalable business strategy and provides strategic leadership to the clients. His expertise lies in market estimation, competitive intelligence, pipeline analysis, customer assessment, etc.
Co-Author
Co-Author Profile
Nidhi Mandole LinkedIn
Senior Research Analyst
She is an extremely curious individual currently working in Healthcare and Medical Devices Domain. Nidhi is comfortably versed in data centric research backed by healthcare educational background. She leverages extensive data mining and analytics tools such as Primary and Secondary Research, Statistical Analysis, Machine Learning, Data Modelling. Her key role also involves Technical Sales Support, Client Interaction and Project management within the Healthcare team. Lastly, she showcases extensive affinity towards learning new skills and remain fascinated in implementing them.
Share::
Request Free Sample

Research Approach


Secondary Research

The secondary research process involved comprehensive analysis of genomic surveillance databases, peer-reviewed biomedical journals, clinical sequencing publications, and authoritative molecular diagnostics organizations. Key sources included the US Food & Drug Administration (FDA) Center for Devices and Radiological Health (CDRH), Centers for Medicare & Medicaid Services (CMS) for genomic test reimbursement codes, National Human Genome Research Institute (NHGRI), National Center for Biotechnology Information (NCBI) Sequence Read Archive (SRA) and GenBank, European Medicines Agency (EMA) In Vitro Diagnostic Regulation (IVDR) filings, European Molecular Biology Laboratory (EMBL-EBI), Human Genome Organisation (HUGO), Association for Molecular Pathology (AMP), American College of Medical Genetics and Genomics (ACMG), European Society of Human Genetics (ESHG), Genomics England (100,000 Genomes Project), Broad Institute of MIT and Harvard, Wellcome Sanger Institute, World Health Organization (WHO) Genomic Surveillance Strategy, CDC Advanced Molecular Detection Program, and national genomic medicine initiatives from key markets (UK NHS Genomic Medicine Service, France Genomic Medicine Plan, Japan Initiative for Rare and Undiagnosed Diseases). These sources were used to collect sequencing adoption statistics, regulatory approval data for NGS-based IVDs, clinical utility studies, precision medicine implementation trends, and competitive landscape analysis for short-read sequencing, long-read sequencing, nanopore technology, and bioinformatics solutions.


Primary Research

Qualitative and quantitative insights were obtained by interviewing supply-side and demand-side stakeholders during the primary research process. The supply-side sources consisted of Chief Executive Officers, Chief Technology Officers, Vice Presidents of Platform Development, Heads of Clinical Affairs, and Commercial Directors from NGS platform manufacturers, sequencing reagent suppliers, and bioinformatics service providers. Laboratory Directors of clinical genomics laboratories, Hospital Pathology and Molecular Diagnostics Department Heads, Clinical Geneticists, Bioinformatics Officers, Research Principal Investigators from academic sequencing centers, and Procurement Leads from pharmaceutical companies that use NGS for precision medicine drug development were among the demand-side sources. The primary research validated technology adoption curves, confirmed product pipeline timelines for novel sequencing chemistries, and garnered insights on clinical reimbursement patterns, laboratory workflow integration, and competitive platform switching dynamics.

Primary Respondent Breakdown:

• By Designation: C-level Primaries (40%), Director Level (35%), Others (25%)

• By Region: North America (42%), Europe (30%), Asia-Pacific (22%), Rest of World (6%)


Market Size Estimation

Global market valuation was derived through revenue mapping and installed base analysis. The methodology included:

• Identification of 40+ key manufacturers across North America, Europe, Asia-Pacific, and Latin America covering sequencing platforms, consumables, and services

• Product mapping across short-read sequencing (SBS, ion semiconductor), long-read sequencing (SMRT, nanopore), library preparation automation, and bioinformatics/analysis solutions

• Analysis of reported and modeled annual revenues specific to NGS portfolios, including instrument placements, recurring consumables, and service contracts

• Coverage of manufacturers representing 75-80% of global market share in 2024

• Extrapolation using bottom-up (installed base × annual utilization rate × ASP by geography) and top-down (manufacturer revenue triangulation) approaches to derive segment-specific valuations for research, clinical diagnostics, and pharmaceutical applications

Share::
Request Free Sample
Download Free Sample

Kindly complete the form below to receive a free sample of this Report

* Please use a valid business email

Share::
Request Free Sample
Download PDF ×

We do not share your information with anyone. However, we may send you emails based on your report interest from time to time. You may contact us at any time to opt-out.
















