Nickel Cadmium Battery Market (2026 - 2035)

ID: MRFR/EnP/20714-HCR
128 Pages
Shubhendra Anand
Last Updated: June 29, 2026
Nickel Cadmium Battery Market Size, Share & Growth Analysis Report By Battery Type (Vented/Flooded, Sealed, Cylindrical, Prismatic, Sub-C and Specialty Formats), By Capacity Range (Above 10 Ah, 3 to 10 Ah, Below 3 Ah), By Application (Industrial, Military and Defense, Medical Devices, Power Tools and Engineering Equipment, Consumer Electronics) and By Regional (North America, Europe, South America, Asia Pacific, Middle East and Africa) – Industry Growth & Forecast to 2035
Nickel Cadmium Battery Market
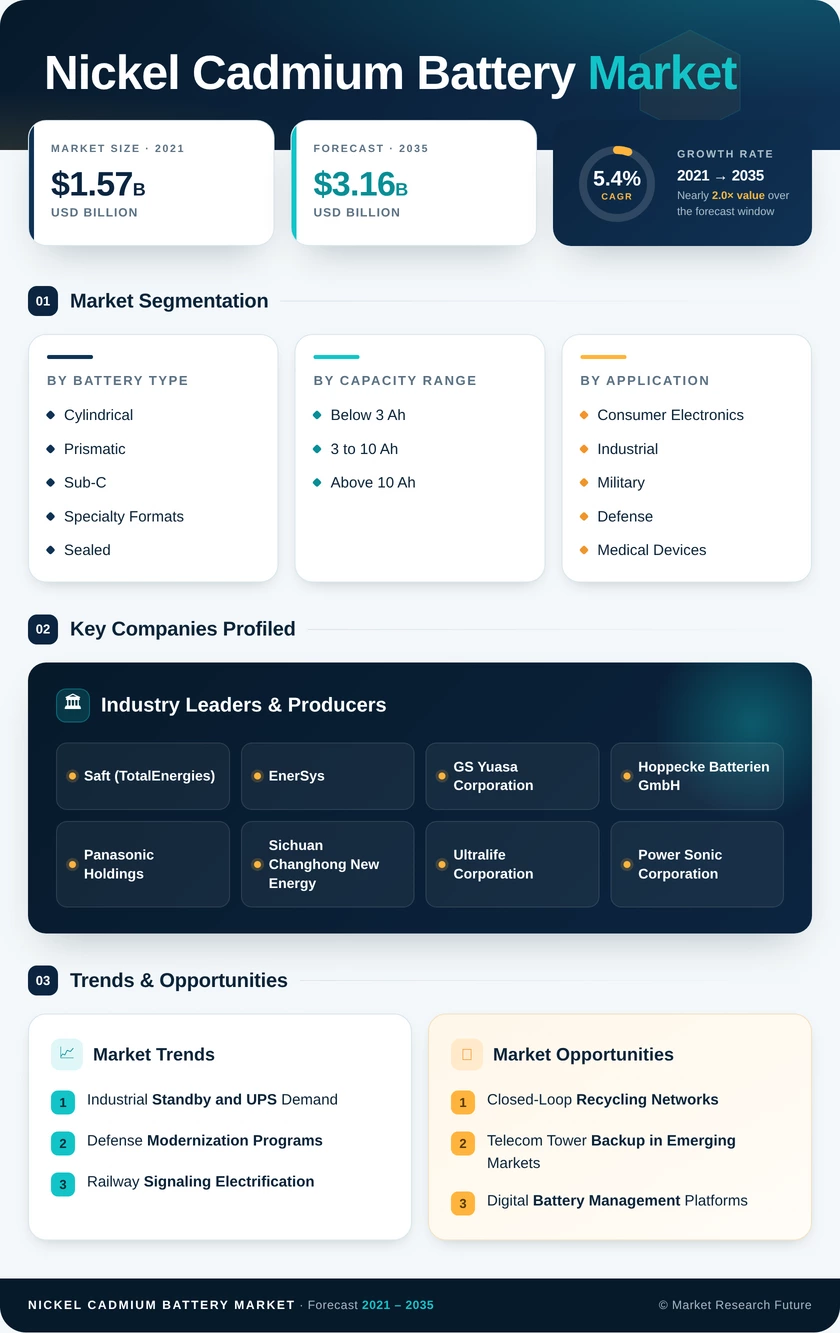
Market Size
Forecast Period2026-2035
CAGR (2026-2035)5.4%
2025 Market SizeUSD 1.87 Billion
2035 Market SizeUSD 3.16 Billion
Key Players
Saft
EnerSys
GS Yuasa Corporation
Hoppecke Batterien GmbH
Panasonic Holdings
Sichuan Changhong New Energy
Opportunities
  • Closed-Loop Recycling Networks
  • Telecom Tower Backup in Emerging Markets
  • Digital Battery Management Platforms
  1. 1 Market Overview |
    1. 1.1 Study Assumptions & Market Definition |
    2. 1.2 Scope of the Study |
    3. 1.3 Research Methodology
  2. 2 Market Summary & Key Takeaways
  3. 3 Market Dynamics |
    1. 3.1 Market Drivers Analysis | |
      1. 3.1.1 Industrial Standby and UPS Demand | |
      2. 3.1.2 Defense Modernization Programs | |
      3. 3.1.3 Railway Signaling Electrification | |
      4. 3.1.4 Aviation Battery Certification Cycles | |
      5. 3.1.5 Extreme-Temperature Application Growth | |
      6. 3.1.6 Recycling Infrastructure Investment | |
      7. 3.1.7 Telecom Tower Backup in Emerging Markets |
    2. 3.2 Market Restraints Analysis | |
      1. 3.2.1 Cadmium Toxicity and Environmental Regulation | |
      2. 3.2.2 Lithium-Ion Price Erosion | |
      3. 3.2.3 EU Battery Regulation Compliance Costs | |
      4. 3.2.4 Memory Effect Perception | |
      5. 3.2.5 Limited Consumer-Electronics Addressable Market |
    3. 3.3 Market Opportunity Analysis | |
      1. 3.3.1 Closed-Loop Recycling Networks | |
      2. 3.3.2 Telecom Tower Backup in Emerging Markets | |
      3. 3.3.3 Digital Battery Management Platforms | |
      4. 3.3.4 Aerospace Fleet Replacement Cycles | |
      5. 3.3.5 Military Electrification in Indo-Pacific |
    4. 3.4 Industry Value Chain Analysis |
    5. 3.5 Porter's Five Forces Analysis
  4. 4 Global Nickel Cadmium Battery Market Size & Forecast (2021–2035) |
    1. 4.1 Historical Market Size (2021–2025) |
    2. 4.2 Current & Forecast Market Size (2026–2035) |
    3. 4.3 Market Size by Revenue (USD Billion) |
    4. 4.4 Year-over-Year Growth Analysis
  5. 5 Segmentation Analysis |
    1. 5.1 By Battery Type | |
      1. 5.1.1 Cylindrical | |
      2. 5.1.2 Prismatic | |
      3. 5.1.3 Sub-C and Specialty Formats | |
      4. 5.1.4 Sealed | |
      5. 5.1.5 Vented/Flooded |
    2. 5.2 By Capacity Range | |
      1. 5.2.1 Below 3 Ah | |
      2. 5.2.2 3 to 10 Ah | |
      3. 5.2.3 Above 10 Ah |
    3. 5.3 By Application | |
      1. 5.3.1 Consumer Electronics | |
      2. 5.3.2 Industrial | |
      3. 5.3.3 Military and Defense | |
      4. 5.3.4 Medical Devices | |
      5. 5.3.5 Power Tools and Engineering Equipment
  6. 6 Regional Analysis |
    1. 6.1 North America | |
      1. 6.1.1 United States | |
      2. 6.1.2 Canada | |
      3. 6.1.3 Mexico |
    2. 6.2 Europe | |
      1. 6.2.1 Germany | |
      2. 6.2.2 United Kingdom | |
      3. 6.2.3 France | |
      4. 6.2.4 Italy | |
      5. 6.2.5 Spain | |
      6. 6.2.6 Nordic Countries | |
      7. 6.2.7 Russia | |
      8. 6.2.8 Rest of Europe |
    3. 6.3 Asia-Pacific | |
      1. 6.3.1 China | |
      2. 6.3.2 India | |
      3. 6.3.3 Japan | |
      4. 6.3.4 South Korea | |
      5. 6.3.5 ASEAN | |
      6. 6.3.6 Rest of Asia-Pacific |
    4. 6.4 South America | |
      1. 6.4.1 Brazil | |
      2. 6.4.2 Argentina | |
      3. 6.4.3 Rest of South America |
    5. 6.5 Middle East & Africa | |
      1. 6.5.1 Saudi Arabia | |
      2. 6.5.2 UAE | |
      3. 6.5.3 South Africa | |
      4. 6.5.4 Egypt | |
      5. 6.5.5 Rest of MEA
  7. 7 Competitive Landscape |
    1. 7.1 Market Share Analysis (2025) |
    2. 7.2 Competitive Benchmarking Matrix |
    3. 7.3 Company Profiles | |
      1. 7.3.1 Saft (TotalEnergies) | |
      2. 7.3.2 EnerSys | |
      3. 7.3.3 GS Yuasa Corporation | |
      4. 7.3.4 Hoppecke Batterien GmbH | |
      5. 7.3.5 Panasonic Holdings | |
      6. 7.3.6 Sichuan Changhong New Energy | |
      7. 7.3.7 BYD Company | |
      8. 7.3.8 Ultralife Corporation | |
      9. 7.3.9 Power Sonic Corporation | |
      10. 7.3.10 Highpower Technology
  8. 8 Future Outlook & Strategic Recommendations (2026–2035) |
    1. 8.1 Recycling-Driven Competitive Restructuring |
    2. 8.2 Digital Twin and Predictive Maintenance Integration |
    3. 8.3 Defense Electrification and Autonomous Systems |
    4. 8.4 ESG Reporting and Circular-Economy Narratives
  9. 9 Recent Developments & News
  10. 10 Frequently Asked Questions (FAQs)
  11. 11 Report Scope & Methodology |
    1. 11.1 Study Period & Base Year |
    2. 11.2 Data Sources & Citations |
    3. 11.3 Abbreviations
  12. 12 LIST OF TABLES |
  13. TABLE 1 Global Nickel Cadmium Battery Market Size & Forecast, by Revenue (USD Billion), 2021–2035 |
  14. TABLE 2 Global Nickel Cadmium Battery Market – Year-over-Year Growth Analysis, 2021–2035 |
  15. TABLE 3 Global Nickel Cadmium Battery Market – Driver Impact Analysis |
  16. TABLE 4 Global Nickel Cadmium Battery Market – Restraint Impact Analysis |
  17. TABLE 5 Global Nickel Cadmium Battery Market Size, by Battery Type, 2021–2035 (USD Billion) |
  18. TABLE 6 Global Nickel Cadmium Battery Market Size, by Capacity Range, 2021–2035 (USD Billion) |
  19. TABLE 7 Global Nickel Cadmium Battery Market Size, by Application, 2021–2035 (USD Billion) |
  20. TABLE 8 Global Nickel Cadmium Battery Market Size, by Region, 2021–2035 (USD Billion) |
  21. TABLE 9 Regional Summary – Key Metrics and Investment Themes |
  22. TABLE 10 North America Nickel Cadmium Battery Market Size, by Country, 2021–2035 (USD Billion) |
  23. TABLE 11 Europe Nickel Cadmium Battery Market Size, by Country, 2021–2035 (USD Billion) |
  24. TABLE 12 Asia-Pacific Nickel Cadmium Battery Market Size, by Country, 2021–2035 (USD Billion) |
  25. TABLE 13 South America Nickel Cadmium Battery Market Size, by Country, 2021–2035 (USD Billion) |
  26. TABLE 14 Middle East & Africa Nickel Cadmium Battery Market Size, by Country, 2021–2035 (USD Billion) |
  27. TABLE 15 Competitive Benchmarking Matrix – Global Nickel Cadmium Battery Market, 2025 |
  28. TABLE 16 Company Profiles – Key Players, Global Nickel Cadmium Battery Market |
  29. TABLE 17 Recent Developments & Strategic Announcements, 2023–2025 |
  30. TABLE 18 Report Scope and Methodology Summary |
  31. TABLE 19 Detailed Sources and Citations |
  32. TABLE 20 North America Nickel Cadmium Battery Market Size, by Battery Type, 2021–2035 (USD Billion) |
  33. TABLE 21 North America Nickel Cadmium Battery Market Size, by Capacity Range, 2021–2035 (USD Billion) |
  34. TABLE 22 North America Nickel Cadmium Battery Market Size, by Application, 2021–2035 (USD Billion) |
  35. TABLE 23 Europe Nickel Cadmium Battery Market Size, by Battery Type, 2021–2035 (USD Billion) |
  36. TABLE 24 Europe Nickel Cadmium Battery Market Size, by Capacity Range, 2021–2035 (USD Billion) |
  37. TABLE 25 Europe Nickel Cadmium Battery Market Size, by Application, 2021–2035 (USD Billion) |
  38. TABLE 26 Asia-Pacific Nickel Cadmium Battery Market Size, by Battery Type, 2021–2035 (USD Billion) |
  39. TABLE 27 Asia-Pacific Nickel Cadmium Battery Market Size, by Capacity Range, 2021–2035 (USD Billion) |
  40. TABLE 28 Asia-Pacific Nickel Cadmium Battery Market Size, by Application, 2021–2035 (USD Billion) |
  41. TABLE 29 South America Nickel Cadmium Battery Market Size, by Battery Type, 2021–2035 (USD Billion) |
  42. TABLE 30 South America Nickel Cadmium Battery Market Size, by Capacity Range, 2021–2035 (USD Billion) |
  43. TABLE 31 South America Nickel Cadmium Battery Market Size, by Application, 2021–2035 (USD Billion) |
  44. TABLE 32 Middle East & Africa Nickel Cadmium Battery Market Size, by Battery Type, 2021–2035 (USD Billion) |
  45. TABLE 33 Middle East & Africa Nickel Cadmium Battery Market Size, by Capacity Range, 2021–2035 (USD Billion) |
  46. TABLE 34 Middle East & Africa Nickel Cadmium Battery Market Size, by Application, 2021–2035 (USD Billion) |
  47. TABLE 35 United States Nickel Cadmium Battery Market Size, by Battery Type, 2021–2035 (USD Billion) |
  48. TABLE 36 United States Nickel Cadmium Battery Market Size, by Capacity Range, 2021–2035 (USD Billion) |
  49. TABLE 37 United States Nickel Cadmium Battery Market Size, by Application, 2021–2035 (USD Billion) |
  50. TABLE 38 China Nickel Cadmium Battery Market Size, by Battery Type, 2021–2035 (USD Billion) |
  51. TABLE 39 China Nickel Cadmium Battery Market Size, by Capacity Range, 2021–2035 (USD Billion) |
  52. TABLE 40 China Nickel Cadmium Battery Market Size, by Application, 2021–2035 (USD Billion) |
  53. TABLE 41 India Nickel Cadmium Battery Market Size, by Battery Type, 2021–2035 (USD Billion) |
  54. TABLE 42 India Nickel Cadmium Battery Market Size, by Capacity Range, 2021–2035 (USD Billion) |
  55. TABLE 43 India Nickel Cadmium Battery Market Size, by Application, 2021–2035 (USD Billion) |
  56. TABLE 44 Germany Nickel Cadmium Battery Market Size, by Battery Type, 2021–2035 (USD Billion) |
  57. TABLE 45 Germany Nickel Cadmium Battery Market Size, by Capacity Range, 2021–2035 (USD Billion) |
  58. TABLE 46 Germany Nickel Cadmium Battery Market Size, by Application, 2021–2035 (USD Billion) |
  59. TABLE 47 Japan Nickel Cadmium Battery Market Size, by Battery Type, 2021–2035 (USD Billion) |
  60. TABLE 48 Japan Nickel Cadmium Battery Market Size, by Capacity Range, 2021–2035 (USD Billion) |
  61. TABLE 49 Japan Nickel Cadmium Battery Market Size, by Application, 2021–2035 (USD Billion)
  62. 13 LIST OF FIGURES |
  63. FIGURE 1 Global Nickel Cadmium Battery Market Dynamics (Drivers, Restraints, Opportunities) |
  64. FIGURE 2 Industry Value Chain Analysis – Nickel Cadmium Battery Market |
  65. FIGURE 3 Porter's Five Forces Analysis – Nickel Cadmium Battery Market |
  66. FIGURE 4 Global Nickel Cadmium Battery Market Size Trend (USD Billion), 2021–2035 |
  67. FIGURE 5 Global Nickel Cadmium Battery Market Share, by Battery Type, 2024 (%) |
  68. FIGURE 6 Global Nickel Cadmium Battery Market Share, by Capacity Range, 2024 (%) |
  69. FIGURE 7 Global Nickel Cadmium Battery Market Share, by Application, 2024 (%) |
  70. FIGURE 8 Global Nickel Cadmium Battery Market Share, by Region, 2024 (%) |
  71. FIGURE 9 North America Nickel Cadmium Battery Market Size Trend (USD Billion), 2021–2035 |
  72. FIGURE 10 Europe Nickel Cadmium Battery Market Size Trend (USD Billion), 2021–2035 |
  73. FIGURE 11 Asia-Pacific Nickel Cadmium Battery Market Size Trend (USD Billion), 2021–2035 |
  74. FIGURE 12 South America Nickel Cadmium Battery Market Size Trend (USD Billion), 2021–2035 |
  75. FIGURE 13 Middle East & Africa Nickel Cadmium Battery Market Size Trend (USD Billion), 2021–2035 |
  76. FIGURE 14 Competitive Landscape – Revenue Share Distribution, 2025 (%) |
  77. FIGURE 15 Competitive Landscape – Strategic Group Mapping

Segmentation Quick Reference

DimensionSub-SegmentsDominant SegmentFastest Growing Segment
Battery TypeCylindrical, Prismatic, Sub-C and Specialty Formats, Sealed, Vented/FloodedVented/FloodedSub-C and Specialty Formats
Capacity RangeBelow 3 Ah, 3 to 10 Ah, Above 10 AhAbove 10 AhBelow 3 Ah
ApplicationConsumer Electronics, Industrial, Military and Defense, Nickel Cadmium Battery Markets, Power Tools and Engineering EquipmentIndustrialMilitary and Defense
GeographyNorth America, Europe, Asia-Pacific, South America, Middle East & AfricaAsia-PacificAsia-Pacific


Market Segmentation Overview

By Battery Type

Sub-SegmentKey Trend
CylindricalSteady replacement demand from legacy portable equipment and emergency lighting systems
PrismaticGrowing adoption of aviation battery packs and custom military configurations
Sub-C and Specialty FormatsFastest growth driven by compact medical devices and cordless instrumentation
SealedPreferred for maintenance-free applications in medical and consumer devices
Vented/FloodedDominant format in rail signaling, utility substations, and airport ground-power systems


Vented/flooded cells continue to anchor the largest share of global nickel-cadmium revenue. Their ability to withstand prolonged float charging and deep-discharge cycling across a wide temperature range makes them indispensable for infrastructure-grade backup power. Sub-C and specialty formats represent the fastest-growing segment as portable medical and instrumentation markets seek compact, high-reliability alternatives to lithium-ion.

By Capacity Range

Sub-SegmentKey Trend
Below 3 AhNiche demand from portable instruments, emergency lighting, and specialty electronics
3 to 10 AhMid-range cells serving defense portable systems, medical devices, and power tools
Above 10 AhDominant capacity class driven by industrial standby, rail, and aviation applications


Large-format cells above 10 Ah constitute the majority of market revenue, reflecting the structural concentration of demand in industrial standby and critical-infrastructure backup. Mid-range capacities serve a transitional role, bridging portable military equipment and medium-format industrial applications.

By Application

Sub-SegmentKey Trend
Consumer ElectronicsDeclining segment due to lithium-ion substitution in portable devices
IndustrialLargest application segment; driven by utility substations, rail, and data center UPS
Military and DefenseFastest growth, fueled by modernization programs and ruggedized platform procurement
Nickel Cadmium Battery MarketsStable demand from defibrillators, surgical instruments, and diagnostic equipment
Power Tools and Engineering EquipmentModerate demand from cordless tool platforms and field test equipment


Industrial applications dominate because nickel-cadmium's 20-year service life and deep-discharge tolerance remain unmatched for mission-critical backup power. Military and defense is the fastest-growing application segment, underpinned by multi-year government procurement contracts and stringent qualification standards that deter chemistry substitution.

By Geography

Sub-SegmentKey Trend
North AmericaDefense and aviation procurement anchor demand; FAA certification cycles sustain replacement revenue
EuropeRail signaling modernization and EU Battery Regulation compliance drive investment
Asia-PacificDominant region; Chinese manufacturing scale and Indian railway electrification fuel growth
South AmericaEmerging telecom and mining backup demand is concentrated in Brazil and Argentina.
Middle East & AfricaHigh-temperature applications in oil & gas and telecom towers create niche growth pockets.


Asia-Pacific leads on both volume and growth, combining China's manufacturing cost advantage with India's large-scale rail battery procurement pipeline. Europe's regulatory framework creates both compliance costs and competitive moats for established producers, while North America's defense spending trajectory ensures continued premium-segment demand.


 

Download PDF ×

We do not share your information with anyone. However, we may send you emails based on your report interest from time to time. You may contact us at any time to opt-out.