Non Emergency Medical Transportation Market (2026 - 2035)

Non-Emergency Medical Transportation Market Research Report By Service Type (Ambulatory Transportation, Wheelchair Transportation, Stretcher Transportation, Transport for Patients with Special Needs), By Mode of Transportation (Land Transportation, Air Transportation, Water Transportation), By End User (Healthcare Providers, Insurance Companies, Patients, Non-Profit Organizations), By Insurance Coverage (Medicare, Medicaid, Private Insurance, Self-Pay) and By Regional (North America, Europe, South America, Asia Pacific, Middle East and Africa) - Growth & Industry Forecast 2025 To 2035
ID: MRFR/MED/40515-HCR
100 Pages
Rahul Gotadki, Satyendra Maurya
Last Updated: July 12, 2026
Non Emergency Medical Transportation Market
Market Size
Forecast Period2026-2035
CAGR (2026-2035)7.55%
2025 Market SizeUSD 12.62 Billion
2035 Market SizeUSD 26.13 Billion
Key Players
ModivCare Solutions
MTM Inc.
Veyo
American Medical Response
Ride Health
Kaizen Health
Opportunities
  • Integrated Health-Transport Data Platforms
  • Behavioral-Health Ride Expansion
  • Emerging-Market Entry via Public-Private Partnerships

Non Emergency Medical Transportation Market Summary

The Non-Emergency Medical Transportation Market was valued at USD 12.62 billion in the base year 2025 and is projected to reach USD 13.57 billion in 2026 before climbing to USD 26.13 billion by 2035, registering a compound annual growth rate of 7.55% during the 2026–2035 forecast window. Two catalysts are doing the heavy lifting: the expansion of Medicaid managed-care contracts that now tie reimbursement to verified ride completion, and the U.S. Centers for Medicare & Medicaid Services' 2025 Final Rule mandating real-time ride-tracking for all managed-care plan transportation benefits [1]. Together, these policy shifts are converting a historically fragmented, paper-based sector into a data-driven logistics discipline.

Legacy call-center dispatch is giving way to cloud-based platforms that pair predictive routing with GPS-verified pickup and drop-off timestamps. The Federal Transit Administration's Low or No Emission Vehicle Program allocated USD 1.7 billion in fiscal-year 2025 grants, with a growing share directed toward paratransit and medical-ride operators replacing diesel fleets with battery-electric wheelchair-accessible vans [2]. This electrification wave is trimming per-trip fuel costs by an estimated 35–40% while helping providers comply with state-level zero-emission fleet mandates now active in California, New York, and Washington.

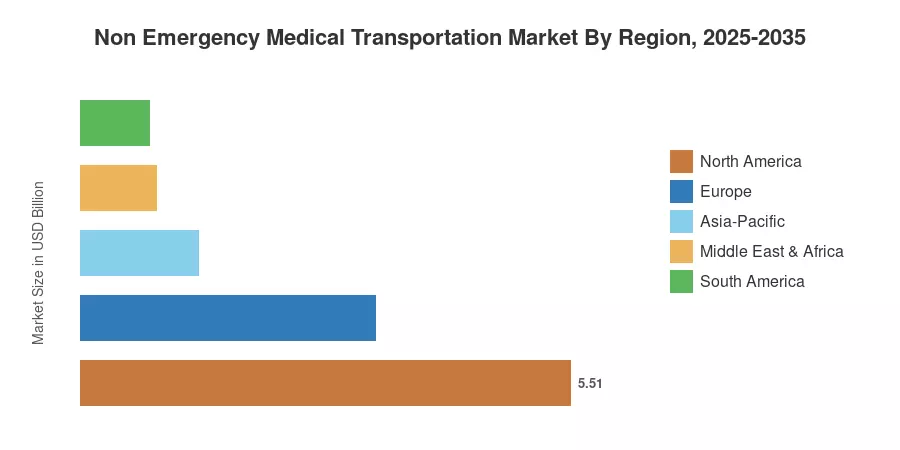
North America commands roughly 43.7% of the global Non-Emergency Medical Transportation Market revenue, driven by the sheer scale of Medicaid-funded rides—an estimated 104 million trips annually across the United States alone [3]. Asia-Pacific emerges as the fastest-growing region at a projected 10.52% CAGR through 2035, propelled by universal-health-coverage rollouts in India and Indonesia. Europe holds the second-largest share, anchored by the United Kingdom's NHS patient-transport contracts and Germany's statutory-health-insurance mandate. The next decade will increasingly reward operators that blend fleet electrification with AI-powered scheduling and value-based performance reporting.


Key Report Takeaways

• By Vehicle Type

  • Wheelchair-enabled vans captured 46.2% of the Non-Emergency Medical Transportation Market in 2025, underpinned by ADA compliance requirements and aging population demographics.
  • Hybrid and electric vans are forecast to expand at a 10.15% CAGR through 2035 as FTA electrification grants accelerate fleet turnover.

• By Payment Type & Application

  • Medicaid constituted 55.6% of the Non-Emergency Medical Transportation Market in 2025, reflecting state-level managed-care expansions across 42 U.S. states.
  • Mental-health transportation appointments record the highest application-level CAGR at 10.28% through 2035, driven by broadened behavioral-health coverage.
  • Dialysis transportation represented USD 3.95 billion in 2025, making it the single largest application segment.

• By Region

  • North America led the Non-Emergency Medical Transportation Market with 43.7% revenue share in 2025.
  • Asia-Pacific is poised to grow at a 10.52% CAGR, the fastest among all regions, through 2035.
  • Europe accounted for 26.3% of global revenue in 2025, anchored by NHS and statutory-insurance mandates.


Non-Emergency Medical Transportation Market Size and Forecast (2021–2035)

Market Research Future's proprietary sizing model integrates bottom-up provider-revenue aggregation with top-down payer-claims analysis across 38 countries. Historical figures (2021–2024) rely on audited financial disclosures, Medicaid Transportation Management reports, and fleet-census data, while forecast projections (2026–2035) incorporate regression-based demand modeling, demographic aging indices, and announced policy pipelines.
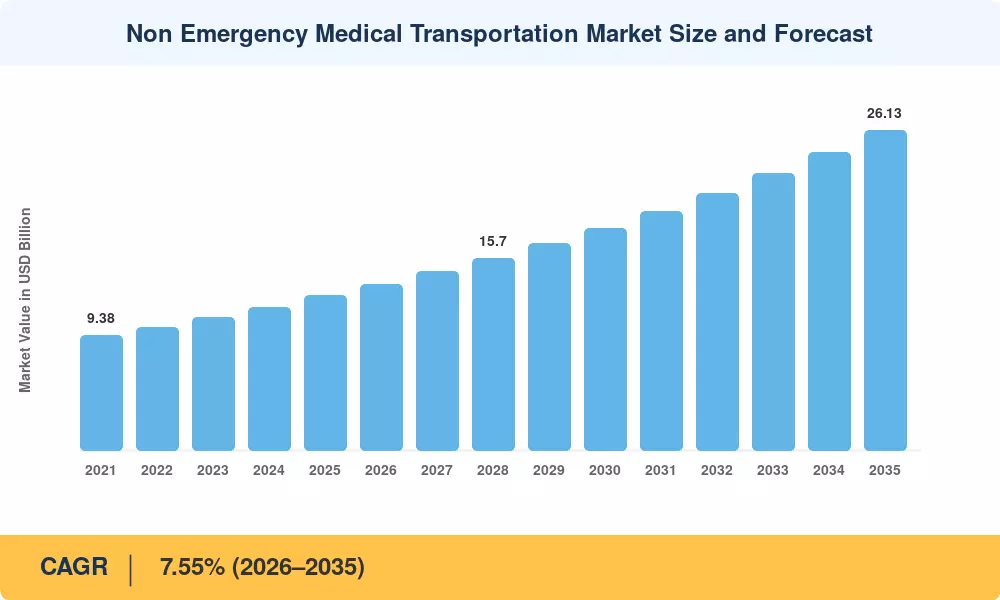
Non Emergency Medical Transportation Market Size and Forecast
Our Impact
Enabled $4.3B Revenue Impact for Fortune 500 and Leading Multinationals
Partnering with 2000+ Global Organizations Each Year
30K+ Citations by Top-Tier Firms in the Industry

Driver Impact Analysis

Driver ~% Impact on CAGR Geographic Relevance Impact Timeline
Medicaid managed-care expansion 22% North America Short-term (≤2 yr)
Fleet electrification grants 15% North America, Europe Medium-term (2–4 yr)
Value-based reimbursement mandates 18% North America Short-term (≤2 yr)
Behavioral-health coverage broadening 12% North America, Europe Medium-term (2–4 yr)
Universal-health-coverage rollouts 14% Asia-Pacific Long-term (≥4 yr)
AI-powered routing and scheduling 10% Global Medium-term (2–4 yr)
Aging population demographics 9% Global Long-term (≥4 yr)


Medicaid Managed-Care Expansion

Forty-two U.S. states now administer Medicaid benefits through managed-care organizations that are contractually required to guarantee transportation to covered appointments. CMS reported that Medicaid-enrolled beneficiaries utilized an estimated 104 million non-emergency rides in fiscal year 2024, a 12% increase over 2022 levels [3]. State requests for proposals increasingly mandate digital trip verification, pushing brokers toward platform-based dispatch and real-time GPS confirmation. This procurement shift channels volume toward technology-enabled operators and squeezes out smaller providers lacking digital infrastructure.

Fleet Electrification Grants

The FTA's Low or No Emission Vehicle Program distributed USD 1.7 billion in 2025, with paratransit and medical-ride fleets eligible for 85% federal cost-share on battery-electric van purchases [2]. Operators converting from diesel report a 37% reduction in per-mile fuel costs and a 28% drop in scheduled maintenance expenses within the first 18 months of deployment [15]. California's Advanced Clean Fleets regulation requires full zero-emission conversion of medical-transport fleets by 2035, setting a precedent that Oregon and Massachusetts have begun replicating.

Value-Based Reimbursement Mandates

Starting in plan year 2026, CMS will tie a portion of Medicaid managed-care capitation payments to transportation performance metrics—specifically on-time pickup rates above 92%, member-satisfaction scores, and documentation completeness [7]. Early-adopter states such as Tennessee and Virginia reported 18% reductions in missed medical appointments after pilot performance-payment programs launched in 2024. The financial stakes are meaningful: brokers that fall below performance thresholds face capitation clawbacks of up to 3% of monthly payments.

Universal Health Coverage in Asia-Pacific

India's Ayushman Bharat program, covering 500 million beneficiaries, began integrating transportation entitlements for tertiary-care referrals in 2024 [11]. Indonesia's JKN national health-insurance scheme is piloting subsidized ride vouchers in rural Java and Sulawesi. These programs are creating a Non-Emergency Medical Transportation Market where none existed at scale, attracting both domestic fleet operators and international technology-platform providers seeking first-mover positioning.


Restraints Impact Analysis

The restraint impact percentages below are directional estimates of negative pressure on the aggregate growth trajectory. Individual restraints may overlap or partially offset market drivers.

Restraint ~% Negative Impact on CAGR Geographic Relevance Impact Timeline
Driver shortage and labor costs –18% North America, Europe Short-term (≤2 yr)
Fragmented state/provincial regulation –14% North America Medium-term (2–4 yr)
Reimbursement rate compression –12% North America Short-term (≤2 yr)
Rural last-mile coverage gaps –10% Global Long-term (≥4 yr)
Cybersecurity and HIPAA compliance costs –8% North America Medium-term (2–4 yr)


Driver Shortage and Rising Labor Costs

The American Public Transportation Association forecasts that as of mid-2024, the vacancy rate for paratransit and medical-ride drivers is 15%, with average hourly pay up 22% since 2021 [18]. Operators in metro markets are competing directly with ride-hailing platforms for the same pool of commercial-licensed drivers, producing wage-floor pressure that squeezes already-thin operating margins. In certain jurisdictions, turnover is over 60% each year, so they are always spending money on recruitment and training.


Fragmented Regulatory Landscape

Medical transport licensing, vehicle inspection and driver credentialing are determined by each U.S. state. A broker operating in 30 states has to comply with 30 different compliance standards, increasing administrative overhead by an estimated 6–9% of revenue [19]. The National Association of Insurance Commissioners has tried to harmonize, but that effort is frozen, and no federal preemption legislation is moving.


Reimbursement Rate Compression

In several big states, Medicaid per-trip reimbursement rates have failed to keep pace with inflation. For example, Texas has maintained its base rate unchanged since 2021 despite gasoline and insurance prices rising 31% during the same period [20]. Rate freezes hinder new entrants into the market and encourage existing operators to consolidate geographically in higher-reimbursement jurisdictions, leaving underserved communities with fewer choices of providers.


Non Emergency Medical Transportation Market Opportunities

Integrated Health-Transport Data Platforms

Payers want to see closed-loop data that connects the completion of a ride to clinical results – fewer no-shows, better HbA1c compliance for dialysis patients, and less emergency-department utilization. Operators that develop analytics dashboards that integrate transportation data with health-plan quality criteria might charge premium per-member-per-month fees, turning commoditized rides into value-added health services.


Behavioral-Health Ride Expansion

Mental-health and substance-use-disorder visits represent the fastest-growing application within the Non-Emergency Medical Transportation Market, yet only 28 states currently mandate parity between physical-health and behavioral-health transportation benefits [10]. As parity legislation advances in remaining states, the addressable ride volume could expand by an estimated 18–22 million annual trips by 2030.

Emerging-Market Entry via Public-Private Partnerships

Governments in India, Indonesia, and Brazil are piloting public-private partnerships to provide subsidized patient rides to rural clinics. The World Bank's Health Service Delivery initiative allocated USD 340 million in 2024 for transport-access interventions in low- and middle-income countries [21]. Technology-platform providers can enter these markets with asset-light models, aggregating local taxi and auto-rickshaw operators under a managed digital dispatch layer.

Autonomous and Semi-Autonomous Shuttle Corridors

Autonomous-vehicle developers are targeting fixed-route medical-shuttle corridors—hospital campuses, dialysis-center clusters, and senior-living complexes—as early commercialization zones. Waymo and May Mobility have both disclosed pilot agreements with health systems for campus-to-clinic autonomous rides [13]. Regulatory sandboxes in Arizona, Texas, and Singapore could unlock recurring NEMT revenue streams by 2030.

Fleet-as-a-Service and Data Monetization

Brokers sitting on large ride-completion datasets can monetize anonymized mobility patterns for urban-planning agencies and pharmaceutical-trial recruiters. A fleet-as-a-service subscription model—where health plans pay a fixed monthly fee per enrolled member rather than per ride—smooths revenue volatility and incentivizes preventive ride scheduling.


Non Emergency Medical Transportation Market Future Outlook

AI-Powered Scheduling and Predictive Demand

Machine-learning algorithms are moving beyond simple route optimization into predictive demand modeling—forecasting ride volumes 72 hours ahead based on appointment schedules, weather patterns, and historical no-show rates. estimates that AI-driven scheduling can reduce dead-head miles by 25–30% and improve vehicle utilization rates from 55% to over 72% [8]. By 2030, the Non-Emergency Medical Transportation Market will increasingly reward operators embedding predictive analytics into their dispatch platforms.

Platform Economics and Broker Consolidation

The brokerage layer is consolidating rapidly. Three firms now manage over 60% of U.S. Medicaid transportation volume, and this concentration is accelerating as payers demand national network reach and unified reporting dashboards. The platform-economics playbook—aggregate demand, standardize operations, extract data insights—mirrors the trajectory of ride-hailing but with healthcare-grade compliance overlays. By 2032, two to three super-brokers are likely to control the majority of insured rides globally.

Electrification Supercycle

Battery-electric wheelchair-accessible vans are expected to reach total-cost-of-ownership parity with internal-combustion equivalents by 2029, based on DOE projections of battery-pack costs falling below USD 80 per kilowatt-hour [15]. Once parity is achieved, fleet conversion will accelerate from policy-driven early adopters to economics-driven mass adoption. The Non-Emergency Medical Transportation Market stands to benefit from lower operating costs and improved environmental, social, and governance reporting profiles demanded by health-plan procurement teams.

Autonomous Vehicle Integration

Fixed-route autonomous shuttles operating on hospital campuses and dialysis-center corridors represent the lowest-risk entry point for self-driving technology in medical transport. May Mobility's partnership with Via Transportation to deploy autonomous wheelchair-accessible shuttles in Grand Rapids, Michigan, provides a real-world proof of concept [13]. Regulatory clarity from NHTSA on Level 4 autonomous medical-transport vehicles, expected by 2028, could unlock broader deployment across the Non-Emergency Medical Transportation Market.


Non Emergency Medical Transportation Market Segmentation

By Vehicle Type

Segment Key Metric Primary Demand Driver
Wheelchair-Enabled Vans 46.2% share (2025) ADA compliance and aging demographics
Ambulatory Vans USD 4.28 Billion (2025) High-volume Medicaid trip routing
Stretcher Vans 6.90% CAGR (2026–2035) Post-surgical discharge transport
Sedans and Rideshare USD 1.45 Billion (2025) Ambulatory low-acuity trips
Hybrid and Electric Vans 10.15% CAGR (2026–2035) FTA grants and zero-emission mandates


Wheelchair-enabled vans remain the backbone of the Non-Emergency Medical Transportation Market, reflecting ADA-mandated accessibility requirements and the growing population of mobility-impaired elderly beneficiaries. Fleet operators report that wheelchair vans generate higher per-trip reimbursement rates—typically 2.3 times the sedan rate—but also carry elevated maintenance and insurance costs. Hybrid and electric vans are the fastest-growing vehicle category as operators tap FTA electrification grants and respond to state-level zero-emission fleet mandates; early adopters in California and New York have documented fuel-cost savings exceeding 35% within the first year of deployment.

By Payment Type

Segment Key Metric Primary Demand Driver
Medicaid 55.6% share (2025) Managed-care NEMT mandates in 42 states
Medicare USD 2.78 Billion (2025) Medicare Advantage supplemental benefits
Managed Care Organizations 10.38% CAGR (2026–2035) Value-based care ride verification
Private Insurance 6.15% CAGR (2026–2035) Employer-sponsored health plan ride benefits
Out-of-Pocket USD 0.72 Billion (2025) Uninsured and underinsured populations


Medicaid dominates the Non-Emergency Medical Transportation Market payment mix because federal law requires state Medicaid programs to ensure beneficiary access to medical appointments. Managed-care organizations are the fastest-growing payment channel as states shift Medicaid administration from fee-for-service to capitated managed-care contracts that bundle transportation as a covered benefit.

By Application

Segment Key Metric Primary Demand Driver
Dialysis Transportation 31.3% share (2025) Three-times-weekly recurring ride schedules
Routine Doctor Visits USD 2.85 Billion (2025) Primary-care access and preventive visits
Mental Health Appointments 10.28% CAGR (2026–2035) Behavioral-health parity legislation
Chemotherapy and Radiation USD 1.08 Billion (2025) Oncology treatment-adherence programs
Physical Therapy 7.42% CAGR (2026–2035) Post-acute discharge ride coordination


Dialysis transportation generates the highest share of the Non-Emergency Medical Transportation Market because patients require recurring rides three times per week, creating predictable, high-frequency demand that lends itself to fixed-route scheduling. Mental-health appointments are growing fastest as states enact parity legislation extending transportation coverage to behavioral-health and substance-use-disorder visits.

By End User

Segment Key Metric Primary Demand Driver
Hospitals 40.3% share (2025) Discharge-transport coordination mandates
Nursing Care Centers USD 2.15 Billion (2025) Resident specialist-visit transport
Home-Healthcare Settings 10.35% CAGR (2026–2035) Shift from institutional to home-based care
Community Health Centers 7.88% CAGR (2026–2035) FQHC patient-access requirements
Rehabilitation Facilities USD 0.75 Billion (2025) Post-acute therapy ride scheduling


Hospitals hold the largest end-user share of the Non-Emergency Medical Transportation Market, as discharge planners increasingly coordinate rides to reduce 30-day readmission rates tied to CMS penalty programs. Home-healthcare settings represent the fastest-growing end-user category as payers incentivize care delivery in the home, creating new ride-demand patterns for visiting-nurse and telehealth-follow-up appointments.


Regional Market Share Analysis

Region Key Metric Primary Investment Themes
North America 43.7% share (2025) Medicaid expansion, fleet electrification, value-based contracts
Europe USD 3.32 Billion (2025) NHS patient transport, statutory insurance mandates, EV adoption
Asia-Pacific 10.52% CAGR (2026–2035) UHC rollouts, digital-platform entry, rural access programs
South America USD 0.78 Billion (2025) SUS transport mandates, ride-hailing integration
Middle East & Africa 6.85% CAGR (2026–2035) Vision 2030 healthcare investment, insurance reforms
Total USD 12.62 Billion (2025)

The Non-Emergency Medical Transportation Market follows a regionally distinct growth pattern shaped by payer structures, regulatory environments, and population-density profiles. North America dominates by revenue, while Asia-Pacific delivers the steepest growth trajectory.


North America

Country Key Metric Key Driver
United States 82.4% of regional share Medicaid managed-care mandates in 42 states [1]
Canada 7.18% CAGR (2026–2035) Provincial health-authority transport contracts
Mexico USD 0.18 Billion (2025) IMSS patient-transfer modernization program


The United States accounts for the vast majority of North American demand, driven by the sheer volume of Medicaid-funded trips and Medicare Advantage supplemental transportation benefits. Canada's single-payer provinces are centralizing non-emergency rides under health-authority procurement, while Mexico's IMSS system is digitizing patient-transfer coordination across its 1,500-plus clinics.

Europe

Country Key Metric Key Driver
Germany 28.5% of regional share Statutory health-insurance transport mandates
United Kingdom USD 0.82 Billion (2025) NHS England patient-transport contracts
France 7.25% CAGR (2026–2035) VSL and ambulance-léger reimbursement reforms
Italy USD 0.29 Billion (2025) SSN regional procurement modernization
Spain 6.80% CAGR (2026–2035) Autonomous-community health-system integration
Nordic Countries USD 0.22 Billion (2025) Centralized county-level patient transport
Russia 5.95% CAGR (2026–2035) Federal MHI modernization pilots
Rest of Europe USD 0.38 Billion (2025) EU cross-border patient mobility directive


Germany and the UK together command over half of Europe's Non-Emergency Medical Transportation Market revenue. Germany's statutory health-insurance system reimburses medically prescribed rides at standardized per-kilometer rates, while NHS England contracts patient-transport services through competitive regional tenders that increasingly require real-time GPS tracking and carbon-footprint reporting.

Asia-Pacific

Country Key Metric Key Driver
China 32.6% of regional share Provincial healthcare-access subsidies
India 12.15% CAGR (2026–2035) Ayushman Bharat transport integration [11]
Japan USD 0.38 Billion (2025) LTCI patient-transfer coverage
South Korea 9.85% CAGR (2026–2035) NHIS chronic-disease ride pilot
ASEAN USD 0.19 Billion (2025) JKN and PhilHealth ride voucher pilots
Rest of Asia-Pacific 8.72% CAGR (2026–2035) Public-private partnership expansion


Asia-Pacific represents the frontier growth opportunity for the Non-Emergency Medical Transportation Market. China's provincial governments are disbursing healthcare-access subsidies that include patient-ride reimbursement for rural tertiary referrals, while India's Ayushman Bharat program is creating an entirely new demand category for organized medical rides serving half a billion beneficiaries.

South America

Country Key Metric Key Driver
Brazil 64.8% of regional share SUS patient-transport mandates
Argentina 7.10% CAGR (2026–2035) PAMI elderly-transport program
Rest of South America USD 0.11 Billion (2025) Insurance-sector modernization


Brazil's SUS public health system mandates patient transport for dialysis and chemotherapy in remote municipalities, creating a concentrated demand pocket that regional fleet operators serve under municipal contracts. Argentina's PAMI social-insurance program for retirees is expanding subsidized ride benefits to specialist appointments.

Middle East & Africa

Country Key Metric Key Driver
Saudi Arabia 34.2% of regional share Vision 2030 hospital-campus shuttle networks
UAE USD 0.12 Billion (2025) DHA and HAAD patient-transport licensing
South Africa 7.35% CAGR (2026–2035) NHI Bill patient-access mandates
Egypt USD 0.06 Billion (2025) Universal health-insurance pilot provinces
Rest of MEA 6.20% CAGR (2026–2035) Development-finance healthcare-access grants


Saudi Arabia's Vision 2030 healthcare expansion is constructing hospital campuses that include integrated shuttle networks, while South Africa's pending National Health Insurance Bill includes patient-transport access provisions that could catalyze formal market creation across the country's nine provinces.


Non Emergency Medical Transportation Market By Region, 2025-2035

Competitive Benchmarking

The Non-Emergency Medical Transportation Market exhibits high concentration at the brokerage layer, with an estimated top-five-firm share of 58–64% in the United States. The Herfindahl-Hirschman Index for the U.S. broker segment is estimated between 1,400 and 1,700, indicating moderate-to-high concentration. Below the broker tier, the provider landscape remains fragmented, with thousands of regional fleet operators competing on geography-specific contracts.

Company Est. Revenue Share Range Key Offerings Strategic Positioning
ModivCare Solutions ~14–18% Brokerage, fleet operations, analytics Largest integrated broker-operator in the U.S.
MTM Inc. ~10–14% Managed transportation, compliance reporting Technology-forward broker serving 32 states
Veyo ~7–10% Platform-based ride management Tech-first subsidiary leveraging rideshare networks
American Medical Response ~5–8% Fleet operations, stretcher transport National ambulance parent with NEMT division
Ride Health ~3–5% SaaS ride-coordination platform Health-system-facing integration specialist
Kaizen Health ~3–5% Digital ride management, social determinants SDOH-focused platform provider
National MedTrans Network ~3–5% Brokerage, Medicaid ride management Northeast U.S. regional broker
Roundtrip Health ~2–4% EHR-integrated ride scheduling Hospital-discharge ride-coordination platform
CTS Software (TripMaster) ~2–3% Fleet-management and scheduling software Technology vendor to mid-size fleet operators
Kinetik ~2–3% Digital NEMT marketplace Marketplace model connecting payers and providers


Recent News & Developments

  • Modivcare Inc. Launches First-of-its-Kind Integration Hub, a Digital Platform That Transforms Engagement and Experience for Medicaid and Medicare Members with NEMT Benefits (May 2024) Modivcare’s Integration Hub is an industry-first offering an expandable modular mobility platform that exposes open Application Programming Interfaces (API) to its commercial health plan clients, state Medicaid agencies and institution partners.


  • MTM, the nation’s biggest privately held NEMT broker, announced a deal to purchase Access2Care, LLC from Global Medical Response (August 2024). This strategic purchase added significantly to MTM’s market footprint and contributed to the company’s total yearly revenue, marking a milestone in the company’s growth journey. The purchase of Access2Care’s NEMT business is a product of careful study and coincides with MTM’s strategic growth initiatives.”


  • Ride Health (November 2024): Closed a USD 28 million Series B funding round led by health-system strategic investors, earmarking proceeds for EHR integration and discharge-to-ride workflow automation [24].


Non Emergency Medical Transportation Market Report Scope

Parameter Detail
Market Scope Global Non-Emergency Medical Transportation Market across 38 countries
Study Period 2021–2035
CAGR (Forecast Period) 7.55% (2026–2035)
Base Year Value USD 12.62 Billion (2025)
Forecast Endpoint Value USD 26.13 Billion (2035)
Fastest Growing Segment Hybrid and Electric Vans (Vehicle Type); Mental Health Appointments (Application)
Companies Profiled 10 (see Section 10)
Valuation Currency USD Billion


FAQs

How do performance-based penalties affect broker profit margins in this sector?
Brokers facing capitation clawbacks of 2–3% for missing on-time thresholds must invest in real-time tracking infrastructure, compressing net margins to 4–6% [7]. Smaller brokers lacking capital for technology upgrades face disproportionate margin erosion.
What fleet size threshold makes EV conversion economically viable for operators?
Operators running 50 or more vehicles typically reach EV payback within 30 months due to per-mile fuel savings of 37% and maintenance reductions of 28% [15]. Below that threshold, charging-infrastructure costs dilute the savings.
How do ride-hailing integrations differ from dedicated fleet models in the Non-Emergency Medical Transportation Market?
Ride-hailing supplements handle ambulatory surge demand at lower fixed cost, while dedicated fleets serve wheelchair and stretcher trips requiring specialized vehicles [23]. Most brokers blend both to balance cost flexibility with acuity coverage.
What credentialing standards apply to drivers serving the Non-Emergency Medical Transportation Market?
Drivers typically need a commercial license, clean background check, CPR certification, and HIPAA-privacy training, though exact requirements vary by state [19]. Some states add defensive-driving and passenger-assistance coursework.
How does the Non-Emergency Medical Transportation Market address rural coverage gaps?
Rural operators often rely on volunteer-driver networks and mileage-reimbursement programs supplemented by telehealth ride-reduction strategies [21]. Several states offer enhanced per-trip rates for rides exceeding 30 miles to attract providers into underserved areas.
What role do social-determinants-of-health screenings play in ride booking?
Platforms embedding SDOH screening at booking capture food-insecurity and housing data that health plans use to coordinate wraparound services [25]. This integration positions transportation as a health-equity intervention rather than a logistical cost center.
How does consolidation among brokers affect independent fleet operators in the Non-Emergency Medical Transportation Market?
Independent operators typically become subcontractors within super-broker networks, gaining volume but ceding pricing power and brand visibility [12]. Retaining direct payer contracts requires technology parity that few small operators can independently finance.    
Author
Author
Author Profile
Rahul Gotadki LinkedIn
Research Manager
He holds an experience of about 9+ years in Market Research and Business Consulting, working under the spectrum of Life Sciences and Healthcare domains. Rahul conceptualizes and implements a scalable business strategy and provides strategic leadership to the clients. His expertise lies in market estimation, competitive intelligence, pipeline analysis, customer assessment, etc.
Co-Author
Co-Author Profile
Satyendra Maurya LinkedIn
Research Analyst
An accomplished research analyst with high proficiency in market forecasting, data visualization, competitive benchmarking, and others. He holds a pronounced track record in research and consulting projects for sectors such as life sciences, medical devices, and healthcare IT. His capabilities in qualitative and quantitative analysis have resulted in positive client outcomes. Working on niche market trends, opportunities, sales, and forecasted value is part of his skill set.
Download Free Sample

Kindly complete the form below to receive a free sample of this Report

Download PDF ×

We do not share your information with anyone. However, we may send you emails based on your report interest from time to time. You may contact us at any time to opt-out.
















