Non Emergency Medical Transportation Market (2026 - 2035)

ID: MRFR/MED/40515-HCR
100 Pages
Rahul Gotadki
Last Updated: July 12, 2026
Non-Emergency Medical Transportation Market Research Report By Service Type (Ambulatory Transportation, Wheelchair Transportation, Stretcher Transportation, Transport for Patients with Special Needs), By Mode of Transportation (Land Transportation, Air Transportation, Water Transportation), By End User (Healthcare Providers, Insurance Companies, Patients, Non-Profit Organizations), By Insurance Coverage (Medicare, Medicaid, Private Insurance, Self-Pay) and By Regional (North America, Europe, South America, Asia Pacific, Middle East and Africa) - Growth & Industry Forecast 2025 To 2035
Non Emergency Medical Transportation Market
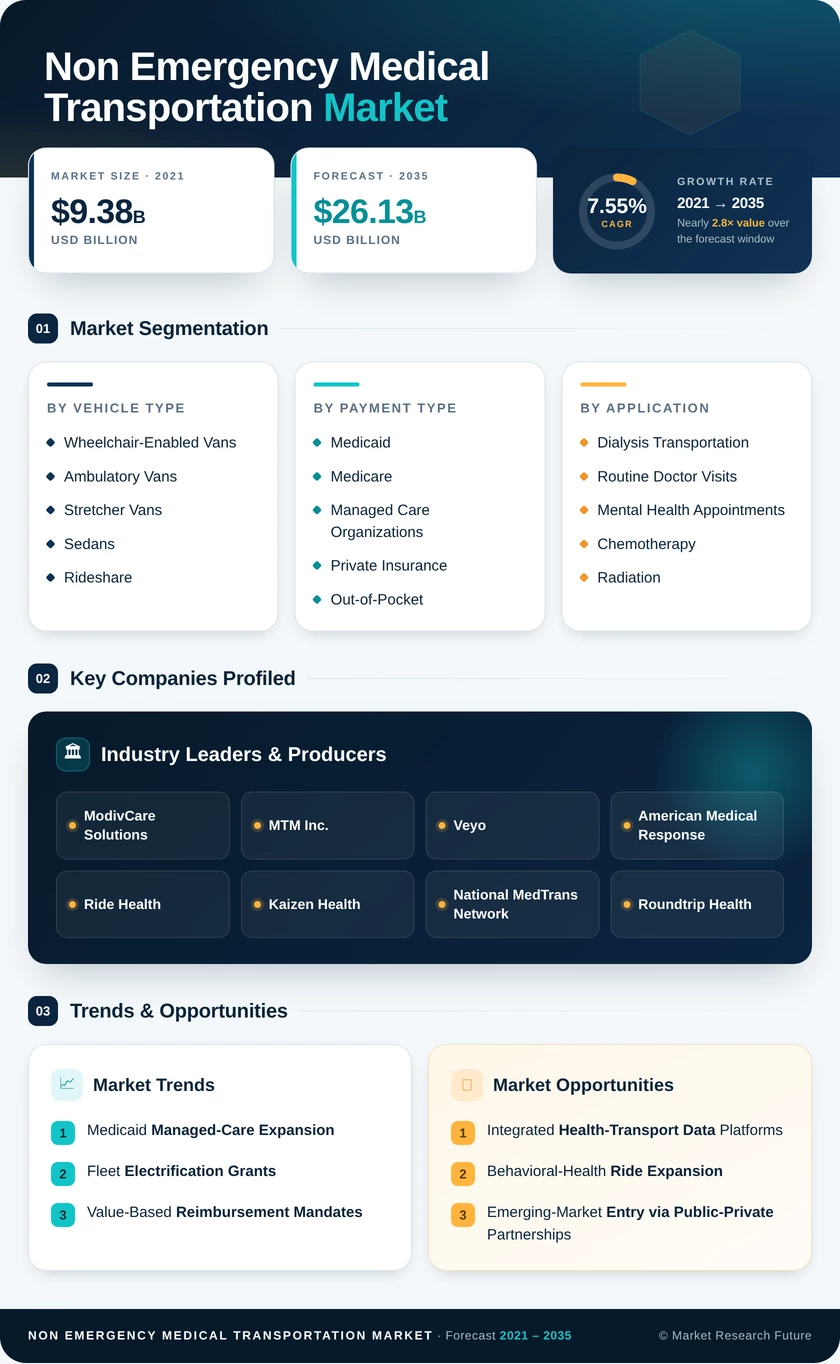
Market Size
Forecast Period2026-2035
CAGR (2026-2035)7.55%
2025 Market SizeUSD 12.62 Billion
2035 Market SizeUSD 26.13 Billion
Key Players
ModivCare Solutions
MTM Inc.
Veyo
American Medical Response
Ride Health
Kaizen Health
Opportunities
  • Integrated Health-Transport Data Platforms
  • Behavioral-Health Ride Expansion
  • Emerging-Market Entry via Public-Private Partnerships
  1. 1 Market Overview |
    1. 1.1 Study Assumptions & Market Definition |
    2. 1.2 Scope of the Study |
    3. 1.3 Research Methodology
  2. 2 Market Summary & Key Takeaways
  3. 3 Market Dynamics |
    1. 3.1 Market Drivers Analysis | |
      1. 3.1.1 Medicaid Managed-Care Expansion | |
      2. 3.1.2 Fleet Electrification Grants | |
      3. 3.1.3 Value-Based Reimbursement Mandates | |
      4. 3.1.4 Universal Health Coverage in Asia-Pacific | |
      5. 3.1.5 AI-Powered Routing and Scheduling | |
      6. 3.1.6 Aging Population Demographics | |
      7. 3.1.7 Behavioral-Health Coverage Broadening |
    2. 3.2 Market Restraints Analysis | |
      1. 3.2.1 Driver Shortage and Rising Labor Costs | |
      2. 3.2.2 Fragmented State/Provincial Regulation | |
      3. 3.2.3 Reimbursement Rate Compression | |
      4. 3.2.4 Rural Last-Mile Coverage Gaps | |
      5. 3.2.5 Cybersecurity and HIPAA Compliance Costs |
    3. 3.3 Market Opportunity Analysis | |
      1. 3.3.1 Integrated Health-Transport Data Platforms | |
      2. 3.3.2 Behavioral-Health Ride Expansion | |
      3. 3.3.3 Emerging-Market Entry via Public-Private Partnerships | |
      4. 3.3.4 Autonomous and Semi-Autonomous Shuttle Corridors | |
      5. 3.3.5 Fleet-as-a-Service and Data Monetization |
    4. 3.4 Industry Value Chain Analysis |
    5. 3.5 Porter's Five Forces Analysis
  4. 4 Global Non-Emergency Medical Transportation Market Size & Forecast (2021–2035) |
    1. 4.1 Historical Market Size (2021–2025) |
    2. 4.2 Current & Forecast Market Size (2026–2035) |
    3. 4.3 Market Size by Revenue (USD Billion) |
    4. 4.4 Year-over-Year Growth Analysis
  5. 5 Segmentation Analysis |
    1. 5.1 By Vehicle Type | |
      1. 5.1.1 Wheelchair-Enabled Vans | |
      2. 5.1.2 Ambulatory Vans | |
      3. 5.1.3 Stretcher Vans | |
      4. 5.1.4 Sedans and Rideshare | |
      5. 5.1.5 Hybrid and Electric Vans |
    2. 5.2 By Payment Type | |
      1. 5.2.1 Medicaid | |
      2. 5.2.2 Medicare | |
      3. 5.2.3 Managed Care Organizations | |
      4. 5.2.4 Private Insurance | |
      5. 5.2.5 Out-of-Pocket |
    3. 5.3 By Application | |
      1. 5.3.1 Dialysis Transportation | |
      2. 5.3.2 Routine Doctor Visits | |
      3. 5.3.3 Mental Health Appointments | |
      4. 5.3.4 Chemotherapy and Radiation | |
      5. 5.3.5 Physical Therapy |
    4. 5.4 By End User | |
      1. 5.4.1 Hospitals | |
      2. 5.4.2 Nursing Care Centers | |
      3. 5.4.3 Home-Healthcare Settings | |
      4. 5.4.4 Community Health Centers | |
      5. 5.4.5 Rehabilitation Facilities
  6. 6 Regional Analysis |
    1. 6.1 North America | |
      1. 6.1.1 United States | |
      2. 6.1.2 Canada | |
      3. 6.1.3 Mexico |
    2. 6.2 Europe | |
      1. 6.2.1 Germany | |
      2. 6.2.2 United Kingdom | |
      3. 6.2.3 France | |
      4. 6.2.4 Italy | |
      5. 6.2.5 Spain | |
      6. 6.2.6 Nordic Countries | |
      7. 6.2.7 Russia | |
      8. 6.2.8 Rest of Europe |
    3. 6.3 Asia-Pacific | |
      1. 6.3.1 China | |
      2. 6.3.2 India | |
      3. 6.3.3 Japan | |
      4. 6.3.4 South Korea | |
      5. 6.3.5 ASEAN | |
      6. 6.3.6 Rest of Asia-Pacific |
    4. 6.4 South America | |
      1. 6.4.1 Brazil | |
      2. 6.4.2 Argentina | |
      3. 6.4.3 Rest of South America |
    5. 6.5 Middle East & Africa | |
      1. 6.5.1 Saudi Arabia | |
      2. 6.5.2 UAE | |
      3. 6.5.3 South Africa | |
      4. 6.5.4 Egypt | |
      5. 6.5.5 Rest of MEA
  7. 7 Competitive Landscape |
    1. 7.1 Market Share Analysis (2025) |
    2. 7.2 Competitive Benchmarking Matrix |
    3. 7.3 Company Profiles | |
      1. 7.3.1 ModivCare Solutions | |
      2. 7.3.2 MTM Inc. | |
      3. 7.3.3 Veyo | |
      4. 7.3.4 American Medical Response | |
      5. 7.3.5 Ride Health | |
      6. 7.3.6 Kaizen Health | |
      7. 7.3.7 National MedTrans Network | |
      8. 7.3.8 Roundtrip Health | |
      9. 7.3.9 CTS Software (TripMaster) | |
      10. 7.3.10 Kinetik
  8. 8 Future Outlook & Strategic Recommendations (2026–2035) |
    1. 8.1 AI-Powered Scheduling and Predictive Demand |
    2. 8.2 Platform Economics and Broker Consolidation |
    3. 8.3 Electrification Supercycle |
    4. 8.4 Autonomous Vehicle Integration
  9. 9 Recent Developments & News
  10. 10 Frequently Asked Questions (FAQs)
  11. 11 Report Scope & Methodology |
    1. 11.1 Study Period & Base Year |
    2. 11.2 Data Sources & Citations |
    3. 11.3 Abbreviations
  12. 12 LIST OF TABLES |
  13. TABLE 1 Global Non-Emergency Medical Transportation Market Size & Forecast, by Revenue (USD Billion), 2021–2035 |
  14. TABLE 2 Global Non-Emergency Medical Transportation Market – Year-over-Year Growth Analysis, 2021–2035 |
  15. TABLE 3 Global Non-Emergency Medical Transportation Market – Driver Impact Analysis |
  16. TABLE 4 Global Non-Emergency Medical Transportation Market – Restraint Impact Analysis |
  17. TABLE 5 Global Non-Emergency Medical Transportation Market Size, by Vehicle Type, 2021–2035 (USD Billion) |
  18. TABLE 6 Global Non-Emergency Medical Transportation Market Size, by Payment Type, 2021–2035 (USD Billion) |
  19. TABLE 7 Global Non-Emergency Medical Transportation Market Size, by Application, 2021–2035 (USD Billion) |
  20. TABLE 8 Global Non-Emergency Medical Transportation Market Size, by End User, 2021–2035 (USD Billion) |
  21. TABLE 9 Global Non-Emergency Medical Transportation Market Size, by Region, 2021–2035 (USD Billion) |
  22. TABLE 10 North America Non-Emergency Medical Transportation Market Size, by Country, 2021–2035 (USD Billion) |
  23. TABLE 11 Europe Non-Emergency Medical Transportation Market Size, by Country, 2021–2035 (USD Billion) |
  24. TABLE 12 Asia-Pacific Non-Emergency Medical Transportation Market Size, by Country, 2021–2035 (USD Billion) |
  25. TABLE 13 South America Non-Emergency Medical Transportation Market Size, by Country, 2021–2035 (USD Billion) |
  26. TABLE 14 Middle East & Africa Non-Emergency Medical Transportation Market Size, by Country, 2021–2035 (USD Billion) |
  27. TABLE 15 Competitive Benchmarking Matrix – Non-Emergency Medical Transportation Market, 2025 |
  28. TABLE 16 Company Profiles – Key Players, Non-Emergency Medical Transportation Market |
  29. TABLE 17 Recent Developments & Strategic Announcements, 2024–2025 |
  30. TABLE 18 North America Non-Emergency Medical Transportation Market Size, by Vehicle Type, 2021–2035 (USD Billion) |
  31. TABLE 19 North America Non-Emergency Medical Transportation Market Size, by Payment Type, 2021–2035 (USD Billion) |
  32. TABLE 20 North America Non-Emergency Medical Transportation Market Size, by Application, 2021–2035 (USD Billion) |
  33. TABLE 21 North America Non-Emergency Medical Transportation Market Size, by End User, 2021–2035 (USD Billion) |
  34. TABLE 22 Europe Non-Emergency Medical Transportation Market Size, by Vehicle Type, 2021–2035 (USD Billion) |
  35. TABLE 23 Europe Non-Emergency Medical Transportation Market Size, by Payment Type, 2021–2035 (USD Billion) |
  36. TABLE 24 Europe Non-Emergency Medical Transportation Market Size, by Application, 2021–2035 (USD Billion) |
  37. TABLE 25 Europe Non-Emergency Medical Transportation Market Size, by End User, 2021–2035 (USD Billion) |
  38. TABLE 26 Asia-Pacific Non-Emergency Medical Transportation Market Size, by Vehicle Type, 2021–2035 (USD Billion) |
  39. TABLE 27 Asia-Pacific Non-Emergency Medical Transportation Market Size, by Payment Type, 2021–2035 (USD Billion) |
  40. TABLE 28 Asia-Pacific Non-Emergency Medical Transportation Market Size, by Application, 2021–2035 (USD Billion) |
  41. TABLE 29 Asia-Pacific Non-Emergency Medical Transportation Market Size, by End User, 2021–2035 (USD Billion) |
  42. TABLE 30 South America Non-Emergency Medical Transportation Market Size, by Vehicle Type, 2021–2035 (USD Billion) |
  43. TABLE 31 South America Non-Emergency Medical Transportation Market Size, by Payment Type, 2021–2035 (USD Billion) |
  44. TABLE 32 South America Non-Emergency Medical Transportation Market Size, by Application, 2021–2035 (USD Billion) |
  45. TABLE 33 South America Non-Emergency Medical Transportation Market Size, by End User, 2021–2035 (USD Billion) |
  46. TABLE 34 Middle East & Africa Non-Emergency Medical Transportation Market Size, by Vehicle Type, 2021–2035 (USD Billion) |
  47. TABLE 35 Middle East & Africa Non-Emergency Medical Transportation Market Size, by Payment Type, 2021–2035 (USD Billion) |
  48. TABLE 36 Middle East & Africa Non-Emergency Medical Transportation Market Size, by Application, 2021–2035 (USD Billion) |
  49. TABLE 37 Middle East & Africa Non-Emergency Medical Transportation Market Size, by End User, 2021–2035 (USD Billion) |
  50. TABLE 38 United States Non-Emergency Medical Transportation Market Size, by Vehicle Type, 2021–2035 (USD Billion) |
  51. TABLE 39 United States Non-Emergency Medical Transportation Market Size, by Payment Type, 2021–2035 (USD Billion) |
  52. TABLE 40 United States Non-Emergency Medical Transportation Market Size, by Application, 2021–2035 (USD Billion) |
  53. TABLE 41 United States Non-Emergency Medical Transportation Market Size, by End User, 2021–2035 (USD Billion) |
  54. TABLE 42 Canada Non-Emergency Medical Transportation Market Size, by Vehicle Type, 2021–2035 (USD Billion) |
  55. TABLE 43 Canada Non-Emergency Medical Transportation Market Size, by Payment Type, 2021–2035 (USD Billion) |
  56. TABLE 44 Canada Non-Emergency Medical Transportation Market Size, by Application, 2021–2035 (USD Billion) |
  57. TABLE 45 Canada Non-Emergency Medical Transportation Market Size, by End User, 2021–2035 (USD Billion) |
  58. TABLE 46 Mexico Non-Emergency Medical Transportation Market Size, by Vehicle Type, 2021–2035 (USD Billion) |
  59. TABLE 47 Mexico Non-Emergency Medical Transportation Market Size, by Payment Type, 2021–2035 (USD Billion) |
  60. TABLE 48 Mexico Non-Emergency Medical Transportation Market Size, by Application, 2021–2035 (USD Billion) |
  61. TABLE 49 Mexico Non-Emergency Medical Transportation Market Size, by End User, 2021–2035 (USD Billion) |
  62. TABLE 50 Germany Non-Emergency Medical Transportation Market Size, by Vehicle Type, 2021–2035 (USD Billion) |
  63. TABLE 51 Germany Non-Emergency Medical Transportation Market Size, by Payment Type, 2021–2035 (USD Billion) |
  64. TABLE 52 Germany Non-Emergency Medical Transportation Market Size, by Application, 2021–2035 (USD Billion) |
  65. TABLE 53 Germany Non-Emergency Medical Transportation Market Size, by End User, 2021–2035 (USD Billion) |
  66. TABLE 54 United Kingdom Non-Emergency Medical Transportation Market Size, by Vehicle Type, 2021–2035 (USD Billion) |
  67. TABLE 55 United Kingdom Non-Emergency Medical Transportation Market Size, by Payment Type, 2021–2035 (USD Billion) |
  68. TABLE 56 United Kingdom Non-Emergency Medical Transportation Market Size, by Application, 2021–2035 (USD Billion) |
  69. TABLE 57 United Kingdom Non-Emergency Medical Transportation Market Size, by End User, 2021–2035 (USD Billion) |
  70. TABLE 58 France Non-Emergency Medical Transportation Market Size, by Vehicle Type, 2021–2035 (USD Billion) |
  71. TABLE 59 France Non-Emergency Medical Transportation Market Size, by Payment Type, 2021–2035 (USD Billion) |
  72. TABLE 60 France Non-Emergency Medical Transportation Market Size, by Application, 2021–2035 (USD Billion) |
  73. TABLE 61 France Non-Emergency Medical Transportation Market Size, by End User, 2021–2035 (USD Billion) |
  74. TABLE 62 China Non-Emergency Medical Transportation Market Size, by Vehicle Type, 2021–2035 (USD Billion) |
  75. TABLE 63 China Non-Emergency Medical Transportation Market Size, by Payment Type, 2021–2035 (USD Billion) |
  76. TABLE 64 China Non-Emergency Medical Transportation Market Size, by Application, 2021–2035 (USD Billion) |
  77. TABLE 65 China Non-Emergency Medical Transportation Market Size, by End User, 2021–2035 (USD Billion) |
  78. TABLE 66 India Non-Emergency Medical Transportation Market Size, by Vehicle Type, 2021–2035 (USD Billion) |
  79. TABLE 67 India Non-Emergency Medical Transportation Market Size, by Payment Type, 2021–2035 (USD Billion) |
  80. TABLE 68 India Non-Emergency Medical Transportation Market Size, by Application, 2021–2035 (USD Billion) |
  81. TABLE 69 India Non-Emergency Medical Transportation Market Size, by End User, 2021–2035 (USD Billion) |
  82. TABLE 70 Japan Non-Emergency Medical Transportation Market Size, by Vehicle Type, 2021–2035 (USD Billion) |
  83. TABLE 71 Japan Non-Emergency Medical Transportation Market Size, by Payment Type, 2021–2035 (USD Billion) |
  84. TABLE 72 Japan Non-Emergency Medical Transportation Market Size, by Application, 2021–2035 (USD Billion) |
  85. TABLE 73 Japan Non-Emergency Medical Transportation Market Size, by End User, 2021–2035 (USD Billion) |
  86. TABLE 74 South Korea Non-Emergency Medical Transportation Market Size, by Vehicle Type, 2021–2035 (USD Billion) |
  87. TABLE 75 South Korea Non-Emergency Medical Transportation Market Size, by Payment Type, 2021–2035 (USD Billion) |
  88. TABLE 76 South Korea Non-Emergency Medical Transportation Market Size, by Application, 2021–2035 (USD Billion) |
  89. TABLE 77 South Korea Non-Emergency Medical Transportation Market Size, by End User, 2021–2035 (USD Billion) |
  90. TABLE 78 Brazil Non-Emergency Medical Transportation Market Size, by Vehicle Type, 2021–2035 (USD Billion) |
  91. TABLE 79 Brazil Non-Emergency Medical Transportation Market Size, by Payment Type, 2021–2035 (USD Billion) |
  92. TABLE 80 Brazil Non-Emergency Medical Transportation Market Size, by Application, 2021–2035 (USD Billion) |
  93. TABLE 81 Brazil Non-Emergency Medical Transportation Market Size, by End User, 2021–2035 (USD Billion) |
  94. TABLE 82 Saudi Arabia Non-Emergency Medical Transportation Market Size, by Vehicle Type, 2021–2035 (USD Billion) |
  95. TABLE 83 Saudi Arabia Non-Emergency Medical Transportation Market Size, by Payment Type, 2021–2035 (USD Billion) |
  96. TABLE 84 Saudi Arabia Non-Emergency Medical Transportation Market Size, by Application, 2021–2035 (USD Billion) |
  97. TABLE 85 Saudi Arabia Non-Emergency Medical Transportation Market Size, by End User, 2021–2035 (USD Billion) |
  98. TABLE 86 Report Scope & Methodology Summary |
  99. TABLE 87 Detailed Sources and Citations
  100. 13 LIST OF FIGURES |
  101. FIGURE 1 Non-Emergency Medical Transportation Market Dynamics — Drivers, Restraints, and Opportunities |
  102. FIGURE 2 Non-Emergency Medical Transportation Market — Value Chain Analysis |
  103. FIGURE 3 Non-Emergency Medical Transportation Market — Porter's Five Forces Analysis |
  104. FIGURE 4 Global Non-Emergency Medical Transportation Market Size Trend (USD Billion), 2021–2035 |
  105. FIGURE 5 Non-Emergency Medical Transportation Market Share, by Vehicle Type (%), 2025 |
  106. FIGURE 6 Non-Emergency Medical Transportation Market Share, by Payment Type (%), 2025 |
  107. FIGURE 7 Non-Emergency Medical Transportation Market Share, by Application (%), 2025 |
  108. FIGURE 8 Non-Emergency Medical Transportation Market Share, by End User (%), 2025 |
  109. FIGURE 9 Non-Emergency Medical Transportation Market Share, by Region (%), 2025 |
  110. FIGURE 10 North America Non-Emergency Medical Transportation Market — Country Share (%), 2025 |
  111. FIGURE 11 Europe Non-Emergency Medical Transportation Market — Country Share (%), 2025 |
  112. FIGURE 12 Asia-Pacific Non-Emergency Medical Transportation Market — Country Share (%), 2025 |
  113. FIGURE 13 South America Non-Emergency Medical Transportation Market — Country Share (%), 2025 |
  114. FIGURE 14 Middle East & Africa Non-Emergency Medical Transportation Market — Country Share (%), 2025 |
  115. FIGURE 15 Non-Emergency Medical Transportation Market — Competitive Landscape Heat Map, 2025

Segmentation Quick Reference

DimensionSub-SegmentsDominant SegmentFastest Growing Segment
Vehicle TypeWheelchair-Enabled Vans, Ambulatory Vans, Stretcher Vans, Sedans and Rideshare, Hybrid and Electric VansWheelchair-Enabled VansHybrid and Electric Vans
Payment TypeMedicaid, Medicare, Managed Care Organizations, Private Insurance, Out-of-PocketMedicaidManaged Care Organizations
ApplicationDialysis Transportation, Routine Doctor Visits, Mental Health Appointments, Chemotherapy and Radiation, Physical TherapyDialysis TransportationMental Health Appointments
End UserHospitals, Nursing Care Centers, Home-Healthcare Settings, Community Health Centers, Rehabilitation FacilitiesHospitalsHome-Healthcare Settings
GeographyNorth America, Europe, Asia-Pacific, South America, Middle East & AfricaNorth AmericaAsia-Pacific


Market Segmentation Overview

By Vehicle Type

Sub-SegmentKey Trend
Wheelchair-Enabled VansSustained dominance driven by ADA compliance and aging-population demand for accessible transport
Ambulatory VansHigh-volume routing for standard Medicaid-funded ambulatory trips
Stretcher VansGrowing role in post-surgical and bariatric patient discharge transport
Sedans and RideshareExpanding as low-acuity ride-hailing integration reaches more state contracts
Hybrid and Electric VansFastest uptake segment as FTA grants and zero-emission mandates accelerate fleet electrification


Vehicle-type segmentation reflects both acuity requirements and regulatory mandates. Wheelchair-enabled vans remain essential because ADA-compliant accessible transport is non-negotiable for mobility-impaired beneficiaries, while hybrid and electric vans are rapidly entering fleets as operators pursue grant-funded cost savings and prepare for state-level emission deadlines.

By Payment Type

Sub-SegmentKey Trend
MedicaidDominant payer channel with federally mandated transportation coverage across all state programs
MedicareGrowth driven by Medicare Advantage plans adding supplemental ride benefits
Managed Care OrganizationsFastest-growing channel as states shift Medicaid administration to capitated MCO models
Private InsuranceEmerging niche as employer-sponsored plans pilot ride benefits for chronic-disease adherence
Out-of-PocketSteady baseline demand from uninsured and underinsured populations


Medicaid's structural dominance reflects federal law requiring transportation access for beneficiaries. The shift toward managed-care administration is redistributing payment flows through MCO intermediaries that demand digital verification, performance metrics, and network adequacy—reshaping the competitive requirements for brokers and providers alike.

By Application

Sub-SegmentKey Trend
Dialysis TransportationHighest volume due to recurring three-times-weekly ride schedules for ESRD patients
Routine Doctor VisitsBroad-based demand across primary care, specialist referrals, and preventive screenings
Mental Health AppointmentsFastest growth as behavioral-health parity legislation expands covered ride benefits
Chemotherapy and RadiationOncology treatment adherence programs increasingly bundle transport coordination
Physical TherapyPost-acute discharge ride coordination growing alongside home-health expansion


Dialysis transport generates predictable, high-frequency demand that lends itself to fixed-route scheduling and long-term provider contracts. Mental-health rides are accelerating as state parity laws extend transportation coverage to behavioral-health visits that were previously excluded from many Medicaid managed-care contracts.

By End User

Sub-SegmentKey Trend
HospitalsDominant end user leveraging ride coordination to reduce CMS readmission penalties
Nursing Care CentersConsistent demand for resident specialist-visit and diagnostic transport
Home-Healthcare SettingsFastest growth as payers incentivize care delivery in the home
Community Health CentersFQHC patient-access requirements driving integrated ride scheduling
Rehabilitation FacilitiesPost-acute therapy transport demand rising alongside outpatient rehabilitation trends


Hospitals drive the largest share of end-user demand because discharge planners increasingly treat ride coordination as a readmission-prevention strategy tied directly to CMS financial penalties. Home-healthcare settings are the fastest-growing end-user category as the broader shift from institutional to home-based care creates new ride-demand patterns for visiting-nurse and telehealth-follow-up appointments.


 

Download PDF ×

We do not share your information with anyone. However, we may send you emails based on your report interest from time to time. You may contact us at any time to opt-out.